

Abstract
Toll-like receptor (TLR) 2, 4, 7, and 9 agonists, together with adenosine A2A receptor (A2AR) agonists, switch macrophages from an inflammatory (M1) to an angiogenic (M2-like) phenotype. This switch involves induction of A2ARs by TLR agonists, down-regulation of tumor necrosis factor α (TNFα) and interleukin-12, and up-regulation of vascular endothelial growth factor (VEGF) and interleukin-10 expression. We show here that the TLR4 agonist lipopolysaccharide (LPS) induces rapid and specific post-transcriptional down-regulation of phospholipase C(PLC)β1 and β2 expression in macrophages by de-stabilizing their mRNAs. The PLCβ inhibitor U73122 down-regulates TNFα expression by macrophages, and in the presence of A2AR agonists, up-regulates VEGF, mimicking the synergistic action of LPS with A2AR agonists. Selective down-regulation of PLCβ2, but not PLCβ1, using small-interfering RNA resulted in increased VEGF expression in response to A2AR agonists, but did not suppress TNFα expression. Macrophages from PLCβ2−/− mice also expressed increased VEGF in response to A2AR agonists. LPS-mediated suppression of PLCβ1 and β2 is MyD88-dependent. In a model of endotoxic shock, LPS (35 μg/mouse, i.p.) suppressed PLCβ1 and β2 expression in spleen, liver, and lung of wild-type but not MyD88−/− mice. These studies indicate that LPS suppresses PLCβ1 and β2 expression in macrophages in vitro and in several tissues in vivo. These results suggest that suppression of PLCβ2 plays an important role in switching M1 macrophages into an M2-like state.
Lipopolysaccharide (LPS), a component of the cell walls of Gram-negative bacteria, is a major activator of innate immune responses, and a potent inducer of the expression of cytokines and inflammatory mediators by macrophages.1,2,3 LPS, acting through Toll-like receptor-4 (TLR4), initiates a signal transduction pathway that activates transcription factors such as nuclear factor κB (NF-κB), AP1, and CREB.4,5 These transcription factors translocate to the nucleus, bind to cis-acting elements in the promoters of a variety of genes, and strongly induce their expression. LPS is a major contributor to the symptoms of Gram-negative sepsis in humans, and insights into the mechanisms by which LPS activates macrophages are of major significance for our understanding of innate immunity and disease.1,6
Macrophages play key roles in the regulation of inflammation and wound healing, and are exquisitely sensitive to their microenvironment. Depending on particular exogenous or endogenous stimuli, they modulate their expression of an array of cytokines and growth factors,7 and can be induced to differentiate into cells that either exacerbate or inhibit inflammation. Unstimulated macrophages do not produce tumor necrosis factor α (TNFα) and make only low levels of vascular endothelial growth factor (VEGF).8 On stimulation by interferon-γ and pathogen associated molecular patterns such as LPS, double-stranded RNA, and lipoteichoic acid, or endogenous signals, such as high mobility group box-1 proteins, hyaluronan and heparan sulfate proteoglycans, macrophages acquire a pro-inflammatory phenotype.9,10,11,12 This pathway of activation is termed the “classically activated” or M1 phenotype. As a result, macrophages express high levels of interleukin-1, interleukin-6, interleukin-12, TNFα, and inducible nitric oxide synthase (iNOS), thereby exhibiting increased cytotoxic and inflammatory activities.13,14,15 Resolution of inflammation is achieved through the development of anti-inflammatory mechanisms. Macrophages can be induced to develop an anti-inflammatory phenotype, termed the M2 or “alternatively activated macrophage” by Gordon et al,16 who reported that treatment of unstimulated macrophages with interleukin-4, interleukin-13, or glucocorticoids induces their expression of cytokines, such as interleukin-10, interleukin-4, interleukin-13, and transforming growth factor-β, and up-regulates their expression of interleukin-4Rα and CD206.16,17,18,19 Unlike classically activated M1 macrophages that produce copious amounts of pro-inflammatory cytokines and exhibit potent cytotoxic activity for numerous microorganisms, M2-macrophages are anti-inflammatory, and promote angiogenesis, tissue remodeling, and repair.7,9,14,16,20,21,22,23 We have shown previously that while the TLR4 agonist LPS, and agonists of TLR2, 7, and 9, strongly induce expression of the inflammatory cytokine TNFα by macrophages, the retaliatory metabolite adenosine strongly inhibits this induction, while simultaneously up-regulating the expression of the angiogenic growth factor VEGF.8,20,24,25 Adenosine A2A receptors (A2ARs) were shown to play a key role in this phenotypic switch of macrophages from an inflammatory (M1) to an angiogenic (M2-like) phenotype, and expression of A2ARs is strongly induced by LPS. This pathway provides an interleukin-4 and interleukin-13 independent means of converting inflammatory M1 macrophages to an M2-like phenotype, which is induced by elevated microenvironmental levels of adenosine. Adenosine is a metabolite produced by breakdown of ATP that is normally present extracellularly at low levels, but that rapidly accumulates under conditions of stress, such as hypoxia, ischemia, or inflammation.26,27
In our investigations of the signaling pathways involved in this switch of macrophages from an M1 to an M2-like phenotype, we tested the effects of various inhibitors of lipid-mediated signaling. The selective phospholipase C (PLC)β inhibitor U73122 was found to strongly down-regulate LPS-induced expression of TNFα by macrophages, while synergizing with A2AR agonists to up-regulate VEGF expression. In this article, we report that signaling through the phosphatidyl-inositol-specific phospholipase Cβ2 (PLCβ2) isoform plays a key role in this regulation of macrophage activation, and the surprising observation that LPS rapidly and selectively down-regulates the expression of PLCβ1 and PLCβ2 isoforms both in vitro in macrophages, and in vivo in several tissues.
Materials and Methods
Chemicals and Reagents
The specific A2AR agonists 2-[p-(2-carboxyethyl)-phenylethyl amino]−5′-N-ethyl carboxamidoadenosine (CGS-21680) and the nonspecific AR agonist 5′-N-ethylcarboxamidoadenosine (NECA) were purchased from Sigma Chemical Co. (St. Louis, MO). The PLC inhibitor 1-(6-[17β−3-methoxyestra-1,3,5—(10)triene-17-yl]amino/hexyl) 1H-pyrroledione (U73122) and its inactive analog 1-[6 [17β−3-methoxyestra-3,5-(10)triene-17-yl]amino/hexyl)2,5-pyrroledione (U73433) were purchased from BioMol International (Plymouth Meeting, PA). Phenol-extracted Escherichia coli LPS (a TLR4 agonist free of TLR2 agonists) was kindly provided by Dr. Stefanie Vogel (University of Maryland). Antibodies to PLCβ1 (sc-205), β2 (sc-206), β4 (sc-404), PLCγ1 (sc-7290) and PLCγ2 (sc-407), PLCδ1 (sc-30062), as well as secondary antibodies and small-interfering RNA (siRNA) oligonucleotides (sc-36267 for PLCβ1 siRNA and sc-36271 for PLCβ2 siRNA) were purchased from Santa Cruz Biotechnology, Inc (Santa Cruz, CA). Antibodies to nucleophosmin (no. 3542) and PLCβ3 (no. 2482) were purchased from Cell Signaling Technology, Inc (Danvers, MA), and an antibody to α-tubulin (no. T6074) was purchased from Sigma-Aldrich, Inc (St. Louis, MO).
Animals
C57Bl/6J mice were purchased from Jackson Laboratories (Bar Harbor, ME) and housed in the New Jersey Medical School animal facility. Mice on the C57Bl/6J background with a specific deletion of the MyD88 gene (MyD88−/− mice) were kindly provided by Dr. Shizuo Akira (Osaka University, Japan). Heterozygous mice (MyD88+/−) were bred to provide MyD88−/− and MyD88+/+ mice as litter mate controls. MyD88 mice were maintained in a barrier facility under specific pathogen-free conditions. Mice with a targeted disruption of the PLCβ2 gene (PLCβ2−/− mice) were developed by Dr. D. Wu, and were provided courtesy of the University of Rochester. These mice were also bred on a C57Bl/6J background. All animal procedures were reviewed and approved by the New Jersey Medical School Institutional Animal Care and Use Committee.
Preparation of Macrophages
Mouse peritoneal macrophages were harvested as previously described8 with some modifications. Seven to eight-week-old mice were intraperitoneally injected with 2.5 ml of thioglycolate broth (DIFCO, Detroit, MI; 4% w/v). Four days later, mice were sacrificed by cervical dislocation and peritoneal macrophages were harvested and cultured as a monolayer in RPMI 1640 medium (Cellgro, Mediatech, Inc, Herndon, VA), supplemented with 10% fetal bovine serum (FBS; Gemini Bio-Products, Calabasas, CA), 2 mmol/L l-glutamine, 100 IU/ml Penicillin and 100 μg/ml Streptomycin (Irvine Scientific, Santa Ana, CA). The cultures were found to be >98% pure, as assessed by nonspecific esterase staining and staining with the macrophage specific F4/80 mAb.
Cell Culture
RAW264.7 cells were obtained from American Type Culture Collection (Manassas, VA) and maintained in RPMI 1640 medium, supplemented as described above. The cells were grown at 37°C in a humidified incubator in 5% CO2 and 95% air. All experiments were performed at a concentration of 1 × 10⁶ cells/ml of medium. The cells were plated 20 to 24 hours before stimulation.
Cytotoxicity Assay
To assess the cytotoxic effects of various treatments on macrophage viability, an MTT assay was used.28 Media was removed from each well at the end of the incubation period and replaced with methyl thiazole tetrazolium (3-(4, 5-dimethylthiazol-2-yl)−2,5-diphenyltetrazolium bromide) (MTT) in RPMI 1640 without serum and phenol red (50 mg/ml MTT). The plates were then incubated at 37°C for 2 hours. Medium was then removed, cells were washed with PBS, and 250 μl of dimethyl sulfoxide was added for 5 minutes to dissolve the blue formazan product. An aliquot (100 μl) of the solution from each well was then transferred to a 96-well plate, and absorption was read at 550 nm with a 690 nm reference wavelength.
siRNA Transfection of RAW264.7 Cells
Electroporation was used to transfect cells with anti-PLCβ2 and anti-PLCβ1 siRNA oligonucleotides. Since primary macrophages are resistant to transfections, we used the macrophage-like RAW264.7 cell line, which is more readily transfected. Both anti-PLCβ2 and anti- PLCβ1 siRNAs were comprised of a pool of three separate complementary strands combined together and annealed to produce a double-stranded RNA. Compositions of these sense strands, as well as those of corresponding negative controls (scrambled siRNAs with the same nucleotide composition, but no significant sequence homology to the mouse genome) are listed in Table 1. Cells were transfected by using an Amaxa Nucleofector (Walkersville, MD) following Amaxa Protocol no. D032 optimized for RAW264.7 cells. Following transfection, cells were transferred into 60 mm culture dishes or 6-well plates and incubated overnight before further treatment.
Table 1.
Sequences of Anti-PLCβ1 and Anti-PLCβ2 siRNAs
| PLCβ2 siRNA (sc-36271)* | PLCβ1 siRNA (sc-36267)* |
|---|---|
| Sense strand (A) | Sense strand (A) |
| 5′-CCACUGAAUCACUAUUUCA-3′ | 5′-CCAAGUGUUGAUUGAGAAA-3′ |
| Scrambled control | Scrambled control |
| 5′-GCUUUCAUCCCCAAUUAAA-3′ | 5′GAGCAGAUAUACGUUAGUA3′ |
| Sense strand (B) | Sense strand (B) |
| 5′-CCACAGAUAUCUUGUUCAA-3′ | 5′-CCACAGAAGAGAUGUCUAA-3′ |
| Scrambled control | Scrambled control |
| 5′-GCAUAUCUCCUAGUAACAU-3′ | 5′GCAAAUCUAAGGCAUAGCA-3′ |
| Sense strand (C) | Sense strand (C) |
| 5′-GCAAGAUCCUCAUUAAGAA-3′ | 5′-CCAGAGCGUGUUAACAGAA-3′ |
| Scrambled control | Scrambled control |
| 5′-GUGCCUAACCUGAAAUAAA-3′ | 5′GGCUUAACGGACAGCUAAA-3′ |
The siRNAs were purchased from Santa Cruz Biotechnology and consisted of a pool of three separate complementary strands combined together to produce double-stranded RNA.
Isolation of RNA for Quantitative RT-PCR Analysis
Mouse peritoneal macrophages were plated in 60 mm dishes (4 × 10⁶ cells/dish). Following overnight incubation, cells were treated with various reagents as indicated in the figure legends. RNA was isolated by using TRIzol reagent (Invitrogen Corporation, Carlsbad, CA) according to the manufacturer’s protocol and quantified by using SYBR Green II (Sigma-Aldrich). Integrity of the RNA was analyzed by electrophoresis on formaldehyde agarose gels.
cDNA
cDNA was synthesized from total RNA by using TaqMan Reverse Transcription Reagents (Applied Biosystems, Foster City, CA) following the manufacturer’s instructions. Real-time quantitative PCRs were performed by means of TaqMan technology by using ABI 7500 Real-time PCR System (Applied Biosystems). PLCβ1, PLCβ2, and PLCβ3 primers and probes were designed by using Applied Biosystems Primer Express 2.0 software and synthesized at the University of Medicine and Dentistry of New Jersey Molecular Resource Facility. 5′-ends of the probes were labeled with the fluorescent dye 6-carboxy fluorescene and 3′-ends were coupled to the quencher molecule Black Hole QuencherTM dye-1. The sequences of the primers and probes are listed in Table 2. For each sample, mRNA levels were normalized to that of endogenous cyclophilin D (Applied Biosystems’ Assay identification no. Mm00835365_g1). Cyclophilin D was used as a housekeeping gene, since it was determined in our prior studies that its expression does not change significantly as a result of the treatments used in these experiments.
Table 2.
Sequences of Primers and Probes for Q-RT-PCR Analyses of mRNA Levels*
| mRNA levels | Sequence |
|---|---|
| PLCβ1 | Forward primer: 5′–TGCACGCCTTGCAACTCA–3′ |
| Reverse primer: 5′–CATCCCACTTGACGAATTTGG–3′ | |
| Probe: 5′–FAM - CCGTGTGCGTGTCCGACAGCC-BHQ–3′ | |
| PLCβ2 | Forward primer: 5′–CTGCCCTCGGTGCTTGTC–3′ |
| Reverse primer: 5′–TTGTACACGGATTCTGGGAAGTC–3′ | |
| Probe: 5′– FAM - TTGCAAAAGGCAAAAATGATGCTATCAACC-BHQ–3′ | |
| PLCβ3 | Forward primer: 5′–GAACGCCTCCCGGAACA–3′ |
| Reverse primer: 5′–ATCCGTCCATCCTGGTTCAC–3′ | |
| Probe: 5′–FAM - CTTCCTGCGGAAAGCATACACGAAGC–BHQ–3′ |
Primers and probes were designed by using Applied Biosystems’ Primer Express 2.0 software and synthesized at the University of Medicine and Dentistry of New Jersey Molecular Resource Facility. 5′-endsof the probes were labeled with the fluorescent dye 6-carboxy fluorescene (FAM), and 3′-ends were coupled to the quencher molecule, Black HoleQuencherTM dye-1 (BHQ-1).
Immunoprecipitation and Western Blot Analyses
After the various treatments, cells were lysed by adding radioimmunoprecipitation assay (RIPA) buffer containing complete protease inhibitor cocktail (sc-29130, Santa Cruz). The contents were scraped into a microcentrifuge tube and passed through a 21-gauge needle to fragment the DNA. Samples were centrifuged at 10,000×G for 10 minutes and an aliquot was used for a Bradford-based protein determination. Cell lysates were boiled for 5 minutes with SDS-Laemmli buffer and aliquots containing 50 μg of protein were loaded onto 10% SDS-polyacrylamide gels for electrophoresis. Following electrophoresis, proteins were transferred to nitrocellulose membranes (Protran, Whatman, Dassel, Germany) by using a Bio-Rad semidry transfer system, according to the manufacturer’s instructions. The membranes were then blocked with 5% milk in Tris-buffered saline with 0.1% Tween 20 for 1 hour, washed, and then incubated with primary antibodies at dilutions of 1:500 to 1:2000 overnight. The blots were then washed with Tris-buffered saline with 0.1% Tween 20 and incubated for 1 hour with alkaline phosphatase-conjugated secondary IgG antibody (1:5000 to 1:20,000). Immunoreactive bands were developed by using a chemiluminescent substrate ECL Plus (GE Health care, Piscataway, NJ) and an autoradiograph was obtained by using a Typhoon 9410 analyzer (GE Health Care). For analysis of mouse tissues, 100 mg liver, lung, and spleen were homogenized and extracted with RIPA buffer containing complete protease inhibitor cocktail, and processed as described above. Lysates containing 100 μg protein in 500 μl were precleared by adding control IgG, together with 20 μl Protein A/G-Agarose (Santa Cruz). The lysates were incubated at 4°C for 30 minutes, and the beads were pelleted by centrifugation at 1000 × g for 5 minutes at 4°C. The supernatants were transferred to a fresh microcentrifuge tube, 1 μg primary antibody was added, and the samples were incubated overnight at 4°C. Immunoprecipitates were collected by centrifugation at 1000 × g for 5 minutes at 4°C. The pellets were washed (×2) with RIPA buffer, dissolved in 40 μl SDS-Laemmle sample buffer, and analyzed by electrophoresis and Western blotting as described above.
VEGF and TNFα Assays
VEGF and TNFα levels in macrophage-conditioned media were assayed by using a corresponding sandwich enzyme-linked immunosorbent assay kit (R&D Systems, Minneapolis, MN), according to the manufacturer’s protocol. Each sample was assayed in duplicate and results were presented as means ± SD.
Plasmids and Constructs
PCR was used to amplify a cDNA fragment of 3986 bp, encompassing the whole mouse PLCβ2 promoter region (−3946 to + 38.). Forward primer was designed with a site for the restriction enzyme Mlu I and a 5′ terminal GC-clamp: 5′- GGCGC-ACGCGT-GCACCTGGTCCGTATTTTGT-3′. Reverse primer also had a 5′-terminal GC clamp, followed by the restriction site for XhoI: 5′ GGCCG-CTCGAG-CACGTTAGGGGGCAATAGAA −3′. The PCR amplicon was cloned into the pGL3 basic (promoterless) luciferase vector (Promega Corporation, Madison, WI) to generate a reporter plasmid for the PLCβ2 promoter. The cloned PCR product was sequenced, and confirmed to be identical to the published sequence of the mouse PLCβ2 5′ upstream region.
Transient Transfections and Reporter Assays
Plasmids were prepared by using Endofree plasmid maxiprep kit (Sigma-Aldrich). Transient transfections were performed by using Superfect (Qiagen, Inc, Valencia, CA), following the manufacturer’s guidelines. Cells were co-transfected with the Renilla luciferase vector, phRL-TK (Promega), to normalize for transfection efficiency. After 18 hours incubation, the transfectants were resuspended in fresh medium and allowed to adhere for 6 to 7 hours at 37°C. The medium was then changed to RPMI 1640 with 1% FBS, and the cells were stimulated as follows: LPS (100 ng/ml); NECA (1 μmol/L); LPS with NECA, or control medium—1% FBS in RPMI. After 22 hours incubation, cells were lysed with passive lysis buffer (Promega) and luciferase assays were performed by using the Dual luciferase Assay Kit (Promega) following the manufacturer’s protocol. Luciferase light units were measured by using Lmax Luminescence Microplate Reader (Molecular Devices, Sunnyvale, CA) using dual injector system. The results reported are representative of at least three independent experiments. An NF-κB promoter luciferase reporter plasmid (pNFκB-Luc, CLONTECH, San Diego, CA) that responds to LPS was used as a positive control for LPS treatment. This NF-κB luciferase vector contains four tandem copies of the NF-κB consensus sequence fused to a TATA-like promoter region from the herpes simplex virus thymidine kinase promoter. pTAL-Luc (the enhancerless reporter vector lacking the NF-κB promoter elements) was used as a negative control.
Nuclear Run-On Assay
Nuclear run-on analysis was performed by using a modification of the protocol described by Greenberg and Bender,29 as follows: 5 × 10⁷ RAW264.7 cells were harvested and rinsed (×2) with ice-cold PBS. The cell pellet was resuspended in 10 ml of sucrose buffer I (0.32 M sucrose with 0.5% v/v Nonidet NP40 and 1 mmol/L DTT). Cells were disrupted by using a Dounce homogenizer to release intact nuclei. To collect nuclei, 10 ml of sucrose buffer II (2 M sucrose) were added to the homogenized cells and mixed well. The homogenate was then layered on a sucrose cushion (10 ml of sucrose buffer II), and centrifuged for 45 minutes at 30,000 g at 4°C. The supernatant was removed, and the nuclear pellet was gently resuspended in 200 μl ice-cold glycerol storage buffer. The nuclei were then aliquoted into chilled 1.5-ml microcentrifuge tubes and stored at −80°C before use in the transcriptional run-on assay.
For the analysis of PLCβ2 transcription, a 141 bp region in the vicinity of third PLCβ2 exon (Transcript Accession no. NM_177568, Region 349-489) was cloned into the pPCR-Script plasmid (Stratagene, La Jolla, CA). pPCR-Script with a β-actin insert was used as a positive control, and the empty pPCR-Script vector was used as a control for hybridization specificity. Two hundred fifty micrograms of each plasmid were linearized with XhoI, denatured at room temperature by addition of 1M NaOH, and neutralized by addition of 6× standard saline citrate. Ten micrograms of each linearized plasmid was applied to a 0.45 μ BioBond nylon membrane (Sigma-Aldrich), using a slot blot apparatus. The membrane was air dried overnight and baked for 20 minutes at 80°C in a vacuum oven. For the transcriptional run-on assay, 200 μl of nuclei were used for each treatment. Two hundred microliters of 2× reaction buffer with nucleotides plus 10 μl [α-32P]-UTP (10 mCi/ml, Perkin Elmer, Waltham, MA) was added, and incubated for 30 minutes at 30°C with gentle shaking. RNase-free DNase I (Qiagen) and high salt buffer were added to the labeled nuclei and mixed thoroughly. After a short incubation at room temperature, SDS/Tris buffer and proteinase K were added and incubated for 30 minutes at 42°C. TRIzol reagent (Invitrogen) was then used to extract and precipitate RNA according to the manufacturer’s instructions. RNA was re-dissolved in 50 μl 50% formamide in diethylpyrocarbonate-treated water. A 5-μl aliquot of each sample was counted and determined to have more than 5 × 10⁶ cpm/ml. The labeled RNAs were then mixed with an equal volume of 10mM N-tris(hydroxymethyl) methyl-2-aminoethanesulfonic acid, pH7.4, 10mM EDTA, 0.2% (w/v) SDS/NaCl solution, and incubated with the cDNA plasmids immobilized on the nylon membranes for 36 hours at 65°C with shaking in a hybridization oven. After hybridization, the membrane strips were washed with 2× standard saline citrate, digested with RNase A, and washed again in 2× standard saline citrate. Finally, membranes were air-dried, and analyzed by using a Typhoon 9410 Phosphorimager (GE Health care).
In Vivo Model of Acute Endotoxemia
C57Bl/6J wild-type and MyD88−/− mice were injected i.p. with LPS (1.4 μg/g body weight in PBS). Additional mice were injected with PBS alone as controls. Mice were sacrificed at various time points (0 to 18 hours) following injection, and liver, lung, and spleen samples were flash frozen in liquid nitrogen. The tissues were then homogenized and extracted with TRIzol (Invitrogen) for the preparation of total RNA, or with RIPA buffer containing complete protease inhibitor cocktail for the preparation of protein extracts. RNA extracts were processed for quantitative RT-PCR (Q-RT-PCR) as described above. Protein extracts were processed by immuno-precipitation and Western blot analysis as described above.
Statistical Analysis
Differences between groups were analyzed by the unpaired Student’s t-test or one-way analysis of variance followed by Dunnett’s test, as appropriate, by using the statistical analysis programs in KaleidaGraph software (Synergy Software, Reading, PA). All data are presented as mean ± SEM unless otherwise indicated. P values <0.05 are considered significant.
Results
U73122, A Selective PLCβ Inhibitor, Modulates VEGF and TNFα Expression by Macrophages
U73122 is an antagonist of phosphoinositide-specific PLC.30,31 Macrophages were pretreated for 30 minutes with U73122 (0 to 10 μmol/L), and then incubated for 18 hours in the presence of this compound with LPS, NECA, CGS-21680, or LPS with NECA, or LPS with CGS-21680, as described above. As shown in Figure 1, U73122 alone had little effect on VEGF production by control or LPS-treated macrophages. However, in the presence of NECA, U73122 induced a dose-dependent increase in VEGF production (half maximal inhibitory concentration = ∼ 2 μmol/L). On the other hand, U73122 inhibited LPS-induced TNFα production in a dose-dependent manner, (IC50 = ∼2 μmol/L). The concentration of U73122 that induced VEGF expression was similar to that for the inhibition of TNFα production. U73122 was not toxic to the cells at concentrations up to 10 μmol/L. The maximum increase in VEGF production was close to that observed by the combined action of LPS with NECA, but U73122 together with LPS/NECA did not augment VEGF production beyond the increase induced by LPS with these adenosine receptor agonists alone. Similar results were obtained by using the more specific A2AR agonist CGS21680 (data not shown). U73343, a relatively inactive analog of U73122, had only minor effects on TNFα and VEGF expression. Also, similar effects of U73122 were observed by using RAW264.7 cells (data not shown).
Figure 1.

U73122, a selective PLCβ inhibitor, modulates VEGF and TNFα expression by macrophages. Mouse peritoneal macrophages from C57Bl/6J mice were pretreated for 30 minutes with U73122 (0, 0.4, 2.5, and 10 μmol/L). LPS (100 ng/ml), NECA (1 μmol/L), or LPS with NECA were then added. Conditioned media were harvested after 18 hours incubation and assayed for VEGF (left) and TNFα (right) content by enzyme-linked immunosorbent assay. Data are the mean ± SEM of triplicates from an experiment that was repeated at least three times with similar results.
LPS Suppresses the Expression of Select PLC Protein and mRNA Isoforms
To determine whether LPS treatment of macrophages affects the level of PLC isoforms, macrophages from C57Bl/6J mice were treated for 24 hours with LPS, NECA, a combination of LPS and NECA in RPMI-1% FBS, or with RPMI-1% FBS alone as control, followed by lysis and Western blot analysis as described above. As shown in Figure 2, A and B, levels of PLCβ1and PLCβ2 were markedly reduced by LPS, while levels of PLCβ3, PLCβ4, PLCγ1, and PLCδ1 were not affected. Reduction of PLCβ2 protein levels was apparent by as early as 8 hours following LPS treatment. NECA treatment did not affect the levels of PLC isoforms, and the suppression of PLCβ1 and PLCβ2 by LPS was not affected by NECA treatment. LPS treatment of RAW264.7 cells induced a similar suppression of PLCβ1 and PLCβ2 isoforms (data not shown).
Figure 2.

LPS suppresses the expression of select PLC isoforms at both the protein and mRNA levels in macrophages. Murine peritoneal macrophages from C57Bl/6J mice were treated with LPS (100 ng/ml) (L), NECA (1 μmol/L) (N), a combination of LPS and NECA (LN), or with RPMI-1% FBS alone as control (C). A: Following treatment for 24 hours, media were removed, cells were solubilized in SDS-polyacrylamide gel electrophoresis sample buffer and lysates (50 μg protein/sample) were Western-blotted with the indicated antibodies. Nucleophosmin (NPM) was used as a control house-keeping gene. Similar results were obtained in at least three independent experiments. B: Band intensities of PLCβ1, PLCβ2, and PLCβ3 Western blots were quantified by using the ImageQuant analysis program (GE Health care). *P < 0.01 (L or LN different from C). C: Following treatment of macrophages for 2, 4, and 8 hours, RNA was extracted from each sample, and analyzed by Q-RT-PCR. For each sample, mRNA levels were normalized to those of endogenous cyclophilin D as a house-keeping gene. Graphs show relative levels of PLCβ1 (left) and PLCβ2 (right) mRNAs. *P < 0.01 (LPS or LPS/NECA different from Control).
To determine whether LPS alters the steady state mRNA levels of the various PLC isoforms, RNA was extracted from control, LPS, NECA, or LPS/NECA-treated macrophages and Q-RT-PCR was performed. Markedly reduced levels of mRNA for both PLCβ1 and PLCβ2 were observed within 2 hours of treatment, with suppression of mRNA being apparent for at least several hours (Figure 2 C.) In contrast to the reduced levels of PLCβ1 and PLCβ2, mRNA steady state levels of PLCβ3 were slightly increased by LPS (data not shown).
LPS-induced Down-Regulation of PLCβ1 and PLCβ2 Expression Is Post-Transcriptional
Suppression of PLCβ1 and PLCβ2 gene expression could be regulated transcriptionally or post-transcriptionally. To investigate the mechanism of PLCβ down-regulation by LPS, we examined the effects of LPS on the stability of the transcribed mRNAs and on the transcription of the PLCβ1 and PLCβ2 genes. To investigate whether the LPS-induced down-regulation is mediated by modulation of the stability of mRNA, we performed an mRNA stability assay.32 Mouse peritoneal macrophages were treated with Actinomycin D (10 μg/ml) for 2 hours to block transcription. The cells were then treated with either LPS (100 ng/ml) or control (1% FBS/RPMI) for various times. Total RNA was isolated and mRNA levels of PLCβ1 and PLCβ2 isoforms were quantified by using Q-RT-PCR, to determine the rate of degradation of mRNA. The results of these experiments are shown in Figure 3A. PLCβ1 and PLCβ2 mRNAs were extremely stable in control cells (half life >12 hours), but in LPS-treated cells the mRNAs were markedly destabilized (half life ∼2.5 hours). Both peritoneal macrophages and RAW 264.7 cells (data not shown) showed the destabilization of PLCβ2 and PLCβ1 mRNAs by LPS treatment. These results strongly suggest that regulation of mRNA stability plays an important role in the LPS-mediated down-regulation of PLCβ1 and PLCβ2 expression.
Figure 3.

LPS-induced down-regulation of PLCβ1 and PLCβ2 expression in macrophages is post-transcriptional. To determine the effects of LPS on the stability of PLCβ1 and PLCβ2 mRNAs, murine peritoneal macrophages from C57Bl/6J mice were treated with actinomycin D (10 μg/ml) for 2 hours, followed by either LPS (100 ng/ml) or control medium (1% FBS/RPMI) in the presence of actinomycin D for 0, 1, 3, 5, and 8 hours. Total RNA was isolated and mRNA levels were quantitated by using Q-RT-PCR. For each sample, mRNA levels were normalized to that of endogenous cyclophilin D as a house-keeping gene. PLCβ1 (left) and PLCβ2 (right) mRNA levels are shown in A. The graphs show representative time courses of three separate experiments. B: To analyze the effects of LPS on PLCβ2 transcription, a PLCβ2 promoter luciferase reporter plasmid (pPLCβ2-Luc) was constructed by using the pGL3 basic vector. RAW264.7 cells were co-transfected with pPLCβ2-Luc or pGL3 together with a Renilla luciferase plasmid and incubated for 24 hours. The cells were then treated with LPS (100 ng/ml), NECA (1 μmol/L), LPS with NECA, or medium control for 18 hours, lysed and assayed for Renilla and firefly luciferase activity. C: RAW264.7 cells were co-transfected with an NF-κB promoter luciferase reporter plasmid (pNFκB-Luc) and the Renilla luciferase plasmid, as a positive control for LPS treatment. pTAL-Luc (the enhancerless reporter vector lacking the NF-κB promoter elements) was used as a negative control. D: A nuclear run-on assay was performed for a direct analysis of transcriptional regulation. RAW264.7 cells were treated with either LPS (100 ng/ml) or control media for 2 hours and intact nuclei were isolated. Nuclei were then labeled in vitro with 32P-UTP to allow the completion of transcription of initiated transcripts. These in vitro-labeled RNAs were then isolated and hybridized to a nylon membrane preloaded with linearized plasmids containing either a PLCβ2 cDNA probe, a β-actin probe (housekeeping gene), or the empty pPCR-Script plasmid. E: Quantified results of the nuclear run-on hybridization for PLCβ2 of untreated and LPS-treated RAW264.7 cells. Results shown are mean ± SEM for triplicate analyses. Values are normalized to the corresponding levels of β-actin.
To determine whether LPS also affects the expression of PLCβ2 at the transcriptional level, a PLCβ2 promoter construct was engineered and transfected into RAW264.7 cells. To generate the reporter construct of the PLCβ2 promoter region, the sequence of the open reading frame of PLCβ2 gene was identified in GenBank (GeneID: 18796). The sequence upstream of the PLCβ2 open reading frame was then selected, including the transcriptional start site and 5′untranslated region, plus an additional ∼4 kb of upstream sequence. This region has been reported previously to incorporate the PLCβ2 promoter.33 This region was amplified by PCR, and cloned into the pGL3 basic (promoterless) luciferase vector, creating pPLCβ2-Luc construct. RAW 264.7 cells were then transiently co-transfected with pPLCβ2-Luc together with a Renilla luciferase plasmid. These transiently transfected cells were then treated with LPS, NECA, or both, lysed and assayed for Renilla and firefly luciferase activity to determine whether PLCβ2 promoter activity is affected by LPS treatment. A pNFκB-Luc plasmid was used as a positive control for LPS treatment, and pTAL-Luc was used as a negative control. As shown in Figure 3B, RAW264.7 cells transfected with the pPLCβ2-Luc construct expressed high levels of luciferase in comparison with cells transfected with the pGL3-Luc control plasmid. LPS or NECA did not induce any significant changes in the expression of luciferase activity as compared with the controls. Efficacy of LPS in this system was apparent by the induction of luciferase expression from the pNFκB-Luc vector (Figure 3C). These results suggest that LPS is not transcriptionally down-regulating PLCβ2 expression by affecting promoter activity.
To confirm the results of the PLCβ2 promoter analysis regarding the mode of down-regulation of PLCβ2 in response to LPS treatment in a more direct manner, we performed a nuclear run-on experiment. For this assay, nuclei of RAW264.7 cells treated with either LPS or control media were labeled in vitro with 32P- UTP to complete the transcription of all initiated gene transcripts. The labeled in vitro transcribed RNAs were isolated and hybridized to a membrane preloaded with linearized plasmids containing either a PLCβ2 cDNA probe, a β-actin probe (housekeeping gene), or no insert (hybridization control). Specific binding of radio-labeled RNA was quantified by using the ImageQuant analysis program (GE Health care). This assay measures the level of transcription of the PLCβ2 gene induced by the relevant stimulus. Figure 3D shows the nuclear run-on hybridization analysis for PLCβ2 for untreated RAW264.7 cells and for cells treated with LPS for 2 hours before isolation of nuclei. For each group, the labeling of PLCβ2 was normalized to the level of β-actin. The quantified levels of PLCβ2 transcripts are shown in Figure 3E. Clearly, significant alteration of PLCβ2 transcription was not induced by LPS treatment. Similar results were obtained following 4 hours of LPS-treatment (data not shown). Thus, the results of the nuclear run-on experiment confirm those of the PLCβ2 promoter analysis described above, and strongly suggest that the down-regulation of PLCβ2 expression induced by LPS is mediated post-transcriptionally.
Selective siRNA-mediated Depletion of PLCβ2, but not of PLCβ1, Results in Increased VEGF Expression by RAW264.7 Cells in Response to A2AR Ligation
The results presented above suggest that inhibition of PLCβ2 using a specific inhibitor induces a change in macrophages that enables them to respond to the treatment with adenosine A2A receptor agonists by up-regulating VEGF expression. To test this hypothesis, we transfected siRNAs into RAW264.7 cells to selectively down-regulate the expression of either the PLCβ1 or PLCβ2 isoforms. siRNAs were electroporated into RAW264.7 cells as described above. Controls included blank transfections and transfections with scrambled siRNAs. A strong down-regulation of the expression of PLCβ1, but not of PLCβ2, was induced by the PLCβ1 siRNA transfection at both the mRNA and protein levels. In a similar manner, a strong down-regulation of PLCβ2 but not of PLCβ1 was induced by PLCβ2 siRNA transfection. Figure 4A, shows Western blot analyses of the expression of PLCβ1and PLCβ2 18 hours following transfection with corresponding siRNAs and controls. Figure 4B, shows the corresponding Q-RT-PCR analyses of PLCβ2 and PLCβ1 mRNA levels 18 hours following siRNA treatment. A clear reduction in the level of both protein and mRNA was induced by the siRNAs in a dose dependent manner. Once specific siRNA-mediated depletion was achieved, transfected cells were treated for 18 hours with LPS, NECA, or LPS/NECA as described earlier, to determine the effects of the depletion on production of TNFα and VEGF in response to LPS and A2AR agonists.
Figure 4.

siRNA-mediated depletion of PLCβ2, but not of PLCβ1, results in increased VEGF expression by RAW264.7 cells in response to A2AR ligation. PLCβ1 and PLCβ2 siRNAs (along with corresponding scrambled siRNAs) were electroporated into RAW264.7 cells by using Amaxa nucleofection. A: Western blot analyses of the expression of PLCβ1 (top) and PLCβ2 (bottom) 18 hours following transfection with increasing concentrations of corresponding siRNAs and scrambled siRNA controls (Sc). RAW264.7 cells were also treated in parallel with LPS (100 ng/ml) (L), NECA (1 mmol/L) (N), LPS with NECA (LN), or control medium (C). B: The corresponding Q-RT-PCR analyses of PLCβ1 and PLCβ2 mRNA levels 18 hours following siRNA treatment. Negative controls included nucleofected scrambled siRNAs and a “No zap” control, where the cells were incubated with siRNAs without nucleofection. Untransfected cells were also treated in parallel with LPS (100 ng/ml) as a control for the down-regulation of PLCβ1 (left) and PLCβ2 (right) expression. C–F: siRNA-transfected cells were incubated for 18 hours with LPS (100 ng/ml), NECA (1 μmol/L), LPS with NECA, or control medium. C and D: TNFα levels produced by PLCβ1 and PLCβ2 siRNA-treated cells, respectively (*P < 0.01 for LPS-induced TNFα production in siRNA-treated versus untreated cells). E and F: VEGF levels secreted by PLCβ1 and PLCβ2 siRNA-treated cells, respectively (*P < 0.01 for NECA-induced VEGF production in siRNA-treated versus untreated cells). Data are the mean ± SEM of triplicates from an experiment that was repeated at least three times with similar results.
As shown in Figure 4C, siRNA suppression of PLCβ1 resulted in the production of increased amounts of TNFα with increasing amounts of transfected PLCβ1 siRNA. In these transfected cells, NECA induced a similar suppression of LPS-induced TNFα production as in control cells, suggesting that PLCβ1 is not involved in the A2AR-mediated suppression of TNFα expression. Similarly, siRNA down-regulation of PLCβ2 also resulted in increased expression of TNFα in response to LPS, and did not block the down-regulation of LPS-induced TNFα expression by NECA (Figure 4D). Scrambled siRNAs for both PLCβ1 and PLCβ2 did not up-regulate TNFα expression, suggesting the effects of the siRNAs are specific.
In contrast to control cells, which show little response to NECA, strong induction of VEGF expression was induced by NECA in cells treated with PLCβ2 siRNA, but not in PLCβ1 siRNA-treated cells (Figure 4E and F). Sham-transfected cells and cells transfected with scrambled siRNAs responded in a manner similar to nontransfected cells. It is notable that strong up-regulation of VEGF expression was induced even at the level of 1-μg PLCβ2 siRNA, where depletion of PLCβ2 mRNA was not yet apparent. siRNA mediates its effects both by suppressing translation, as well as by promoting degradation of its target mRNA. As PLCβ2 protein was clearly reduced at this siRNA dose (Figure 4A, bottom), it is likely that the lower dose of siRNA used here is functioning to block translation, while degradation is only induced at the higher doses.
Overall, these results suggest that PLCβ2, but not PLCβ1, plays an important role in regulating the response of macrophages to A2AR stimulation. The response of PLCβ2 depleted cells to NECA in terms of the production of VEGF expression matches that observed in response to the PLCβ2 inhibitor U73122. However, these results suggest that U73122, unlike the siRNAs that specifically target PLCβ2, does not limit its pharmacological action to PLCβ2, as LPS-induced TNFα expression was suppressed by U73122, while PLCβ2-specific siRNAs increased TNFα expression.
Expression of TNFα and VEGF by Macrophages from Mice Lacking the PLCβ2 Gene (PLCβ2−/− Mice)
PLCβ2 expression by macrophages from PLCβ2−/− mice was undetectable, by both RT-PCR and Western analyses (data not shown). Macrophages obtained from knockout and wild-type mice were treated in parallel with LPS, or with various concentrations of NECA (100 nmol/L to 5 μmol/L). As shown in Figure 5A, NECA stimulated a marked increase in VEGF secretion by macrophages from PLCβ2−/− mice while having only a minor effect in macrophages from wild-type mice. Similar results were obtained by using CGS21680 (data not shown). VEGF expression in response to LPS and NECA was strongly up-regulated in wild-type and PLCβ2−/− macrophages to a similar extent. To compare the effects of NECA on the inhibition of TNFα production in macrophages from PLCβ2−/− mice versus the wild-type macrophages, cells were treated with various concentrations of LPS (0 to 100 ng/ml) in the presence or absence of NECA (1 μmol/L). As shown in Figure 5B, TNFα production by macrophages from PLCβ2−/− mice in response to LPS was similar to that of macrophages from wild-type mice, and the down-regulation of TNFα expression by NECA in PLCβ2−/− macrophages was also similar to that in wild-type mice.
Figure 5.
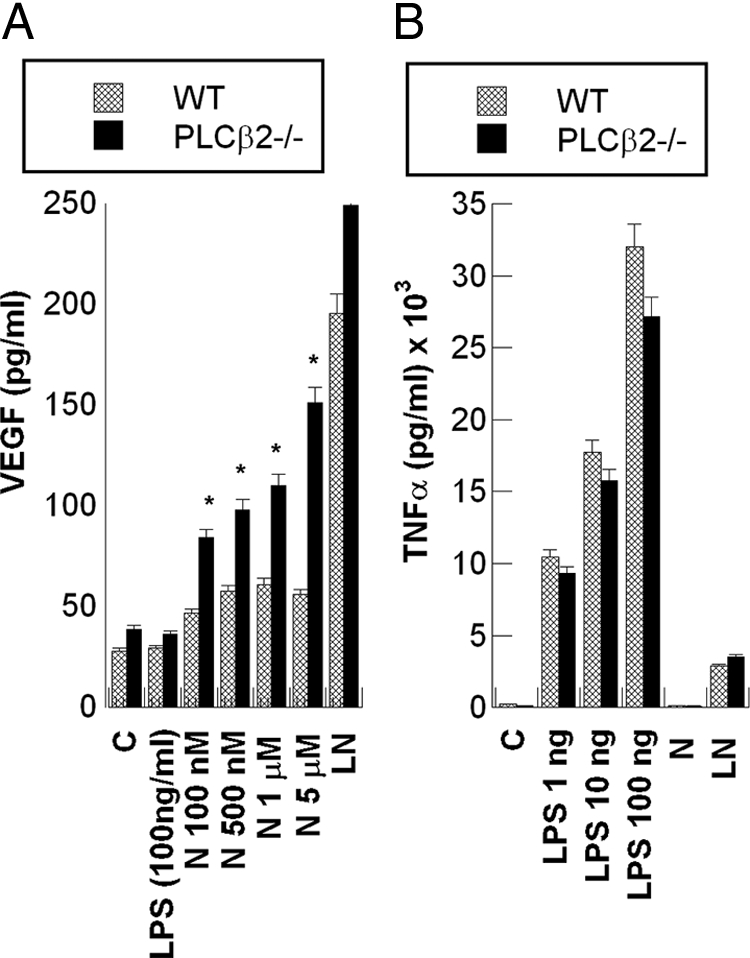
Expression of TNFα and VEGF by macrophages from mice lacking the PLCβ2 gene (PLCβ2−/− mice). Macrophages obtained from mice specifically engineered to lack the PLCβ2 gene (PLCβ2−/−) and C57Bl/6J wild-type (WT) mice were treated in parallel with the indicated concentrations of LPS (1 to 100 ng/ml) or NECA (100 nmol/L to 5 μmol/L). A: A comparison of VEGF levels secreted by wild-type versus PLCβ2−/− macrophages in response to increasing concentrations of NECA (N). B: A comparison of TNFα production by macrophages from wild-type and PLCβ2−/− mice in response to increasing concentration of LPS. Data are the mean ± SEM of triplicates from an experiment that was repeated at least three times with similar results. *P < 0.01 (PLCβ2−/− versus wild-type).
MyD88 is an Important Adaptor Required for the Suppression of PLCβ1 and PLCβ2 Expression by LPS in Macrophages
MyD88 is a key adapter molecule involved in mediating signaling by most TLRs.34,35,36 Signaling through TLR4, which is a critical receptor for LPS, is transmitted through a MyD88-dependent pathway, as well as through a MyD88-independent pathway that involves adaptors such as TRIF.36,37 To determine whether the down-regulation of PLCβ1 and β2 isoforms requires LPS signaling through MyD88, or whether this effect is mediated in a MyD88-independent manner, expression of these PLCβ isoforms in response to LPS was determined in macrophages from MyD88 knockout mice. Figure 6A, shows the mRNA levels of PLCβ1 and β2 in wild-type versus MyD88−/− macrophages; Figure 6B, shows Western blot analyses of PLCβ1 and PLCβ2 expression in wild-type versus MyD88−/− macrophages. While LPS caused a strong suppression of PLCβ1 and PLCβ2 expression at both the mRNA and protein levels in wild-type macrophages, no suppression of these isoforms was seen in the MyD88−/− macrophages. These results clearly indicate that MyD88-dependent signaling is required for the suppression of PLCβ1 and PLCβ2 expression by LPS.
Figure 6.

MyD88 is an important adaptor required for the suppression of PLCβ1 and PLCβ2 expression by LPS in macrophages. Macrophages from MyD88−/− mice and C57Bl/6J wild-type (WT) controls were treated with LPS (100 ng/ml) or medium control. mRNA was isolated from the cells after 0, 2, 4, and 8 hours. Total protein was isolated after 18 hours incubation. A: The quantified relative mRNA levels of PLCβ1 (left) and β2 (right) in wild-type versus MyD88−/− macrophages. Data are the mean ± SEM of triplicates from an experiment that was repeated at least three times with similar results. B: Typical Western blot analyses for PLCβ1 (top) and PLCβ2 (bottom) protein isoforms, respectively, in lysates of wild-type and MyD88−/− macrophages treated with LPS (L) or control medium (C) for 18 hours.
LPS Administration to Mice in vivo in a Model of Acute Endotoxemia Suppresses the Expression of PLCβ1 and PLCβ2
To study whether LPS administration in vivo might modulate the expression of PLC isoforms, C57Bl/6 wild-type and MyD88−/− mice were injected i.p. with LPS (1.4 μg/g body weight in PBS) or PBS alone. LPS induced a rapid and time–dependent suppression of both PLCβ1 and PLCβ2 mRNAs in liver, lung, and spleen of wild-type mice (Figure 7, A–F). This suppression was apparent by 2 hours, and reached a maximum of >80% by 4 to 5 hours. PLCβ1 and PLCβ2 protein levels analyzed by immunoprecipitation were also decreased 18 hours following treatment with LPS. Western blots for PLCβ2 are shown in Figure 8, A and B.
Figure 7.

LPS administration to mice in vivo in a model of acute endotoxemia suppresses the expression of PLCβ1 and PLCβ2 mRNA. C57Bl/6 wild-type mice were injected i.p. with LPS (1.4 μg/g body weight in PBS) or with PBS alone as controls. Mice were sacrificed at various time points (0 to 5 hours) following injection, and their liver, lungs, and spleen were flash frozen in liquid nitrogen. The tissues were homogenized and extracted with TRIzol (Invitrogen) for the preparation of total RNA. The RNA samples were then processed for Q-RT-PCR, and the levels of PLCβ1 and PLCβ2 mRNAs were determined. Cyclophilin D mRNA levels (house-keeping gene) were also determined. A, C, E. The levels of PLCβ1 mRNA normalized to cyclophilin D over the 5-hour time course in liver, lung, and spleen following LPS or PBS injection. B, D, F. The levels of PLCβ2 mRNA. Data are the mean ± SEM of triplicates from an experiment that was repeated at least three times with similar results.
Figure 8.

LPS administration to mice in vivo in a model of acute endotoxemia suppresses the expression of PLCβ2 protein in liver, lung, and spleen. C57Bl/6 wild-type (WT) mice were injected i.p. with LPS (1.4 μg/g body weight in PBS) or with PBS alone as control. Mice were sacrificed at 18 hours following injection, and their liver, lungs, and spleen were flash frozen in liquid nitrogen. The tissues were homogenized and extracted with RIPA buffer containing protease inhibitor cocktail. The samples were then immunoprecipitated with an anti-PLCβ2 antibody, electrophoresed on SDS-polyacrylamide gel electrophoresis, and Western blotted. A: Typical immunoblots comparing control and LPS-treated PLCβ2 levels. B: The quantitated relative band intensities of the PLCβ2 bands. Data are the mean ± SEM of triplicates from an experiment that was repeated three times with similar results.
To determine whether the LPS-mediated down-regulation of PLCβ1 and β2 in vivo was MyD88 dependent, the effect of LPS administration to MyD88−/− mice was compared with that in wild-type mice. In contrast to its effects in wild-type mice, LPS did not induce significant suppression of PLCβ1 and PLCβ2 mRNAs in MyD88−/− mice (Figure 9, A and B). These results indicate that the LPS-mediated suppression of PLCβ1 and PLCβ2 that we observed in macrophages in vitro is mirrored in an in vivo model of LPS-induced acute endotoxemia.
Figure 9.
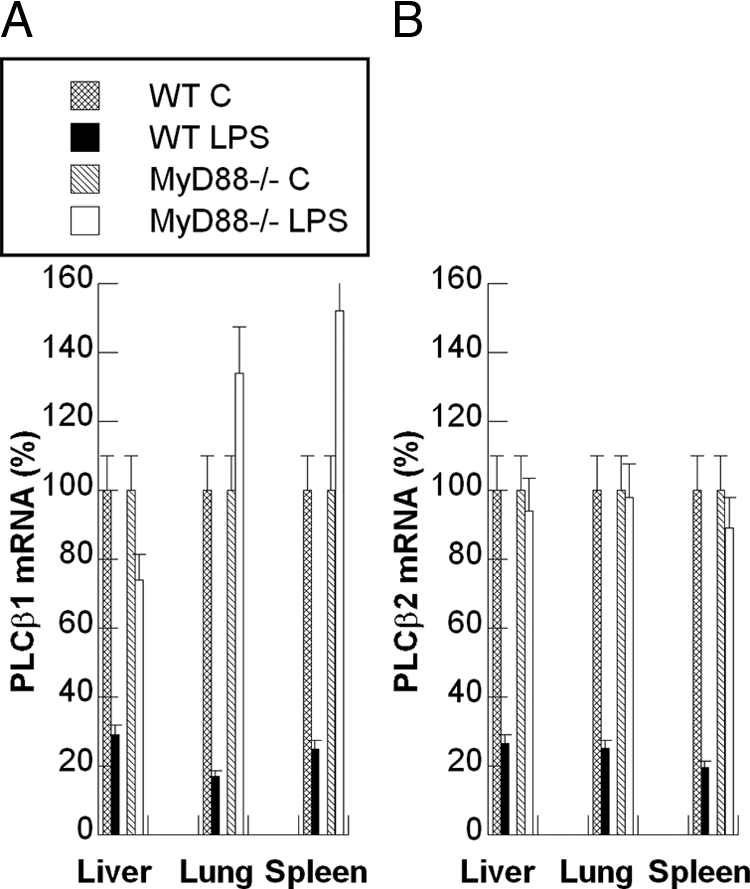
LPS-mediated down-regulation of PLCβ1 and β2 in vivo is MyD88-dependent. The effects of LPS administration to MyD88−/− mice on the levels of PLCβ1 and PLCβ2 were compared with those in C57Bl/6J (WT) mice in vivo. As described in Figure 7, LPS or PBS was injected i.p. into wild-type and MyD88−/− mice. Four hours following injection, mice were sacrificed and their liver, lungs, and spleen were flash frozen in liquid nitrogen. The tissues were then processed as described in Figure 7, and levels of PLCβ1 and PLCβ2 mRNA were determined by using Q-RT-PCR and normalized to those of cyclophilin-D. A and B: The quantified relative levels of PLCβ1 and PLCβ2 mRNA, respectively. Data are the mean ± SEM of triplicates from an experiment that was repeated at least three times with similar results.
Discussion
Phosphatidylinositol-specific PLC plays a crucial role in the initiation of receptor mediated signal transduction by hydrolyzing the highly phosphorylated lipid phosphatidylinositol 4,5-bisphosphate [PI(4,5)P2], generating two intracellular products: inositol 1,3,4,-trisphosphate—a universal calcium-mobilizing second messenger; and diacylglycerol—an activator of protein kinase C.38,39 At least 13 different isoforms of mammalian PLC isozymes have been discovered, including PLCβ1–4, PLCγ1, PLCγ2, PLCσ1, PLCε, and others, with molecular weights ranging from 85 to 165 kDa.38,39,40 There is tissue-specific distribution of these isoforms, but all are involved in generation of lipid second messengers in response to stimuli in a receptor-mediated manner.41 While PLC activation generally occurs at the plasma membrane, certain PLC isoforms have also been shown in the Golgi apparatus and nucleus.42,43 Phosphoinositide signaling disorders have been implicated in the pathogenesis of human diseases ranging from cancer to type 2 diabetes.44
PLCβ isoforms are activated by heterotrimeric GTP-binding proteins linked to various cell surface receptors. All PLCβ isoforms can be activated by members of the Gq family of α subunits, while PLCβ2 and PLCβ3 can also be potently activated by Gβγ.39 PLCβs are key signaling proteins in the cellular action of many hormones, neurotransmitters, growth factors, and other extracellular stimuli.45 PLCβ isozymes share many of the structural features present in other members of the PLC family, including conserved catalytic X and Y domains, two membrane-phospholipid binding regions and the PH and C2 domains. PLC-β isozymes, however, are distinguished by the presence of an elongated C-terminus, which contains many of the determinants for interaction with Gq as well as for other functions such as membrane binding and nuclear localization.39
We and others have shown previously that macrophages play an important role in regulating angiogenic responses by producing the angiogenic growth factor VEGF.8,20,24,46,47,48 Unstimulated macrophages do not produce VEGF, and activation of macrophages by exposure to LPS induces the expression of inflammatory mediators such as TNFα, interleukin-12, and iNOS, but not of VEGF or interleukin-10.20,49 Macrophages activated by LPS have been termed M1 or “classically activated” macrophages.7,50 We have shown recently that treatment of M1 macrophages with adenosine or adenosine A2AR agonists results in a switch of these macrophages from an M1 to an M2-like phenotype, characterized by the down-regulation of TNFα, interleukin-12, and iNOS, and the up-regulation of VEGF and interleukin-10 expression.8,20,25 This switch requires the up-regulation of A2AR expression by LPS in a MyD88, IRAK-4, TRAF6, and NF-κB-dependent manner.20 LPS also transcriptionally up-regulates HIF1α expression, which is then stabilized in an A2AR-dependent manner under normoxic conditions, resulting in the transcriptional up-regulation of VEGF expression through activation of the Hypoxia Response Element in the VEGF promoter.25 In our studies of the signaling pathways involved in A2AR-dependent induction of VEGF expression, we examined the effects of several inhibitors of various signaling pathways in macrophages. Of interest in these studies was the observation that U73122, an inhibitor of PLC that has been reported to selectively inhibit PLCβ2,31 induced a dose-dependent increase in VEGF production by macrophages in the presence of A2AR agonists such as CGS 21680 or NECA. It appeared from this study that U73122 was mimicking the effects of LPS in terms of its ability to synergize with A2AR agonists to stimulate VEGF expression, thus suggesting that LPS might act to alter the activity or expression of PLCs as part of its effects on macrophage function.
In the studies reported here, we investigated the effects of LPS on the expression of PLC isoforms in macrophages. LPS was found to induce a strong and sustained suppression of PLCβ1 and PLCβ2 at both the mRNA and protein levels, while mildly increasing expression of PLCβ3 mRNA. Expression of several other PLC isoforms (PLCβ4, PLCγ1, PLCδ1) was not affected. This suppression of PLCβ1 and β2 was apparent at the protein level within 8 hours of LPS challenge, and at the mRNA level within 2 hours. The suppression of PLCβ1 and PLCβ2 was shown to be mediated largely at the level of mRNA stability, rather than at the transcriptional level. While mRNA for these PLC isoforms under nonstimulated conditions, was extremely stable (t1/2 > 12 hours), the stability of these mRNAs was dramatically shortened in LPS-treated cells (t1/2 = ∼2.5 hours). RAW264.7 cells transfected with a luciferase reporter plasmid for the PLCβ2 promoter (pPLCβ2-Luc) did not show significant modulation of luciferase expression in response to LPS, suggesting that LPS does not modulate PLCβ1 and PLCβ2 expression at the transcriptional level. In addition, a nuclear run-on analysis did not show altered levels of PLCβ1 or PLCβ2 transcripts in response to LPS challenge, directly supporting the conclusion that LPS does not regulate PLCβ1 and PLCβ2 gene transcription, but rather regulates their levels by de-stabilizing their mRNAs. MyD88 signaling is required for this suppression, as it is not observed in macrophages from MyD88−/− mice.
We have shown previously that RAW264.7 cells mimic macrophages in their response to LPS and A2AR agonists.8 To determine the functional significance of the LPS-mediated down-regulation of PLCβ1 and PLCβ2, RAW264.7 cells were selectively depleted of these isoforms by using siRNA. While down-regulation of PLCβ1 had no significant effect on NECA-induced VEGF expression, down-regulation of PLCβ2 resulted in greatly increased expression of VEGF in response to NECA. These results indicate that suppression of PLCβ2 plays an important role in the A2AR-mediated induction of VEGF expression in macrophages. However, TNFα expression in response to LPS treatment was not altered, and suppression of TNFα expression induced by A2AR agonists was similar to that in control cells. This suggests that PLCβ2 is involved in only part of the “angiogenic switch” of macrophages, namely, that which results in the up-regulation of VEGF expression, but not in the A2AR-dependent suppression of TNFα expression. The role of PLCβ2 suppression in the regulation of VEGF was confirmed by using macrophages from mice specifically engineered to lack the PLCβ2 gene.51 While the absence of PLCβ2 in macrophages results in their increased response to NECA in the absence of LPS, this effect is not as profound as that observed in siRNA-treated RAW264.7 cells. Since these mice lack PLCβ2 throughout their development and growth, it is likely that compensatory mechanisms have developed in the PLCβ2−/− mice that are not present in the siRNA-treated cells, resulting in the blunting of their response to NECA. TNFα expression by PLCβ2−/− macrophages in response to LPS is similar to that of macrophages from wild-type mice. This again indicates that the effects of the pharmacological inhibitor U73122 are not limited to PLCβ2, as U73122 down-regulates LPS-induced TNFα expression. Why PLCβ2-specific siRNAs up-regulate TNFα expression in response to LPS is not clear. However, it could be, for example, that these siRNAs might indirectly affect the expression levels of TLR4, thus magnifying the effect of LPS on TNFα expression, an effect that would not exist in the PLCβ2−/− mice. Further studies will be required to clarify this observation.
While LPS has been shown in numerous studies to strongly up-regulate the expression of an array of genes that play important roles in inflammation and repair, there have been only occasional reports of LPS suppressing gene expression. For example, LPS-induced down-regulation of Signal Regulatory Protein-α, an essential regulatory protein of LPS-mediated innate immune activation, has been reported.52 Similarly, LPS-mediated down-regulation of Iron Regulatory Protein-1 (IRP1), Elk-3, scavenger receptor B1, and the ATP binding cassette transporter A1 has been reported.52,53,54,55,56,57 The down-regulation of Iron Regulatory Protein-1 was shown to be dependent on the LPS-dependent induction of nitric oxide by the inducible nitric oxide synthase.54 The LPS-induced suppression of PLCβ2 reported here is mediated through a MyD88-dependent pathway, but could also require the induction of a down-stream mediator such as nitric oxide or TNFα. The LPS-induced suppression of PLCβ2 reported here plays a key role in the response of macrophages to stimulation through A2ARs, and modifies the expression of VEGF by these cells. PLCβ2 thus occupies an important position as a mediator of the switch of macrophages from an M1 to an M2-like phenotype.
To determine whether the LPS-mediated suppression of PLCβ1 and PLCβ2 observed in vitro in macrophages also occurs in vivo, we used an in vivo model of LPS-induced acute endotoxemia. LPS induced a rapid and sustained down-regulation of PLCβ1 and PLCβ2 in liver, spleen, and lung. In mice lacking the MyD88 gene (MyD88−/− mice), LPS did not induce the strong depletion of PLCβ1 and PLCβ2 observed in wild-type mice, indicating that the suppression observed in vivo is MyD88-dependent, in a manner analogous to that observed in vitro in macrophages. While liver, lung, and spleen all contain high numbers of resident macrophages, we have not yet analyzed which cell types within these tissues show the LPS-mediated suppression. The functional significance in vivo of the LPS-induced suppression also remains to be determined.
Several prior studies have suggested that PLC activities are involved in the activation of macrophages and other cell types by LPS.58,59,60 The molecular mechanisms of LPS-induced macrophage activation have been shown previously to involve several signal transduction pathways. Among them, protein kinase C, protein kinase A, src-related tyrosine kinases, and mitogen-activated protein kinases such as ERK, JNK, and p38, are especially important in the induction of pro-inflammatory gene expression.59 Pittner and Spitzer61 showed that LPS inhibits PI-PLC but not PC-PLD in liver parenchymal cells. PI-PLC and PC-PLC activities were shown to be involved in LPS-induced iNOS expression in RAW264.7 cells.62 LPS stimulation of PC-PLC resulted in activation of p42/44 mitogen-activated protein kinases in human alveolar macrophages.63 Recent studies in mice lacking PLCβ2, PLCβ3, or both, have shown that chemokine-induced G-protein-coupled PLC activation is greatly reduced, with neutrophils and macrophages exhibiting defective Ca++ efflux in response to chemoattractants including fMLP, interleukin-8, and several other G-protein coupled ligands.51,64,65 Nevertheless, despite this defect, no significant chemotactic defects were observed in either neutrophils or macrophages from these PLCβ null mice. Similarly, adhesive capacity, phagocytosis, and uptake of oxLDL and apoptotic cells were unaffected. While the viability of macrophages from these mice was similar to that of controls, macrophages from PLCβ3-null mice have been shown to exhibit hypersensitivity to several inducers of apoptosis.66 This has led to the proposal that PLCβ3 plays a role in enhancing macrophage survival. In an atherosclerosis model, mice null for PLCβ3 and ApoE showed increased apoptosis and decreased survival of macrophages in developing atherosclerotic lesions, and reduced atherosclerotic lesion size compared with ApoE null controls.66 Our results presented here indicate that PLCβ2 plays a novel and key role in regulating the switch of macrophages from an inflammatory (M1) phenotype to an angiogenic (M2-like) phenotype, suggesting that regulation of this pathway might provide an additional target for the regulation of inflammation, wound healing, and fibroproliferative responses that form the basis of many chronic inflammatory diseases.
In summary, we have found that U73122, a selective PLCβ2 inhibitor, sensitizes macrophages to stimulation through A2ARs, and results in increased production of VEGF by macrophages, as well as suppression of TNFα production in response to LPS. LPS was found to strongly suppress PLCβ1 and PLCβ2 expression in macrophages, but did not suppress other PLC isoforms. This suppression was mediated post-transcriptionally by destabilization of mRNA, and requires signaling through a MyD88-dependent pathway. Selective depletion of PLCβ1 and PLCβ2 by using siRNA showed that PLCβ2, but not PLCβ1, is involved in the A2AR-dependent signaling pathway that mediates the induction of VEGF expression in macrophages. This was confirmed by using macrophages from mice lacking PLCβ2. Finally, LPS administration to wild-type, but not MyD88−/− mice, results in the down-regulation of PLCβ1 and PLCβ2 in liver, spleen, and lung, mimicking the effects of LPS on macrophages in vitro. These results suggest an important role for PLCβ2 as a modulator of LPS and adenosine signaling in innate immunity, by regulating the M1/M2 phenotype of macrophages, and provide a potential target for the pharmacological modulation of macrophages in the context of inflammatory diseases.
Acknowledgments
MyD88 KO mice were kindly provided by Dr. Shizuo Akira (Osaka University, Japan). PLCβ2 KO mice were developed by Dr. Dianqing Wu and provided courtesy of the University of Rochester. Phenol-extracted E. Coli LPS free of contaminating TLR2 agonists was kindly provided by Dr. Stefanie Vogel (University of Maryland).
Footnotes
Address reprint requests to Samuel Joseph Leibovich, Department of Cell Biology and Molecular Medicine, Cardiovascular Research Institute, New Jersey Medical School, University of Medicine and Dentistry of New Jersey, 185 South Orange Avenue, Newark, NJ 07103. E-mail: leibovic@umdnj.edu.
Supported by the US Public Health Sciences (grant RO1GM06836) and the National Institutes of Health Training Grant fellowship (5 T32 HL069752).
References
- Cohen J. The immunopathogenesis of sepsis. Nature. 2002;420:885–891. doi: 10.1038/nature01326. [DOI] [PubMed] [Google Scholar]
- Bosshart H, Heinzelmann M. Targeting bacterial endotoxin: two sides of a coin. Ann NY Acad Sci. 2007;1096:1–17. doi: 10.1196/annals.1397.064. [DOI] [PubMed] [Google Scholar]
- Gioannini TL, Weiss JP. Regulation of interactions of Gram-negative bacterial endotoxins with mammalian cells. Immunol Res. 2007;39:249–260. doi: 10.1007/s12026-007-0069-0. [DOI] [PubMed] [Google Scholar]
- Kawai T, Akira S. Signaling to NF-kappaB by Toll-like receptors. Trends Mol Med. 2007;13:460–469. doi: 10.1016/j.molmed.2007.09.002. [DOI] [PubMed] [Google Scholar]
- Kawai T, Akira S. TLR signaling. Cell Death Differ. 2006;13:816–825. doi: 10.1038/sj.cdd.4401850. [DOI] [PubMed] [Google Scholar]
- Lu YC, Yeh WC, Ohashi PS. LPS/TLR4 signal transduction pathway. Cytokine. 2008;42:145–151. doi: 10.1016/j.cyto.2008.01.006. [DOI] [PubMed] [Google Scholar]
- Mosser DM, Edwards JP. Exploring the full spectrum of macrophage activation. Nat Rev Immunol. 2008;8:958–969. doi: 10.1038/nri2448. [DOI] [PMC free article] [PubMed] [Google Scholar]
- Leibovich SJ, Chen JF, Pinhal-Enfield G, Belem PC, Elson G, Rosania A, Ramanathan M, Montesinos C, Jacobson M, Schwarzschild MA, Fink JS, Cronstein B. Synergistic up-regulation of vascular endothelial growth factor expression in murine macrophages by adenosine A(2A) receptor agonists and endotoxin. Am J Pathol. 2002;160:2231–2244. doi: 10.1016/S0002-9440(10)61170-4. [DOI] [PMC free article] [PubMed] [Google Scholar]
- Goerdt S, Politz O, Schledzewski K, Birk R, Gratchev A, Guillot P, Hakiy N, Klemke CD, Dippel E, Kodelja V, Orfanos CE. Alternative versus classical activation of macrophages. Pathobiology. 1999;67:222–226. doi: 10.1159/000028096. [DOI] [PubMed] [Google Scholar]
- Shirali AC, Goldstein DR. Activation of the innate immune system by the endogenous ligand hyaluronan. Curr Opin Organ Transplant. 2008;13:20–25. doi: 10.1097/MOT.0b013e3282f3df04. [DOI] [PubMed] [Google Scholar]
- Kaczorowski DJ, Mollen KP, Edmonds R, Billiar TR. Early events in the recognition of danger signals after tissue injury. J Leukoc Biol. 2008;83:546–552. doi: 10.1189/jlb.0607374. [DOI] [PubMed] [Google Scholar]
- Johnson GB, Brunn GJ, Kodaira Y, Platt JL. Receptor-mediated monitoring of tissue well-being via detection of soluble heparan sulfate by Toll-like receptor 4. J Immunol. 2002;168:5233–5239. doi: 10.4049/jimmunol.168.10.5233. [DOI] [PubMed] [Google Scholar]
- Gordon S, Taylor PR. Monocyte and macrophage heterogeneity. Nat Rev Immunol. 2005;5:953–964. doi: 10.1038/nri1733. [DOI] [PubMed] [Google Scholar]
- Mosser DM. The many faces of macrophage activation. J Leukoc Biol. 2003;73:209–212. doi: 10.1189/jlb.0602325. [DOI] [PubMed] [Google Scholar]
- Mills CD, Kincaid K, Alt JM, Heilman MJ, Hill AM. M-1/M-2 macrophages and the Th1/Th2 paradigm. J Immunol. 2000;164:6166–6173. doi: 10.4049/jimmunol.164.12.6166. [DOI] [PubMed] [Google Scholar]
- Gordon S. Alternative activation of macrophages. Nat Rev Immunol. 2003;3:23–35. doi: 10.1038/nri978. [DOI] [PubMed] [Google Scholar]
- Gough MJ, Melcher AA, Ahmed A, Crittenden MR, Riddle DS, Linardakis E, Ruchatz AN, Emiliusen LM, Vile RG. Macrophages orchestrate the immune response to tumor cell death. Cancer Res. 2001;61:7240–7247. [PubMed] [Google Scholar]
- Goerdt S, Orfanos CE. Other functions, other genes: alternative activation of antigen-presenting cells. Immunity. 1999;10:137–142. doi: 10.1016/s1074-7613(00)80014-x. [DOI] [PubMed] [Google Scholar]
- Gordon S. The macrophage: past, present and future. Eur J Immunol. 2007;37(suppl 1):S9–S17. doi: 10.1002/eji.200737638. [DOI] [PubMed] [Google Scholar]
- Pinhal-Enfield G, Ramanathan M, Hasko G, Vogel SN, Salzman AL, Boons GJ, Leibovich SJ. An angiogenic switch in macrophages involving synergy between Toll-like receptors 2, 4, 7, and 9 and adenosine A(2A) receptors. Am J Pathol. 2003;163:711–721. doi: 10.1016/S0002-9440(10)63698-X. [DOI] [PMC free article] [PubMed] [Google Scholar]
- Mantovani A, Sozzani S, Locati M, Allavena P, Sica A. Macrophage polarization: tumor-associated macrophages as a paradigm for polarized M2 mononuclear phagocytes. Trends Immunol. 2002;23:549–555. doi: 10.1016/s1471-4906(02)02302-5. [DOI] [PubMed] [Google Scholar]
- Ramanathan M, Luo W, Csoka B, Lukashev D, Sitkovsky MV, Hasko G, Leibovich SJ. Differential regulation of HIF-1{alpha} isoforms in murine macrophages by TLR4 and adenosine A2A receptor agonists. J Leukoc Biol. 2009;86:681–689. doi: 10.1189/jlb.0109021. [DOI] [PMC free article] [PubMed] [Google Scholar]
- Mantovani A, Sica A, Sozzani S, Allavena P, Vecchi A, Locati M. The chemokine system in diverse forms of macrophage activation and polarization. Trends Immunol. 2004;25:677–686. doi: 10.1016/j.it.2004.09.015. [DOI] [PubMed] [Google Scholar]
- Ramanathan M, Giladi A, Leibovich SJ. Regulation of vascular endothelial growth factor gene expression in murine macrophages by nitric oxide and hypoxia. Exp Biol Med. 2003;228:697–705. doi: 10.1177/153537020322800608. [DOI] [PubMed] [Google Scholar]
- Ramanathan M, Pinhal-Enfield G, Hao I, Leibovich SJ. Synergistic up-regulation of vascular endothelial growth factor (VEGF) expression in macrophages by adenosine A2A receptor agonists and endotoxin involves transcriptional regulation via the hypoxia response element in the VEGF promoter. Mol Biol Cell. 2007;18:14–23. doi: 10.1091/mbc.E06-07-0596. [DOI] [PMC free article] [PubMed] [Google Scholar]
- Cronstein BN. Adenosine receptors and wound healing. ScientificWorld Journal. 2004;4:1–8. doi: 10.1100/tsw.2004.1. [DOI] [PMC free article] [PubMed] [Google Scholar]
- Hasko G, Cronstein BN. Adenosine: an endogenous regulator of innate immunity. Trends Immunol. 2004;25:33–39. doi: 10.1016/j.it.2003.11.003. [DOI] [PubMed] [Google Scholar]
- Denizot F, Lang R. Rapid colorimetric assay for cell growth and survival: modifications to the tetrazolium dye procedure giving improved sensitivity and reliability. J Immunol Methods. 1986;89:271–277. doi: 10.1016/0022-1759(86)90368-6. [DOI] [PubMed] [Google Scholar]
- Greenberg ME, Bender TP. Identification of newly transcribed RNA. Curr Protoc Mol Biol. 2007;Ch. 4:Unit 4 10. doi: 10.1002/0471142727.mb0410s78. [DOI] [PubMed] [Google Scholar]
- Wang JP. U-73122, an aminosteroid phospholipase C inhibitor, may also block Ca2+ influx through phospholipase C-independent mechanism in neutrophil activation. Naunyn Schmiedebergs Arch Pharmacol. 1996;353:599–605. doi: 10.1007/BF00167177. [DOI] [PubMed] [Google Scholar]
- Hou C, Kirchner T, Singer M, Matheis M, Argentieri D, Cavender D. In vivo activity of a phospholipase C inhibitor, 1-(6-((17beta-3-methoxyestra-1,3,5(10)-trien-17-yl)amino)hexyl)-1H-pyrrole -2,5-dione (U73122), in acute and chronic inflammatory reactions. J Pharmacol Exp Ther. 2004;309:697–704. doi: 10.1124/jpet.103.060574. [DOI] [PubMed] [Google Scholar]
- Ross J. mRNA stability in mammalian cells. Microbiol Rev. 1995;59:423–450. doi: 10.1128/mr.59.3.423-450.1995. [DOI] [PMC free article] [PubMed] [Google Scholar]
- Kim JW, Roberts C, Maruyama Y, Berg S, Roper S, Chaudhari N. Faithful expression of GFP from the PLCbeta2 promoter in a functional class of taste receptor cells. Chem Senses. 2006;31:213–219. doi: 10.1093/chemse/bjj021. [DOI] [PubMed] [Google Scholar]
- Arancibia SA, Beltran CJ, Aguirre IM, Silva P, Peralta AL, Malinarich F, Hermoso MA. Toll-like receptors are key participants in innate immune responses. Biol Res. 2007;40:97–112. doi: 10.4067/s0716-97602007000200001. [DOI] [PubMed] [Google Scholar]
- O'Neill LA. The role of MyD88-like adapters in Toll-like receptor signal transduction. Biochem Soc Trans. 2003;31:643–647. doi: 10.1042/bst0310643. [DOI] [PubMed] [Google Scholar]
- Kenny EF, O'Neill LA. Signalling adaptors used by Toll-like receptors: an update. Cytokine. 2008;43:342–349. doi: 10.1016/j.cyto.2008.07.010. [DOI] [PubMed] [Google Scholar]
- Weighardt H, Holzmann B. Role of Toll-like receptor responses for sepsis pathogenesis. Immunobiology. 2007;212:715–722. doi: 10.1016/j.imbio.2007.09.010. [DOI] [PubMed] [Google Scholar]
- Harden TK, Sondek J. Regulation of phospholipase C isozymes by ras superfamily GTPases. Annu Rev Pharmacol Toxicol. 2006;46:355–379. doi: 10.1146/annurev.pharmtox.46.120604.141223. [DOI] [PubMed] [Google Scholar]
- Rhee SG. Regulation of phosphoinositide-specific phospholipase C. Annu Rev Biochem. 2001;70:281–312. doi: 10.1146/annurev.biochem.70.1.281. [DOI] [PMC free article] [PubMed] [Google Scholar]
- Divecha N, Irvine RF. Phospholipid signaling. Cell. 1995;80:269–278. doi: 10.1016/0092-8674(95)90409-3. [DOI] [PubMed] [Google Scholar]
- Homma Y, Takenawa T, Emori Y, Sorimachi H, Suzuki K. Tissue- and cell type-specific expression of mRNAs for four types of inositol phospholipid-specific phospholipase C. Biochem Biophys Res Commun. 1989;164:406–412. doi: 10.1016/0006-291x(89)91734-8. [DOI] [PubMed] [Google Scholar]
- Cocco L, Martelli AM, Barnabei O, Manzoli FA. Nuclear inositol lipid signaling. Adv Enzyme Regul. 2001;41:361–384. doi: 10.1016/s0065-2571(00)00017-0. [DOI] [PubMed] [Google Scholar]
- Cocco L, Martelli AM, Gilmour RS, Rhee SG, Manzoli FA. Nuclear phospholipase C and signaling. Biochim Biophys Acta. 2001;1530:1–14. doi: 10.1016/s1388-1981(00)00169-4. [DOI] [PubMed] [Google Scholar]
- Pendaries C, Tronchere H, Plantavid M, Payrastre B. Phosphoinositide signaling disorders in human diseases. FEBS Lett. 2003;546:25–31. doi: 10.1016/s0014-5793(03)00437-x. [DOI] [PubMed] [Google Scholar]
- Suh PG, Park JI, Manzoli L, Cocco L, Peak JC, Katan M, Fukami K, Kataoka T, Yun S, Ryu SH. Multiple roles of phosphoinositide-specific phospholipase C isozymes. BMB Rep. 2008;41:415–434. doi: 10.5483/bmbrep.2008.41.6.415. [DOI] [PubMed] [Google Scholar]
- Ribatti D, Nico B, Crivellato E, Vacca A. Macrophages and tumor angiogenesis. Leukemia. 2007;21:2085–2089. doi: 10.1038/sj.leu.2404900. [DOI] [PubMed] [Google Scholar]
- Crowther M, Brown NJ, Bishop ET, Lewis CE. Microenvironmental influence on macrophage regulation of angiogenesis in wounds and malignant tumors. J Leukoc Biol. 2001;70:478–490. [PubMed] [Google Scholar]
- Barrientos S, Stojadinovic O, Golinko MS, Brem H, Tomic-Canic M. Growth factors and cytokines in wound healing. Wound Repair Regen. 2008;16:585–601. doi: 10.1111/j.1524-475X.2008.00410.x. [DOI] [PubMed] [Google Scholar]
- Martinez FO, Helming L, Gordon S. Alternative activation of macrophages: an immunologic functional perspective. Annu Rev Immunol. 2009;27:451–483. doi: 10.1146/annurev.immunol.021908.132532. [DOI] [PubMed] [Google Scholar]
- Adams DO, Hamilton TA. The cell biology of macrophage activation. Annu Rev Immunol. 1984;2:283–318. doi: 10.1146/annurev.iy.02.040184.001435. [DOI] [PubMed] [Google Scholar]
- Jiang H, Kuang Y, Wu Y, Xie W, Simon MI, Wu D. Roles of phospholipase C beta2 in chemoattractant-elicited responses. Proc Natl Acad Sci USA. 1997;94:7971–7975. doi: 10.1073/pnas.94.15.7971. [DOI] [PMC free article] [PubMed] [Google Scholar]
- Kong XN, Yan HX, Chen L, Dong LW, Yang W, Liu Q, Yu LX, Huang DD, Liu SQ, Liu H, Wu MC, Wang HY. LPS-induced down-regulation of signal regulatory protein {alpha} contributes to innate immune activation in macrophages. J Exp Med. 2007;204:2719–2731. doi: 10.1084/jem.20062611. [DOI] [PMC free article] [PubMed] [Google Scholar]
- Nemeth ZH, Leibovich SJ, Deitch EA, Vizi ES, Szabo C, Hasko G. cDNA microarray analysis reveals a nuclear factor-kappaB-independent regulation of macrophage function by adenosine. J Pharmacol Exp Ther. 2003;306:1042–1049. doi: 10.1124/jpet.103.052944. [DOI] [PubMed] [Google Scholar]
- Oliveira L, Drapier JC. Down-regulation of iron regulatory protein 1 gene expression by nitric oxide. Proc Natl Acad Sci USA. 2000;97:6550–6555. doi: 10.1073/pnas.120571797. [DOI] [PMC free article] [PubMed] [Google Scholar]
- Huang H, Park CK, Ryu JY, Chang EJ, Lee Y, Kang SS, Kim HH. Expression profiling of lipopolysaccharide target genes in RAW264.7 cells by oligonucleotide microarray analyses. Arch Pharm Res. 2006;29:890–897. doi: 10.1007/BF02973911. [DOI] [PubMed] [Google Scholar]
- Chung SW, Chen YH, Yet SF, Layne MD, Perrella MA. Endotoxin-induced down-regulation of Elk-3 facilitates heme oxygenase-1 induction in macrophages. J Immunol. 2006;176:2414–2420. doi: 10.4049/jimmunol.176.4.2414. [DOI] [PubMed] [Google Scholar]
- Baranova I, Vishnyakova T, Bocharov A, Chen Z, Remaley AT, Stonik J, Eggerman TL, Patterson AP. Lipopolysaccharide down regulates both scavenger receptor B1 and ATP binding cassette transporter A1 in RAW cells. Infect Immun. 2002;70:2995–3003. doi: 10.1128/IAI.70.6.2995-3003.2002. [DOI] [PMC free article] [PubMed] [Google Scholar]
- Liu DZ, Liang HJ, Chen CH, Lin SY, Zhong WB, Ho FM, Hou WC, Lo JL, Ho YS, Lin PJ, Hung LF, Liang YC. Switch activation of PI-PLC downstream signals in activated macrophages with wortmannin. Biochim Biophys Acta. 2007;1773:869–879. doi: 10.1016/j.bbamcr.2007.03.018. [DOI] [PubMed] [Google Scholar]
- Fujihara M, Muroi M, Tanamoto K, Suzuki T, Azuma H, Ikeda H. Molecular mechanisms of macrophage activation and deactivation by lipopolysaccharide: roles of the receptor complex. Pharmacol Ther. 2003;100:171–194. doi: 10.1016/j.pharmthera.2003.08.003. [DOI] [PubMed] [Google Scholar]
- Monick MM, Carter AB, Robeff PK, Flaherty DM, Peterson MW, Hunninghake GW. Lipopolysaccharide activates Akt in human alveolar macrophages resulting in nuclear accumulation and transcriptional activity of beta-catenin. J Immunol. 2001;166:4713–4720. doi: 10.4049/jimmunol.166.7.4713. [DOI] [PubMed] [Google Scholar]
- Pittner RA, Spitzer JA. LPS inhibits PI-phospholipase C but not PC-phospholipase D or phosphorylase activation by vasopressin and norepinephrine. Am J Physiol. 1993;264:E465–E470. doi: 10.1152/ajpendo.1993.264.3.E465. [DOI] [PubMed] [Google Scholar]
- Chen CC, Wang JK, Lin SB. Antisense oligonucleotides targeting protein kinase C-alpha, -beta I, or -delta but not -eta inhibit lipopolysaccharide-induced nitric oxide synthase expression in RAW 264.7 macrophages: involvement of a nuclear factor kappa B-dependent mechanism. J Immunol. 1998;161:6206–6214. [PubMed] [Google Scholar]
- Monick MM, Carter AB, Gudmundsson G, Mallampalli R, Powers LS, Hunninghake GW. A phosphatidylcholine-specific phospholipase C regulates activation of p42/44 mitogen-activated protein kinases in lipopolysaccharide-stimulated human alveolar macrophages. J Immunol. 1999;162:3005–3012. [PubMed] [Google Scholar]
- Li Z, Jiang H, Xie W, Zhang Z, Smrcka AV, Wu D. Roles of PLC-beta2 and -beta3 and PI3Kgamma in chemoattractant-mediated signal transduction. Science. 2000;287:1046–1049. doi: 10.1126/science.287.5455.1046. [DOI] [PubMed] [Google Scholar]
- Xie W, Samoriski GM, McLaughlin JP, Romoser VA, Smrcka A, Hinkle PM, Bidlack JM, Gross RA, Jiang H, Wu D. Genetic alteration of phospholipase C beta3 expression modulates behavioral and cellular responses to mu opioids. Proc Natl Acad Sci USA. 1999;96:10385–10390. doi: 10.1073/pnas.96.18.10385. [DOI] [PMC free article] [PubMed] [Google Scholar]
- Wang Z, Liu B, Wang P, Dong X, Fernandez-Hernando C, Li Z, Hla T, Li Z, Claffey K, Smith JD, Wu D. Phospholipase C beta3 deficiency leads to macrophage hypersensitivity to apoptotic induction and reduction of atherosclerosis in mice. J Clin Invest. 2008;118:195–204. doi: 10.1172/JCI33139. [DOI] [PMC free article] [PubMed] [Google Scholar]