SYNOPSIS
Objective
Rare cancers have been traditionally understudied, reducing the progress of research and hindering decisions for patients, physicians, and policy makers. We evaluated the descriptive epidemiology of rare cancers using a large, representative, population-based dataset from cancer registries in the United States.
Methods
We analyzed more than 9 million adult cancers diagnosed from 1995 to 2004 in 39 states and two metropolitan areas using the Cancer in North America (CINA) dataset, which covers approximately 80% of the U.S. population. We applied an accepted cancer classification scheme and a published definition of rare (i.e., fewer than 15 cases per 100,000 per year). We calculated age-adjusted incidence rates and rare/non-rare incidence rate ratios using SEER*Stat software, with analyses stratified by gender, age, race/ethnicity, and histology.
Results
Sixty of 71 cancer types were rare, accounting for 25% of all adult tumors. Rare cancers occurred with greater relative frequency among those who were younger, nonwhite, and of Hispanic ethnicity than among their older, white, or non-Hispanic counterparts.
Conclusions
Collectively, rare tumors account for a sizable portion of adult cancers, and disproportionately affect some demographic groups. Maturing population-based cancer surveillance data can be an important source for research on rare cancers, potentially leading to a greater understanding of these cancers and eventually to improved treatment, control, and prevention.
Rare health conditions typically receive far less scientific attention and fiscal support than their more common counterparts. This utilitarian approach has impeded the understanding of even the basic descriptive epidemiology of rare cancers.1,2 Knowledge of rare cancers is often derived from case reports, single-institution case series, or, at best, smaller multicenter series.3–5 Conclusions drawn from such selected studies may be misleading, as they do not necessarily reflect the characteristics of the underlying population of all similar cancers.6 Many rare cancers can be highly fatal, and yet patients and caregivers have a limited evidence base to guide clinical deliberations. Enhanced research on rare cancers can facilitate improvements in diagnosis, treatment, and patient outcomes,7 and can also lead to important discoveries about underlying mechanisms of tumor development.8
In an effort to promote and synergize epidemiologic research on rare and understudied cancers, the National Cancer Institute (NCI), in collaboration with the National Institutes of Health Office of Rare Diseases, hosted a series of three leadership workshops.2,9,10 Advancing research on rare and understudied cancers within the context of consortia and transdisciplinary science was among the workshops' goals. To provide the foundation for such research, the group recognized the need for enhanced involvement of population-based cancer registries. With this in mind, our specific objectives were to (1) identify and describe the general occurrence of rare cancers in the U.S. using an accepted, conservative threshold and a well-established cancer classification system; (2) compare demographic and histologic characteristics between rare and common cancer sites; and (3) explore the occurrence of additional rare cancers typically overlooked in standard reports, including histologic types within anatomically defined rare cancers and distinct anatomic subsites that are otherwise collapsed within broader sites. This information can provide the basis for establishing collaborations, developing new initiatives, and influencing policy to prioritize funding and facilitate rare cancer research.
METHODS
For analysis, we used the Cancer in North America (CINA) Deluxe 1995–2004 research data file, based on the December 2006 data submission from members of the North American Association of Central Cancer Registries (NAACCR). NAACCR is a professional organization of state, provincial, territorial, regional, and metropolitan cancer registries in the U.S. and Canada (www.naaccr.org). Cancer registries in NAACCR are supported by multiple sources. In the U.S., they participate in NCI's Surveillance, Epidemiology, and End Results (SEER) Program or the Centers for Disease Control and Prevention's National Program of Cancer Registries. Among the objectives of NAACCR are to promote uniform data standards; evaluate data quality; certify registries; and compile, disseminate, and promote the use of population-based central cancer registry data. Each year, NAACCR compiles cancer incidence data from member registries that meet high-quality standards into the CINA analytic dataset.11
We limited analyses to U.S. registries that provided explicit permission for this project. To avoid case duplication, we excluded metropolitan-based registries if corresponding data from the entire state were available. As a result, we were able to analyze high-quality cancer incidence data from 41 population-based cancer registries (39 states, one metropolitan area, and Washington, D.C.) representing 80% of the U.S. population. For one registry, we excluded cancer counts and population denominators from one diagnosis year not meeting the highest certification standards because of unresolved data quality exceptions.
We included only invasive, microscopically confirmed cancers, with the exception of in situ urinary bladder cases, which are categorized with invasive disease. Basal cell and squamous cell cancers of the skin are not reportable and were not included in the analysis, whereas we could include basal and squamous cell histologies at all other anatomic sites. We limited cases and population denominators to adults aged 20 years and older. Anatomy and morphology of tumors were defined by the International Classification of Diseases for Oncology (ICD-O) using the standard version for the time and converted when necessary to the ICD-O Third Revision (ICD-O-3).12 Unexpected anatomic site/histologic type combinations are only included in the CINA dataset after manual review and confirmation by the submitting registry. The term “cancer” refers to any invasive malignancy, regardless of site or histologic type.
The Institutional Review Boards at NAACCR and the Marshfield Clinic Research Foundation approved this study.
Statistical analysis
We used SEER*Stat analytic software version 6.3.613 in client-server mode to generate cancer counts, proportions, and rates for cancers classified by age, gender, and race/ethnicity. We directly age-adjusted all rates to the 2000 U.S. standard population, including age group-specific rates, which were age-adjusted in five-year intervals within each age group. We also -generated incidence rate ratios (IRRs) through SEER*Stat, including 95% confidence intervals (CIs) based on the method of Fay.14
We categorized cancers into the broad systems and specific “sites” employed by the SEER Site Recode scheme, which is predominantly anatomically based, but also includes exclusive categories for several histologically defined neoplasms.15 Accordingly, most of the anatomic site-based rates exclude lymphoma, myeloma, leukemia, mesothelioma, and Kaposi sarcoma, as these are accumulated in their own histologically defined site categories regardless of anatomic location. We based primary histologic stratification on the 56 morphologic groups identified within ICD-O-3.12 We also examined 32 distinct anatomic locations that are subsumed within broader site categories and so would not typically be identified separately in standard cancer surveillance reports.
We adopted the definition of “rare” from a recent NCI-sponsored cancer epidemiology workshop: an incidence of fewer than 150 per million per year (i.e., 15 per 100,000 per year), roughly corresponding in the U.S. to 40,000 new cases per year or fewer.2,16 We also examined two lower thresholds—<10 cases and <1 case per million per year—to designate additional degrees of rareness.
RESULTS
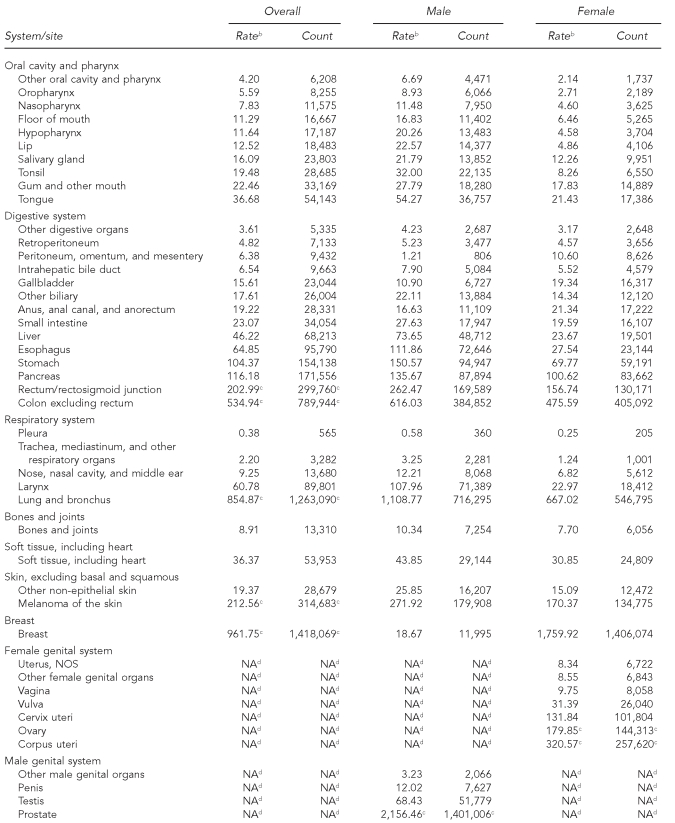
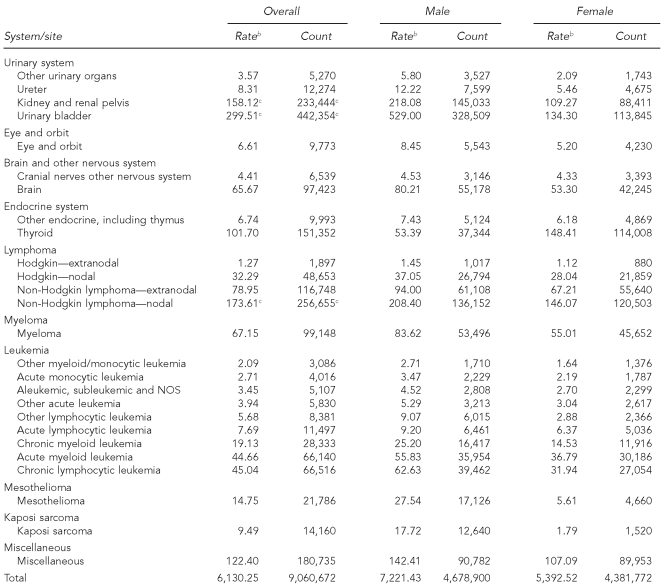
The 41 cancer registries recorded more than 9 million cases of incident, invasive adult cancers (4.7 million men and 4.4 million women) between 1995 and 2004. Based on an annual threshold of 150 cases per million, 60 of 71 cancer sites met the broad definition of rare, accounting for 25% of reported malignancies (Table 1). Only one site, pleura (non-mesothelial), had an incidence rate of fewer than one per million per year. Other cancers with incidence rates less than 10 per million per year accounted for almost half of the rare sites, ranging from 1.27 extranodal Hodgkin lymphomas per million (n=1,897) to 9.75 vaginal cancers per million women (n=8,058). Using this definition, cervix cancer was the most common of the rare sites, with a mean annual incidence of 131.8 per million women. With this definition, only 11 cancers were considered common, including cancers of the prostate, breast, lung, colon, uterine corpus, urinary bladder, rectum, ovary, kidney, melanoma of the skin, and nodal non-Hodgkin lymphoma.
Table 1.
Cancer incidence by site,a adults, 41 U.S. registries combined, 1995–2004
Source: North American Association of Central Cancer Registries file submission as of December 2006 from: Alabama, Alaska, Arizona, California, Colorado, Connecticut, Delaware, Washington, D.C., Florida, Georgia, Hawaii, Idaho, Illinois, Indiana, Iowa, Kentucky, Louisiana, Maine, Massachusetts, Detroit, Missouri, Montana, Nebraska, Nevada, New Hampshire, New Jersey, New Mexico, New York, North Dakota, Oklahoma, Oregon, Pennsylvania, Rhode Island, South Carolina, South Dakota, Texas, Utah, Washington, West Virginia, Wisconsin, and Wyoming
aClassification by SEER site recode: Ries LAG, Melbert D, Krapcho M, Mariotto A, Miller BA, Feuer EJ, et al., editors. SEER Cancer Statistics Review, 1975–2004. Bethesda (MD): National Cancer Institute; 2007. Also available from: URL: http://seer.cancer.gov/csr/1975_2004 [cited 2008 Sep 25].
bRates are invasive, microscopically confirmed cancers per 1 million per year and age-adjusted to the 2000 U.S. Standard Population (Census P25-1130).
cNon-rare cancers (incidence of at least 150 per million per year)
dGender-specific site
NOS = not otherwise specified
NA = not applicable
The rates of most rare malignancies varied by gender, some with a male-to-female IRR of ≥3:1. Cancers of the oral cavity/pharynx, respiratory, and urinary system sites were considerably less common among women than among men, while peritoneal, gallbladder, and anal cancers were more common among women. Such differences in incidence notwithstanding, the designation of rare was consistent by gender across cancer sites with few exceptions. The most striking difference was for breast cancer, which meets the definition for rare among men but not among women.
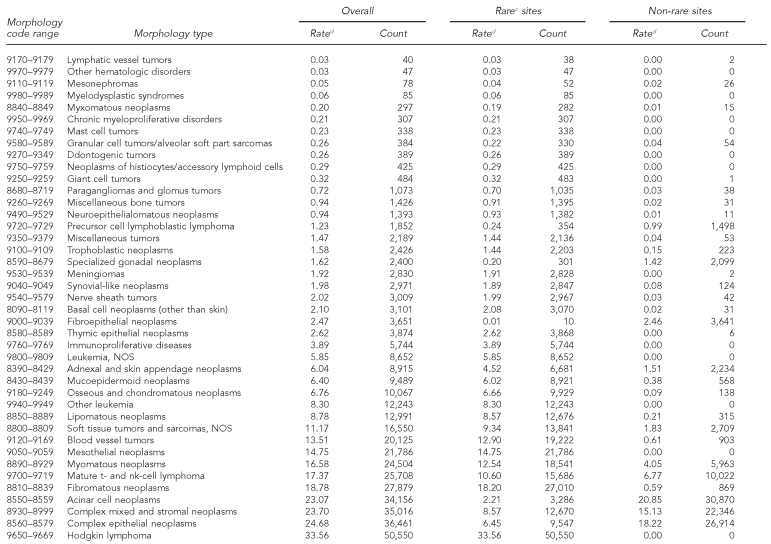
In contrast to anatomic site, 14 of the 56 histologic groups occurred with an annual frequency of less than one per million, and the annual incidence of an additional 17 histologic types was less than 10 per million (Table 2). Only eight histologic categories had rates higher than 150 per million per year, although they accounted for 90% of all cancers. Many histologic types are more likely to be found at rare cancer sites than at common cancer sites, including various types of soft tissue sarcomas and basal cell carcinoma (non-skin).
Table 2.
Cancer incidence by histologic groupinga among rare and non-rare cancer sites:b adults, 41 U.S. registries combined, 1995–2004
Source: North American Association of Central Cancer Registries file submission as of December 2006 from: Alabama, Alaska, Arizona, California, Colorado, Connecticut, Delaware, Washington, D.C., Florida, Georgia, Hawaii, Idaho, Illinois, Indiana, Iowa, Kentucky, Louisiana, Maine, Massachusetts, Detroit, Missouri, Montana, Nebraska, Nevada, New Hampshire, New Jersey, New Mexico, New York, North Dakota, Oklahoma, Oregon, Pennsylvania, Rhode Island, South Carolina, South Dakota, Texas, Utah, Washington, West Virginia, Wisconsin, and Wyoming
aHistology classification using groupings shown in: Fritz A, Percy C, Jack A, Shanmugaratnam K, Sobin L, Parkin DM, et al., editors. International classification of diseases for oncology. 3rd ed. Geneva: World Health Organization; 2000.
bClassification by SEER site recode: Ries LAG, Melbert D, Krapcho M, Mariotto A, Miller BA, Feuer EJ, et al., editors. SEER Cancer Statistics Review, 1975–2004. Bethesda (MD): National Cancer Institute; 2007. Also available from: URL: http://seer.cancer.gov/csr/1975_2004 [cited 2008 Sep 25].
cCancers occurring at rare sites with an incidence rate of <150 per million per year
dRates are invasive, microscopically confirmed cancers per million per year and age-adjusted to the 2000 U.S. Standard Population (Census P25-1130).
NOS = not otherwise specified
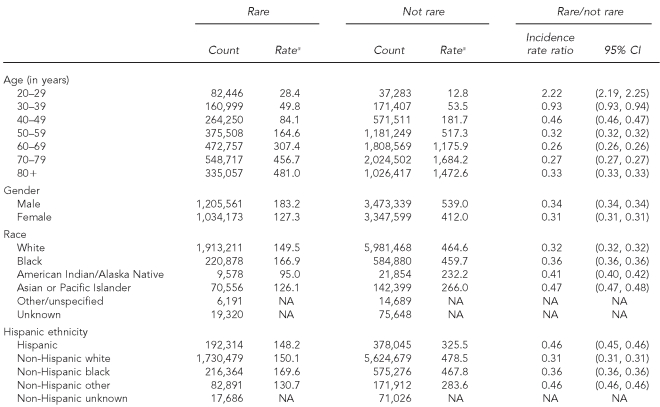
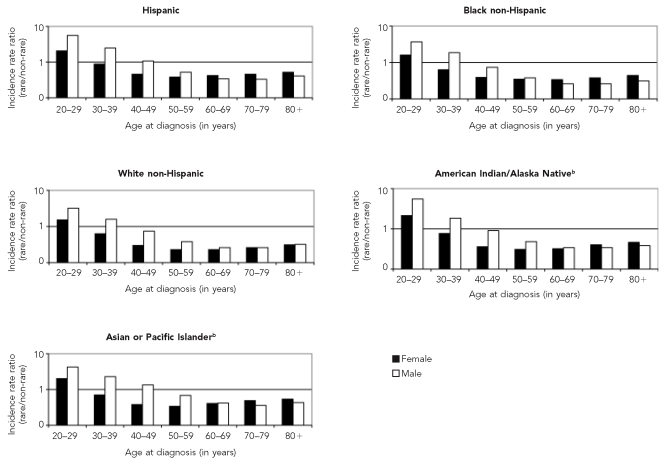
The overall rare to non-rare IRR was 0.33 (Table 3). Rare cancers were proportionally (and absolutely) more common than non-rare cancers among young adults aged 20–29 years. The IRRs of rare relative to common cancers then decreased monotonically through adulthood until age 60 years, when the trend flattened and reversed, especially among women (Figure). Overall, men were more likely than women to have had a rare cancer diagnosis until age 70, after which the rare/non-rare ratios were fairly similar. Black, American Indian/Alaska Native, Asian/Pacific Islander, and Hispanic people with cancer were proportionally more likely to have been diagnosed with a rare cancer as defined in this study than were their white counterparts. This general relation held true for both genders and nearly all ages, except that black and white males older than 40 years of age had very similar rare/non-rare IRRs.
Table 3.
Summary characteristics of rare and non-rare incident cancer sites: adults, 41 U.S. registries combined, 1995–2004
Source: North American Association of Central Cancer Registries file submission as of December 2006 from: Alabama, Alaska, Arizona, California, Colorado, Connecticut, Delaware, Washington, D.C., Florida, Georgia, Hawaii, Idaho, Illinois, Indiana, Iowa, Kentucky, Louisiana, Maine, Massachusetts, Detroit, Missouri, Montana, Nebraska, Nevada, New Hampshire, New Jersey, New Mexico, New York, North Dakota, Oklahoma, Oregon, Pennsylvania, Rhode Island, South Carolina, South Dakota, Texas, Utah, Washington, West Virginia, Wisconsin, and Wyoming
aRates are invasive, microscopically confirmed cancers per 100,000 per year and age-adjusted to the 2000 U.S. Standard Population (Census P25-1130)
CI = confidence interval
NA = not available
Figure.
Incidence rate ratios (rarea/non-rare) by age at diagnosis, gender, and race/ethnicity, 41 U.S. registries combined, 1995–2004
Source: North American Association of Central Cancer Registries, Inc. file submission as of December 2006 from: Alabama, Alaska, Arizona, California, Colorado, Connecticut, Delaware, Washington, D.C., Florida, Georgia, Hawaii, Idaho, Illinois, Indiana, Iowa, Kentucky, Louisiana, Maine, Massachusetts, Detroit, Missouri, Montana, Nebraska, Nevada, New Hampshire, New Jersey, New Mexico, New York, North Dakota, Oklahoma, Oregon, Pennsylvania, Rhode Island, South Carolina, South Dakota, Texas, Utah, Washington, West Virginia, Wisconsin, and Wyoming
aCancer site with incidence <150 per million per year
bIncludes both Hispanic and non-Hispanic ethnicity
Examining race-specific incidence rates by cancer site provides detail into this general finding. For example, while the black/white IRR for all cancer sites combined was 1.02 (95% CI 1.018, 1.023), black people were less likely than white people to be diagnosed with eight of the 11 non-rare cancers: rectum/rectosigmoid junction (black/white IRR=0.91, 95% CI 0.89, 0.92), melanoma of the skin (IRR=0.06, 95% CI 0.05, 0.06), female breast (IRR=0.85, 95% CI 0.85, 0.86), corpus uteri (IRR=0.77, 95% CI 0.76, 0.78), ovary (IRR=0.66, 95% CI 0.64, 0.67), urinary bladder (IRR=0.49, 95% CI 0.48, 0.50), kidney/renal pelvis (IRR=0.96, 95% CI 0.95, 0.97), and nodal non-Hodgkin lymphoma (IRR=0.66, 95% CI 0.65, 0.67). On the other hand, black people were at least 50% more likely than their white counterparts to be diagnosed with cancer at many of the designated rare sites, especially along the aerodigestive tract: nasopharynx (black/white IRR=1.65, 95% CI 1.56, 1.75), oropharynx (IRR=1.85, 95% CI 1.74, 1.96), hypopharynx (IRR=1.80, 95% CI 1.73, 1.88), esophagus (IRR=1.57, 95% CI 1.54, 1.60), stomach (IRR=1.83, 95% CI 1.81, 1.86), small intestine (IRR=1.61, 95% CI 1.56, 1.66), liver (IRR=1.56, 95% CI 1.52, 1.60), larynx (IRR=1.50, 95% CI 1.47, 1.53), cervix (IRR=1.53, 95% CI 1.50, 1.56), vagina (IRR=1.67, 95% CI 1.57, 1.78), myeloma (IRR=2.12, 95% CI 2.08, 2.16), and Kaposi sarcoma (IRR=2.35, 95% CI 2.26, 2.45).
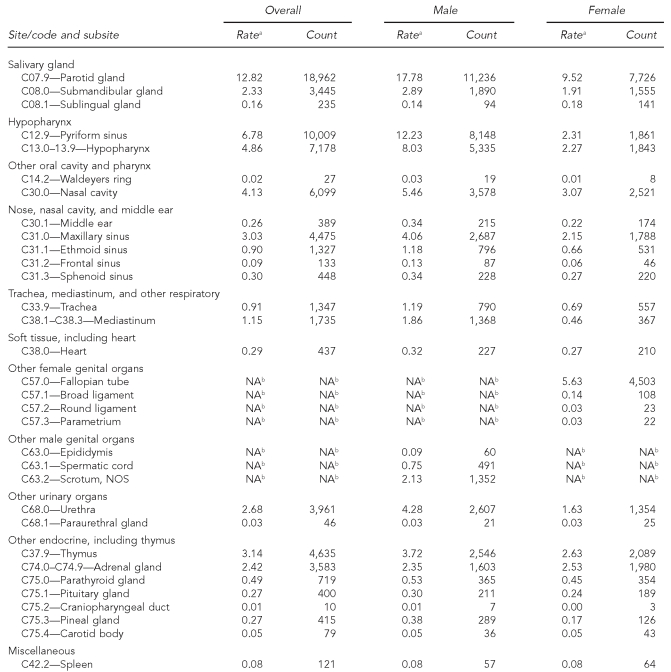
Incidence rates for distinct anatomic locations that are subsumed within broader rare cancer sites as defined by the standard SEER Site Recode scheme are shown for illustrative purposes in Table 4. All but one (parotid gland) have reported incidence rates below 10 per million per year, and most have a frequency of less than one case per million per year. Among the subsites that are not single-gender cancers, many demonstrate a higher incidence rate among men.
Table 4.
Cancer incidence for subsites collapsed within rare sites: adults, 41 U.S. registries combined, 1995–2004
Source: North American Association of Central Cancer Registries file submission as of December 2006 from: Alabama, Alaska, Arizona, California, Colorado, Connecticut, Delaware, Washington, D.C., Florida, Georgia, Hawaii, Idaho, Illinois, Indiana, Iowa, Kentucky, Louisiana, Maine, Massachusetts, Detroit, Missouri, Montana, Nebraska, Nevada, New Hampshire, New Jersey, New Mexico, New York, North Dakota, Oklahoma, Oregon, Pennsylvania, Rhode Island, South Carolina, South Dakota, Texas, Utah, Washington, West Virginia, Wisconsin, and Wyoming
aRates are invasive, microscopically confirmed cancers per million per year and age-adjusted to the 2000 U.S. Standard Population (Census P25-1130), and exclude lymphomas, myeloma, leukemia, mesothelioma, and Kaposi's sarcoma.
bGender-specific site
NA = not applicable
NOS = not otherwise specified
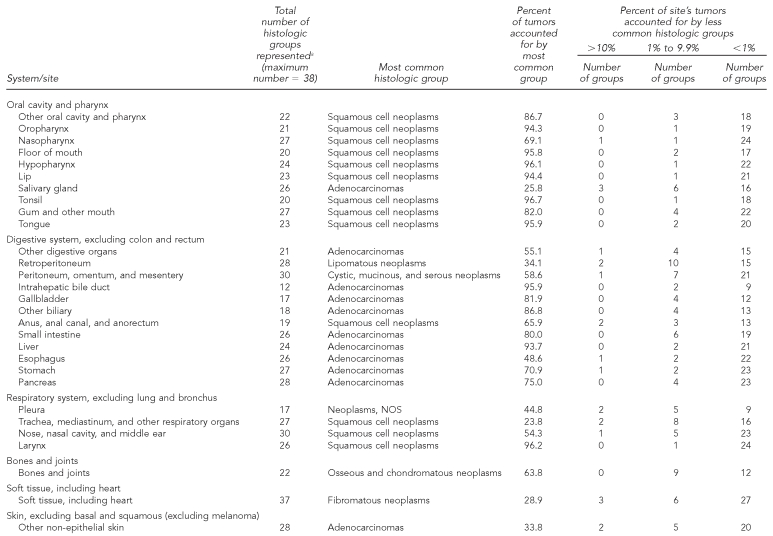
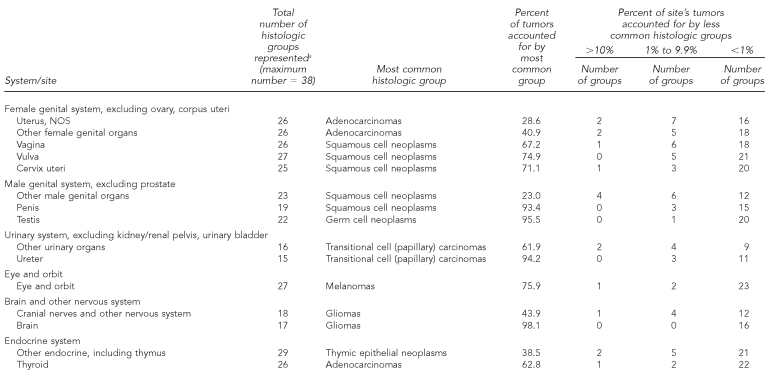
Each anatomically based rare cancer site comprised many histologic subtypes (range per site: 12–43 histologic groups, median = 25) (Table 5a). For most rare cancers, the most frequent histologic type generally accounted for a high proportion of the diagnoses, with other types usually representing less than 1% of the total. In contrast, histologic variability exists for some rare cancer sites (e.g., cancers of the salivary glands and retroperitoneum). Histologic variability was also more likely at cancer sites that are defined broadly, such as “other digestive organs” or “other urinary organs.”
Table 5a.
Occurrence and distribution of histologic groupsa within rare cancerb sites: adults, 41 U.S. registries combined, 1995–2004
Source: North American Association of Central Cancer Registries file submission as of December 2006 from: Alabama, Alaska, Arizona, California, Colorado, Connecticut, Delaware, Washington, D.C., Florida, Georgia, Hawaii, Idaho, Illinois, Indiana, Iowa, Kentucky, Louisiana, Maine, Massachusetts, Detroit, Missouri, Montana, Nebraska, Nevada, New Hampshire, New Jersey, New Mexico, New York, North Dakota, Oklahoma, Oregon, Pennsylvania, Rhode Island, South Carolina, South Dakota, Texas, Utah, Washington, West Virginia, Wisconsin, and Wyoming
aHistology classification using groupings shown in: Fritz A, Percy C, Jack A, Shanmugaratnam K, Sobin L, Parkin DM, et al., editors. International classification of diseases for oncology. 3rd ed. Geneva: World Health Organization; 2000. Classification excludes lymphomas, myeloma, leukemia, mesothelioma, and Kaposi sarcoma.
bRare cancers (rate <15 per 100,000 per year) as classified by SEER Site Recode: Ries LAG, Melbert D, Krapcho M, Mariotto A, Miller BA, Feuer EJ, et al., editors. SEER Cancer Statistics Review, 1975–2004. Bethesda (MD): National Cancer Institute; 2007. Also available from: URL: http://seer.cancer.gov/csr/1975_2004 [cited 2008 Sep 25].
NOS = not otherwise specified
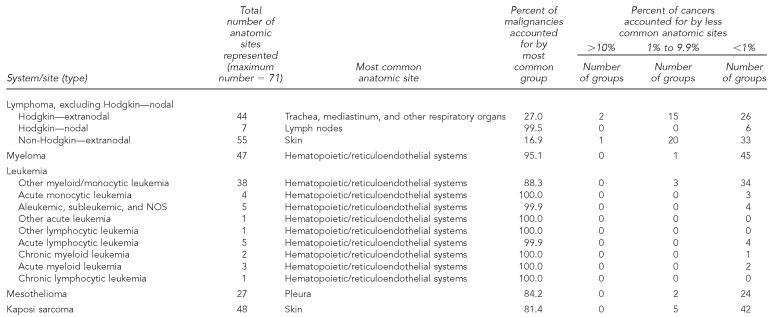
By contrast, several of the rare cancers defined histologically were prominent in multiple anatomic locations (Table 5b). For example, only 17% of extranodal non-Hodgkin lymphomas were diagnosed in the most common anatomic location—the skin—whereas 21 other anatomic sites each accounted for at least 1% of all extranodal non-Hodgkin lymphomas.
Table 5b.
Occurrence and distribution of anatomic sites within histologically based rare cancers:b adults, selected areas of the U.S., 1995–2004
Source: North American Association of Central Cancer Registries file submission as of December 2006 from: Alabama, Alaska, Arizona, California, Colorado, Connecticut, Delaware, Washington, D.C., Florida, Georgia, Hawaii, Idaho, Illinois, Indiana, Iowa, Kentucky, Louisiana, Maine, Massachusetts, Detroit, Missouri, Montana, Nebraska, Nevada, New Hampshire, New Jersey, New Mexico, New York, North Dakota, Oklahoma, Oregon, Pennsylvania, Rhode Island, South Carolina, South Dakota, Texas, Utah, Washington, West Virginia, Wisconsin, and Wyoming
bRare cancers (rate <15 per 100,000 per year) as classified by SEER Site Recode: Ries LAG, Melbert D, Krapcho M, Mariotto A, Miller BA, Feuer EJ, et al., editors. SEER Cancer Statistics Review, 1975–2004. Bethesda (MD): National Cancer Institute; 2007. Also available from: URL: http://seer.cancer.gov/csr/1975_2004 [cited 2008 Sep 25].
NOS = not otherwise specified
DISCUSSION
The historical focus of funded research, and corresponding attention in the medical literature, has been on the most common cancers.10 The resources to identify and describe rare cancer occurrence; understand their causes; and determine the best approaches for prevention, detection, and treatment have been suboptimal, leaving patients, clinicians, and policy makers with limited information. Unfortunately, the deficit of attention has been even more considerable for very rare cancers.17 Standard cancer surveillance summaries15,18,19 also typically highlight more common cancers, often combining tumors from less frequent anatomic locations and overlooking many neoplasms defined histologically. In response to the recent interest in coordinating and enhancing epidemiologic research on rare cancers, the data presented in this article quantify the occurrence of rare cancers in the U.S. and describe their demographic, anatomic, and histologic features.
Based on the employed definition for “rare” of fewer than 150 incident cases per one million per year, only 11 cancer types are common in U.S. adults (prostate, breast, lung/bronchus, colon, uterus, bladder, melanoma, rectum, ovary, non-Hodgkin lymphoma, and kidney/renal pelvis neoplasms). Fully one-quarter of all adults with cancer were found to have a rare diagnosis.
For younger people, people of nonwhite race, and people of Hispanic ethnicity, the distribution of diagnosed cancers reflects a disproportionate occurrence at rare sites compared with their older, white, or non-Hispanic counterparts. The association with young adults is compatible with the recognition that rare cancers often have a larger genetic component to their etiology than more common cancers.16,20 The greater likelihood of rare, understudied tumors occurring among nonwhite racial/ethnic groups creates added challenges to achieving our national goals for reducing health disparities in general,21 and disparities in cancer mortality specifically.22 This broad dichotomy of “rare” and “common” does mask site-specific heterogeneity in biology and epidemiology, and is partially an artifact of the cancer site distribution among older, white, and non-Hispanic people, in whom the majority of cancers occur. Nevertheless, the fact that cancer site distributions among younger, Hispanic, and nonwhite people are different and tend toward the less common, less studied cancer sites is a practical concern, regardless of the underlying reason.
Encouragingly, interest in rare cancers among scientists, funding agencies, and policy makers has grown in recent years. The U.S. Rare Diseases Act of 2002 focused attention on the benefits of education and research regarding rare conditions.1 NCI and Office of Rare Diseases workshops on the epidemiology of rare and understudied cancers have brought together topical and methodologic experts to extend the dissemination of current knowledge, promote collaboration, and discuss research gaps along with novel approaches to enhancing rare cancer research capacity in the U.S.2,9,10,16 Internationally, progress is evidenced by collaborative groups, such as the InterLymph Consortium23 and Europe's Rare Cancer Network,24 and scientific articles encouraging the use of population-based data to support rare cancer research.25,26
Well-established population-based resources, such as NCI's SEER program, have been supporting a growing number of rare cancer analyses7,27–29 and new research efforts.30 While an assessment of all CINA-based site-specific publications to date indicates a predominant focus on six common cancer sites,31 recent studies of rare malignancies within the CINA dataset include analyses of biliary tumors, penile cancers, and leukemia subtypes.32–34 Other CINA studies have included investigations into rare aspects of common cancer sites, such as primary extraovarian tumors,35 inflammatory breast cancer,36 non-carcinoma breast cancers,37 and non-cutaneous melanomas.38
Future epidemiologic research with this national dataset can retain substantial case numbers while enhancing disease homogeneity through subsite or histologic stratification.39 For example, although squamous cell carcinoma is the most common histology in the cervix, adenocarcinomas accounted for 17% of cervical tumors and more than 17,000 cases. This distinction can be important for monitoring the potential impact of the recently introduced prophylactic vaccine against oncogenic human papillomavirus types 16 and 18, as these two viruses are more predominant in cervical adenocarcinomas.40
For very rare cancers, proponents are calling for the publication of case series, and even single case reports to combat the lack of information.8,17 Such cancers can be challenging to diagnose, have limited treatment options, and can be rapidly fatal.10,17 Rates lower than one per million per year nevertheless result in hundreds of cases in the CINA file potentially available for further research. For example, while sarcomas comprise less than 1% of laryngeal tumors, published findings from a recent case series of 10 laryngeal sarcoma patients41 could be augmented by investigation of the 352 cases of laryngeal sarcoma contained thus far in the CINA database. Furthermore, over time the numbers of rare cancers in the database will continue to increase.
The CINA analytic file is available to NAACCR members for research following approval of research proposals by NAACCR. Variables in the analytic file include reporting registry; year of diagnosis; type of reporting source; case demographics, such as age, gender, race, and Hispanic ethnicity; tumor characteristics, including site, morphology, behavior, stage and other extent of disease information, grade, diagnostic confirmation, laterality, and sequence number; and links to area-level census attributes and geocoded great-circle distances from care facilities. Select treatment data are also included. Survival data are not yet available in the dataset, but may be in the future as more registries institute systematic case follow-up procedures. With appropriate permissions, CINA data can also support data collection from patients or medical records, and rapid case ascertainment procedures are being piloted in some registries to facilitate such work.
Limitations
This study had several limitations. Analysis was restricted to adults aged 20 years and older. Thus, this article does not provide a complete picture for some cancers prevalent in both children and young adults, such as germ cell tumors or osteosarcomas. Rare cancers among younger age groups will be the subject of a separate analysis. This analysis overlooked some cancers that can be considered rare from other perspectives, including cancers rare in one gender (e.g., male breast cancer),42 rare cancer subsites within common sites (e.g., appendiceal tumors),43 and less common histologies of common cancer sites (e.g., rectal carcinoids).44
The study employed a fairly high threshold for rareness, and it is recognized that research approaches will necessarily differ for very rare cancers with only dozens or hundreds of new cases per year compared with rare cancers with tens of thousands of new cases per year. The designation of rare in this study was also dependent on the narrowness or broadness of the chosen site and histologic definitions. Optimal categorization for each cancer could be addressed during further topic-specific inquiry, such as the recent work developing lymphoma classifications for epidemiologic research by the InterLymph Consortium45 or a CINA-based investigation into ovarian tumors.46 Finally, myeloproliferative disorders have only been reportable to cancer registries since 2001, leading to an artificially low case count relative to other cancer types.
CONCLUSIONS
The epidemiology of rare cancers is a challenging area of study, and tumors that are uncommon in the population are also somewhat scarcely documented in the medical and public health literature. The maturing of a nationally representative dataset provides new opportunities to explore the occurrence and characteristics of rare and very rare cancers that have historically been understudied. The use of surveillance data for case ascertainment with possible linkages back to additional data sources could provide opportunities to explore disease etiology, and could potentially lead to advances in treatment and prognosis. We hope that our descriptive analysis encourages such uses of this robust national cancer data resource.
Acknowledgments
The authors thank the staffs of the NAACCR and Information Management Services, Inc. for their work in generating Cancer in North America analytic files.
Footnotes
This work was supported in part by the North American Association of Central Cancer Registries, Inc. (NAACCR) (2004-07-03 to Robert Greenlee, subcontract of the National Cancer Institute [NCI] N02-PC-35013-18); and the NCI's Surveillance, Epidemiology, and End Results Program (N01-CN-67001 to Mark Goodman, N01-PC-35143 to Charles Lynch).
The contents of this article are solely the responsibility of the authors and do not necessarily represent the official views of NCI.
REFERENCES
- 1.Rare Diseases Act of 2002. Public law 107-280. [cited 2008 Sep 25]. Available from: URL: http://frwebgate.access.gpo.gov/cgi-bin/getdoc.cgi?dbname=107_cong_public_laws&docid=f:publ280.107.
- 2.National Cancer Institute Epidemiology and Genetics Research. Synergizing epidemiologic research on rare cancers, 2007. [cited 2008 Sep 25]. Available from: URL: http://epi.grants.cancer.gov/Synergizing/index.html.
- 3.Walvekar RR, Kane SV, D'Cruz AK. Collision tumor of the thyroid: follicular variant of papillary carcinoma and squamous carcinoma. World J Surg Oncol. 2006;4:65. doi: 10.1186/1477-7819-4-65. [DOI] [PMC free article] [PubMed] [Google Scholar]
- 4.Fou A, Schabel FR, Hamele-Bena D, Wei XJ, Cheng B, El Tamer M, et al. Long-term outcomes of malignant phyllodes tumors patients: an institutional experience. Am J Surg. 2006;192:492–5. doi: 10.1016/j.amjsurg.2006.06.017. [DOI] [PubMed] [Google Scholar]
- 5.Oliveira DT, de Moraes RV, Filho J, Neto J, Landman G, Kowalski LP. Oral verrucous carcinoma: a retrospective study in Sao Paulo region, Brazil. Clin Oral Investig. 2006;10:205–9. doi: 10.1007/s00784-006-0050-7. [DOI] [PubMed] [Google Scholar]
- 6.Hassan R, Alexander R, Antman K, Boffetta P, Churg A, Coit D, et al. Current treatment options and biology of peritoneal mesothelioma: meeting summary of the first NIH peritoneal mesothelioma conference. Ann Oncol. 2006;17:1615–9. doi: 10.1093/annonc/mdl060. [DOI] [PubMed] [Google Scholar]
- 7.Podnos YD, Tsai NC, Smith D, Ellenhorn JD. Factors affecting survival in patients with anal melanoma. Am Surg. 2006;72:917–20. [PubMed] [Google Scholar]
- 8.Joannides T. Rare cancers. Clin Oncol (R Coll Radiol) 2001;13:235. [PubMed] [Google Scholar]
- 9.National Cancer Institute. First NCI Epidemiology Leadership Workshop: tobacco, diet, and genes; 2004 Sep 19–21. Chicago: [cited 2008 Sep 25]. Available from: URL: http://epi.grants.cancer.gov/Conference. [Google Scholar]
- 10.National Cancer Institute. 2nd NCI Epidemiology Leadership Workshop: understudied rare cancers; 2005 Sep 11–13. Boston: [cited 2008 Sep 25]. Available from: URL: http://epi.grants.cancer.gov/documents/Conference2/MeetingSummary.pdf. [Google Scholar]
- 11.Tucker TC, Howe HL. Measuring the quality of population-based cancer registries: the NAACCR perspective. J Reg Manag. 2001;28:41–4. [Google Scholar]
- 12.Fritz A, Percy C, Jack A, Shanmugaratnam K, Sobin LH, Parkin MD, editors. International classification of diseases for oncology. 3rd ed. Geneva: World Health Organization; 2000. [Google Scholar]
- 13.Surveillance Research Program, National Cancer Institute. SEER*Stat software: Version 6.3.6. Bethesda (MD): Surveillance Research Program, National Cancer Institute; 2007. [Google Scholar]
- 14.Fay MP. Approximate confidence intervals for rate ratios from directly standardized rates with sparse data. Communications in Statistics: Theory and Methods. 1999;28:2141–60. [Google Scholar]
- 15.Ries LAG, Melbert D, Krapcho M, Mariotto A, Miller BA, Feuer EJ, et al., editors. SEER cancer statistics review, 1975–2004. Bethesda (MD): National Cancer Institute; 2007. [cited 2008 Sep 25]. Also available from: URL: http://seer.cancer.gov/csr/1975_2004. [Google Scholar]
- 16.Department of Health and Human Services (US), Office of Rare Diseases, National Institutes of Health. Annual report on the rare diseases research activities at the National Institutes of Health, FY 2005. 2006. [cited 2008 Sep 25]. Available from: URL: http://rarediseases.info.nih.gov/asp/html/reports/fy2005/Annual_Report_FY_05_Final.pdf.
- 17.Very rare cancers—a problem neglected. Lancet Oncol. 2001;2:189. doi: 10.1016/s1470-2045(00)00273-4. [DOI] [PubMed] [Google Scholar]
- 18.US Cancer Statistics Working Group. United States cancer statistics: 1999–2004 incidence and mortality Web-based report. Atlanta: Department of Health and Human Services, Centers for Disease Control and Prevention (US), National Cancer Institute; 2007. [cited 2007 Dec 21]. Also available from: URL: www.cdc.gov/uscs. [Google Scholar]
- 19.Zeig-Owens R, Knowlton R, Gershman ST, Howe HL. CINA highlights of cancer incidence and mortality in the United States and Canada, 2000–2004. Springfield (IL): North American Association of Central Cancer Registries, Inc.; [October 2007]. [Google Scholar]
- 20.Bleyer A, Barr R, Hayes-Lattin B, Thomas D, Ellis C, Anderson B. The distinctive biology of cancer in adolescents and young adults. Nat Rev Cancer. 2008;8:288–98. doi: 10.1038/nrc2349. [DOI] [PubMed] [Google Scholar]
- 21.Keppel KG. Ten largest racial and ethnic health disparities in the United States based on Healthy People 2010 objectives. Am J Epidemiol. 2007;166:97–103. doi: 10.1093/aje/kwm044. [DOI] [PubMed] [Google Scholar]
- 22.Chu KC, Miller BA, Springfield SA. Measures of racial/ethnic health disparities in cancer mortality rates and the influence of socioeconomic status. J Natl Med Assoc. 2007;99(1092-100):1102–4. [PMC free article] [PubMed] [Google Scholar]
- 23.Kricker A, Armstrong BK, Hughes AM, Goumas C, Smedby KE, Zheng T, et al. Personal sun exposure and risk of non-Hodgkin lymphoma: a pooled analysis from the Interlymph Consortium. Int J Cancer. 2008;122:144–54. doi: 10.1002/ijc.23003. [DOI] [PubMed] [Google Scholar]
- 24.Weber DC, Miller RC, Villa S, Hanssens P, Baumert BG, Castadot P, et al. Outcome and prognostic factors in cerebellar glioblastoma multiforme in adults: a retrospective study from the Rare Cancer Network. Int J Radiat Oncol Biol Phys. 2006;66:179–86. doi: 10.1016/j.ijrobp.2006.04.035. [DOI] [PubMed] [Google Scholar]
- 25.Zurriaga Llorens O, Martinez Garcia C, Arizo Luque V, Sanchez Perez MJ, Ramos Aceitero JM, Garcia Blasco MJ, et al. Disease registries in the epidemiological researching of rare diseases in Spain. Rev Esp Salud Publica. 2006;80:249–57. doi: 10.1590/s1135-57272006000300005. [DOI] [PubMed] [Google Scholar]
- 26.Schon D, Bertz J, Gorsch B, Haberland J, Kurth BM. Federal Cancer Reporting Unit. Surveillance program for cancer registration in Germany. Bundesgesundheitsblatt Gesundheitsforschung Gesundheitsschutz. 2004;47:429–36. doi: 10.1007/s00103-004-0830-7. [DOI] [PubMed] [Google Scholar]
- 27.Roman S, Lin R, Sosa JA. Prognosis of medullary thyroid carcinoma: demographic, clinical, and pathological predictors of survival in 1,252 cases. Cancer. 2006;107:2134–42. doi: 10.1002/cncr.22244. [DOI] [PubMed] [Google Scholar]
- 28.Kebebew E, Reiff E, Duh QY, Clark OH, McMillan A. Extent of disease at presentation and outcome for adrenocortical carcinoma: have we made progress? World J Surg. 2006;30:872–8. doi: 10.1007/s00268-005-0329-x. [DOI] [PubMed] [Google Scholar]
- 29.Porter GA, Baxter NN, Pisters PW. Retroperitoneal sarcoma: a population-based analysis of epidemiology, surgery, and radiotherapy. Cancer. 2006;106:1610–6. doi: 10.1002/cncr.21761. [DOI] [PubMed] [Google Scholar]
- 30.Improvements needed for adolescents and young adults. [cited 2008 Sep 25];NCI Cancer Bulletin. 2008 5:10. Also available from: URL: http://www.cancer.gov/ncicancerbulletin/NCI_Cancer_Bulletin_031808/page10. [Google Scholar]
- 31.Howe HL, Hinds RA, editors. NAACCR annotated bibliography of research and publications: multi-registry cancer incidence and mortality studies in the United States and Canada, April 2008. Springfield (IL): North American Association of Central Cancer Registries, Inc.; 2007. [Google Scholar]
- 32.Goodman MT, Yamamoto J. Descriptive study of gallbladder, extrahepatic bile duct, and ampullary cancers in the United States, 1997–2002. Cancer Causes Control. 2007;18:415–22. doi: 10.1007/s10552-006-0109-4. [DOI] [PubMed] [Google Scholar]
- 33.Goodman MT, Hernandez BY, Shvetsov YB. Demographic and pathologic differences in the incidence of invasive penile cancer in the United States, 1995–2003. Cancer Epidemiol Biomarkers Prev. 2007;16:1833–9. doi: 10.1158/1055-9965.EPI-07-0221. [DOI] [PubMed] [Google Scholar]
- 34.Yamamoto JF, Goodman MT. Patterns of leukemia incidence in the United States by subtype and demographic characteristics, 1997–2002. Cancer Causes Control. 2008;19:379–90. doi: 10.1007/s10552-007-9097-2. [DOI] [PubMed] [Google Scholar]
- 35.Roffers SD, Wu XC, Johnson CH, Correa CN. Incidence of extra-ovarian primary cancers in the United States, 1992–1997. Cancer. 2003;97(10) Suppl:S2643–7. doi: 10.1002/cncr.11346. [DOI] [PubMed] [Google Scholar]
- 36.Wingo PA, Jamison PM, Young JL, Gargiullo P. Population-based statistics for women diagnosed with inflammatory breast cancer. Cancer Causes Control. 2004;15:321–8. doi: 10.1023/B:CACO.0000024222.61114.18. [DOI] [PubMed] [Google Scholar]
- 37.Young JL, Jr, Ward KC, Wingo PA, Howe HL. The incidence of malignant non-carcinomas of the female breast. Cancer Causes Control. 2004;15:313–9. doi: 10.1023/B:CACO.0000024224.70386.d1. [DOI] [PubMed] [Google Scholar]
- 38.McLaughlin CC, Wu XC, Jemal A, Martin HJ, Roche LM, Chen VW. Incidence of noncutaneous melanomas in the US Cancer. 2005;103:1000–7. doi: 10.1002/cncr.20866. [DOI] [PubMed] [Google Scholar]
- 39.Thomas RM, Sobin LH. Gastrointestinal cancer. Cancer. 1995;75(1) Suppl:S154–70. doi: 10.1002/1097-0142(19950101)75:1+<154::aid-cncr2820751305>3.0.co;2-z. [DOI] [PubMed] [Google Scholar]
- 40.Clifford GM, Smith JS, Plummer M, Munoz N, Franceschi S. Human papillomavirus types in invasive cervical cancer worldwide: a meta-analysis. Br J Cancer. 2003;88:63–73. doi: 10.1038/sj.bjc.6600688. [DOI] [PMC free article] [PubMed] [Google Scholar]
- 41.Liu CY, Wang MC, Li WY, Chang SY, Chu PY. Sarcoma of the larynx: treatment results and literature review. J Chin Med Assoc. 2006;69:120–4. doi: 10.1016/S1726-4901(09)70189-3. [DOI] [PubMed] [Google Scholar]
- 42.Goodman MT, Tung KH, Wilkens LR. Comparative epidemiology of breast cancer among men and women in the US, 1996 to 2000. Cancer Causes Control. 2006;17:127–36. doi: 10.1007/s10552-005-5384-y. [DOI] [PubMed] [Google Scholar]
- 43.McCusker ME, Cote TR, Clegg LX, Sobin LH. Primary malignant neoplasms of the appendix: a population-based study from the Surveillance, Epidemiology, and End-Results program, 1973–1998. Cancer. 2002;94:3307–12. doi: 10.1002/cncr.10589. [DOI] [PubMed] [Google Scholar]
- 44.Modlin IM, Lye KD, Kidd M. A 5-decade analysis of 13,715 carcinoid tumors. Cancer. 2003;97:934–59. doi: 10.1002/cncr.11105. [DOI] [PubMed] [Google Scholar]
- 45.Morton LM, Turner JJ, Cerhan JR, Linet MS, Treseler PA, Clarke CA, et al. Proposed classification of lymphoid neoplasms for epidemiologic research from the Pathology Working Group of the International Lymphoma Epidemiology Consortium (InterLymph) Blood. 2007;110:695–708. doi: 10.1182/blood-2006-11-051672. [DOI] [PMC free article] [PubMed] [Google Scholar]
- 46.Chen VW, Ruiz B, Kileen JL, Cote TR, Wu XC, Correa CN. Pathology and classification of ovarian tumors. Cancer. 2003;97(10) Suppl:S2631–42. doi: 10.1002/cncr.11345. [DOI] [PubMed] [Google Scholar]


