

Abstract
The value of analyzing neuroimaging data on a group level has been well established in human studies. However, there is no standard procedure for registering and analyzing fMRI data into common space in rodent functional magnetic resonance imaging (fMRI) studies. An approach for performing rat imaging data analysis in the stereotaxic framework is presented. This method is rooted in the biological observation that the skull shape and size of rat brain are essentially the same as long as their weights are within certain range. Registration is performed using rigid-body transformations without scaling or shearing, preserving the unique properties of the stable shape and size inherent in rat brain structure. Also, it does not require brain tissue masking, and is not biased towards surface coil sensitivity profile. A standard rat brain atlas is used to facilitate the identification of activated areas in common space, allowing accurate region-of-interest (ROI) analysis. This technique is evaluated from a group of rats (n = 11) undergoing routine MRI scans; the registration accuracy is estimated to be within 400 μm. The analysis of fMRI data acquired with an electrical forepaw stimulation model demonstrates the utility of this technique. The method is implemented within the AFNI framework and can be readily extended to other studies.
Keywords: fMRI, CBV-weighted fMRI, rat brain atlas, neuroimaging, forepaw stimulation
Introduction
The value of group statistical analysis of neuroimaging data has been well established. In human functional magnetic resonance imaging (fMRI) studies, this often involves normalizing data from individual subjects to a common three dimensional (3D) space (typically the Talairach coordinates or the Montreal Neurological Institute (MNI) space), and conducting statistical analysis between test and control conditions. Transforming individual datasets into a common space offers several advantages, including accounting for inter-subject anatomical differences and allowing sites of activation to be reported within the same atlas system. Group comparison can also enhance statistical power to detect low amplitude responses. Nevertheless, most animal MRI data analyses have been performed on individual subjects, and statistical results are derived from region-of-interest (ROI) analyses combined across subjects. The delineation of these ROIs is often based upon known neuroanatomy, but is also somewhat arbitrary in practice. Large errors could occur since slice selection is often difficult to control between animals, causing a variable degree of partial volume effect across animals. Nevertheless, such ROI analysis is best applied in studies employing animal models with well-known neuronal projection pathways, such as rat electrical forepaw stimulation (e.g. 1, 2) and whisker stimulation (3). But for studies involving unknown neuronal substrates, such as fMRI studies following pharmacological manipulations, where many disparate cortical and subcortical structures are involved, both the localization and the choice of the ROIs can be subjective since the delineation of ROIs is operator-dependent.
Rodents have been commonly used in preclinical and translational biomedical research. There are at least two technical issues specific to MRI in rats that hamper the straightforward application of human image registration procedures to animal studies. First, a surface coil is often used for signal reception to enhance the sensitivity in animal MRI, rather than the more common birdcage coil used in humans. The sensitivity profile of the surface coil produces a signal intensity gradient on MR images. In principle, the sensitivity profile can be removed from these images (4). But this procedure is often time-consuming and could potentially introduce errors in echo planar imaging (EPI) time courses, and is therefore not carried out in most fMRI studies. Image-registration based on signal intensity is biased towards the sensitivity profile of the surface coil rather than the signal intensity of the brain tissue, making some type of preprocessing necessary. Second, rat fMRI data are typically acquired in the coronal plane to minimize the magnetic susceptibility effect. Compared with the human head, the fractional volume of rat brain tissue within the field of view is relatively small (∼1/3) in this orientation. The accuracy of image registration is compromised by the high tissue volume outside the brain. Thus brain tissue masking appears to be necessary. However, automated accurate tissue masking of the rat brain is technically challenging at present, particularly when a surface coil is used.
A unique anatomical feature of rodents is that their skull shape and size as well as their brain structure are very similar as long as their weights are within a given range. Paxinos et al. (5) have shown that for rats of different sex and strains but of similar weights, the antero-posterior distance between the interaural line and bregma (two most prominent caudal and rostral landmarks on the top of rat skull) is between 9.0 and 9.4 mm. Such similarity has formed the basis for utilizing the standard rat brain atlas as anatomical reference for stereotaxic procedures in basic neuroscience research. Furthermore, they also found a strikingly stable relationship between bregma and the anterior commissure in all rats, independent of sex and strain. With rat weight ranging from 180 g to 436 g, bregma was always found to be above the most forward crossing fibers of the anterior commissure (+0.1 mm). In neuroimaging, this feature offers the opportunity to standardize scan procedures and can provide a common framework for anatomical localization of functional activation and morphological identification.
Several groups have reported the creation of rat brain templates and methods to localize activation sites to a standard rat brain atlas (6,7,8,9,10). In the present study, an alternative approach is presented. We standardized slice localization to the anterior commissure, a prominent intrinsic anatomical landmark in the rat, and registered data from individual animals to a common space using Analysis of Functional NeuroImages (AFNI) software (11). This method exploits the unique properties of the stable shape and size inherent in rat brain structures and does not rely on scaling or shearing. As such, the aligned rat brain volumes are devoid of potential errors resulting from complicated spatial transformations. Further, the present approach is not biased by the sensitivity profile of surface coils and does not require brain tissue masking. With images registered to a common 3D space, we were then able to analyze rat fMRI data on a group level. In addition, we also registered Paxinos rat brain atlas to the same common space. Activated brain areas could then be accurately identified from the atlas. This method is a further refinement of that presented in our previous report (12). Given the fact that AFNI has been widely used in the fMRI field, the method presented in this paper can be readily extended to other types of studies.
Methods
Animal Preparation
Animal preparation procedures were similar to those previously reported (3). Briefly, rats (weight: 310 ± 24 g) were anesthetized with 2% isoflurane in 1:1 mixture of oxygen and air. A femoral artery was catheterized for blood sampling and blood pressure monitoring; a femoral vein was catheterized for drug administration. Rats were intubated for artificial ventilation. A customized T-shaped trachea tube was used to bypass the exhaled air to a gas analyzer for continuous monitoring of end-tidal CO2 and O2. Core body temperature was maintained at 37.5 ± 0.5° C with a temperature-controlled water-circulating pad. After surgery, anesthetics was switched to α-chloralose for fMRI experiments with a loading dose of 50 mg/kg (I.V.) followed by continuous I.V. infusion at 30 mg/kg/hr. A neuromuscular blocking agent (pancuronium, 1.5 g/kg/hr) was used to further minimize motion artifacts. The contrast agent ferumoxtran-10 (Advanced Magnetics, Cambridge, MA) was administered (I.V.) at an iron dose of 20 mg/kg to enhance the sensitivity and to offset the positive BOLD effect in CBV-weighted fMRI signal (13). Two needles were inserted into the right forepaw between digits 2 and 3 and digits 4 and 5. The needles were connected to a constant-current stimulator (Model S88, Grass Instruments, MA). Stimulating parameters were: monopolar anodal pulse with a duration of 3 ms, frequency 3 Hz and current intensity of 3 mA. The stimulus paradigm was a block design consisting of three cycles of 40 sec off and 20 sec on, starting with 20 sec of baseline. We conducted high-resolution anatomical scans on eleven rats, six of whom received fMRI scans. The animal protocol was approved by the Animal Care and Use Committee of the National Institute on Drug Abuse, Intramural Research Program, National Institutes of Health.
MRI Scan and Image Registration
MRI experiments were carried out on a Bruker Biospin 9.4T scanner (Bruker Medizintechnik, Karlsruhe, Germany) equipped with an actively shielded gradient coil. The inner diameter of the gradient coil was 0.12 m, and the maximum gradient strength was 40 mT/m. A birdcage coil driven in linear mode was used for RF excitation, and a single-turn circular surface coil (3 cm in diameter) was used for signal reception. An animal holder with customized ear bars and bite bar was used to secure rats inside the magnet. Following initial localization scans, a Rapid Acquisition with Relaxation Enhancement (RARE) sequence was used to acquire 11 slices in the sagittal plane and 23 slices in the coronal plane. Scan parameters were: TR = 2650 ms, effective TE = 60 ms, FOV = 35 mm, matrix size = 256 × 256, slice thickness = 1.0 mm. As shown in Fig. 1, the anterior commissure appears dark in T2-weighted images and can be readily identified, which corresponds to Bregma -0.36 mm (14). Subsequently, the same RARE sequence was used to acquire images in the coronal plane with the central slice carefully centered on the anterior commissure. These coronal images provide full brain coverage where the most rostral slice corresponds to Bregma 10.64 mm and the most caudal slice corresponds to Bregma -11.36 mm. Arrows in figure 1 indicates anterior commissure in three imaging planes, which is used as the anatomical landmark to standardize scan localizations.
Figure 1.
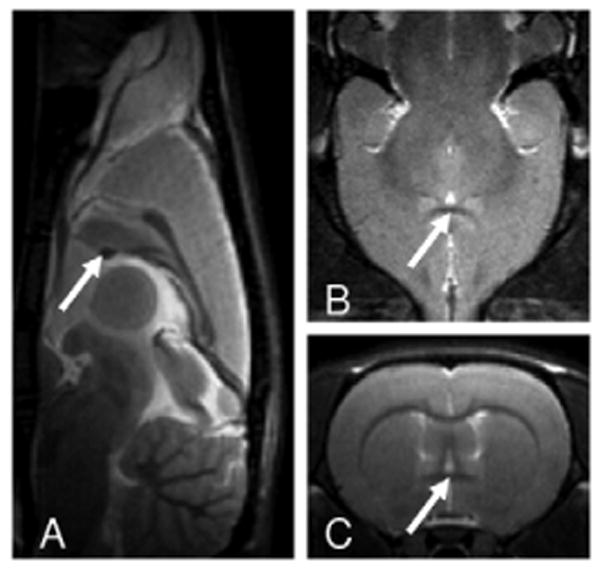
High-resolution T2-weighted anatomical images in sagittal (A), axial (B) and coronal (C) orientations showing anterior commissure, as indicated by arrows, which was used for slice localization.
A high-resolution coronal digital rat brain atlas (14) was processed in MATLAB (The MathWorks, Inc., Natick, MA). Specifically, MRI slice location relative to bregma coordinates along the rostral-caudal direction was first identified. The digital atlases whose bregma coordinates match MRI slice locations were processed such that the matrix size and the format of those digital images were consistent with the MRI images. In addition, the dimensions of the digital atlas were also linearly scaled in the X and Y directions so that the outer contour of individual digital images matched that of the MRI images acquired using the RARE sequence. The processed digital atlas was saved in AFNI format, which consists of a “.BRIK” file holding voxel signal intensity and a “.HEAD” file holding header information, such as image orientation, slice thickness, matrix size etc.
Ten prominent anatomical landmarks were identified from high-resolution T2-weighted anatomical images and were “tagged” using AFNI software. Those landmarks include rostral rhinal incisure, superior brain boundary on midline, anterior commissure, bilateral anterior horn of the anterior commissure, bilateral rhinal fissure, inferior boundary of fourth ventricle on the midline. Figure 2 depicts the locations of landmarks with corresponding digital atlas overlaid on the right. We chose those anatomical landmarks for several reasons: they are reliably identifiable in T2-weighted RARE images to permit repeatability; the most rostral (Bregma +8.64 mm) and the most caudal (Bregma -11.36 mm) tags are essential for identifying the angle of rotation along the rostral-caudal axis between each subject and the master anatomical space; the rest of the tags ensure the proper in-plane rotation, as well as through- and in-plane translations. A computer program was written to automatically transfer image data from the MR scanner to AFNI. The anatomical landmarks were then manually identified in AFNI, which takes less than 3 min.
Figure 2.
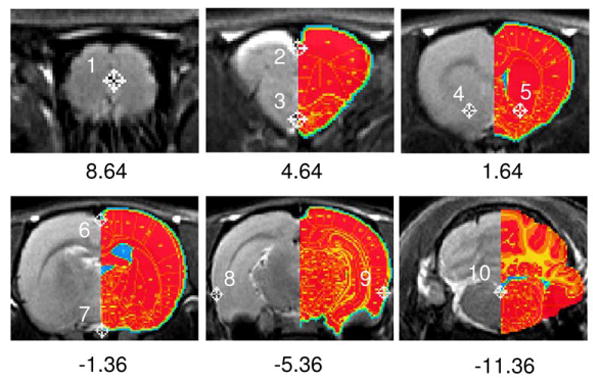
Rat coronal slices showing tag locations with the Paxinos rat atlas superimposed on the right half of each slice. Number below each figure indicates distance relative to bregma. The top-left image (slice 3/23) is centered at bregma +8.64 mm, where there is no standard rat atlas at this location, and therefore no atlas is overlaid.
Although care has been taken to appropriately load each rat to the animal holder, however, given the fact that rats were manually anchored to a custom-made animal holder with two ear bars and one bite bar, the positioning of the ear bars inside the ear canals could vary from experiment to experiment, as does the positioning of the bite bar. In addition, there are two gradient coils in our imaging system, with one of large diameter for imaging primates and a small one for imaging rodents. The small gradient coil is manually mounted inside the large gradient coil. Small misalignment could occur each time we switch those coils for different imaging purposes. Thus, each rat could have different physical locations inside the magnet. A dataset from an animal with the “best positioning” inside the magnet was identified as the master dataset. Images in this dataset are symmetric with minimum rotations or translations along any direction as identified by two experienced experimenters. Datasets from other animals were registered to the master dataset using the AFNI built-in function “3dTagalign”. This method employs a least-squares algorithm to find the rotational and translational matrices (15). Briefly, for two sets of points {Pi} and {Qi} which are related by:
| [1] |
Here Pi, Qi and Ni are 3 × 1 matrices with Ni represents noise (i = 1,2,…,N). Optimal rotation matrix R (3 × 3) and translational matrix T (3 × 1) are found such that is minimized. We constrained the transformation to be translational and rotational without shearing or scaling. The transformation matrix was subsequently applied to fMRI scans generated in the same scanning session.
The accuracy of the above registration procedure was evaluated by computing the “target registration error (TRE)”, as proposed by Fitzpatrick et al (16). Specifically, seven target brain structures were identified: bilateral anterior part of the anterior commissure, central midline of the anterior commissure, central midline of the posterior commissure, central aqueduct and bilateral rhinal fissures 6 mm caudal to bregma. Figure 3 illustrates the landmark locations. The maximum distance of the target points was 10 mm apart along the rostral-caudal direction, and 14 mm apart along the medial-lateral direction. These target points cover most of the interested brain areas in our studies. TRE was calculated as follows:
Figure 3.
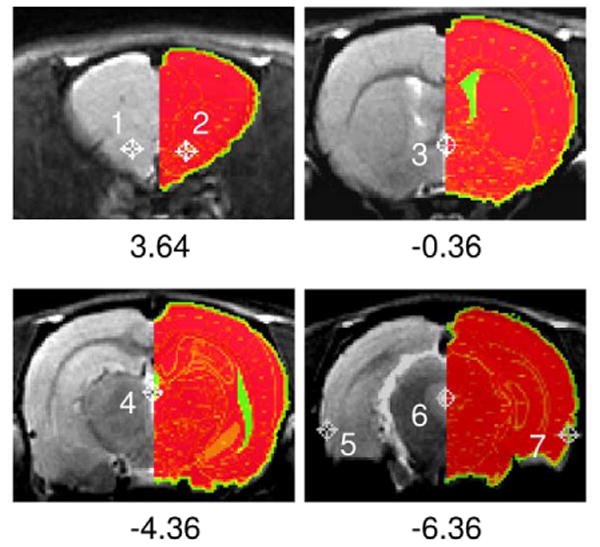
Rat coronal slices showing landmarks used for calculating target registration error (TLE). Corresponding Paxinos rat atlas is superimposed on the right. Number below each figure indicates distance relative to bregma.
| [2] |
Here (Xi, Yi, Zi) and (Ui, Vi, Wi) are the coordinates of the ith landmark in the template and registered dataset, respectively. For each landmark, mean and standard deviation of TRE values from all animals were calculated.
fMRI Data Acquisition and Analysis
The utility of the proposed method is demonstrated in the analysis of fMRI data acquired during electrical forepaw stimulation. fMRI data were acquired using a single-shot echo planar imaging (EPI) sequence with the following parameters: TR = 1000 ms, TE =15 ms, FOV=3.5 cm, spectral width = 333 KHz, matrix size = 64 × 64, slice thickness = 1.5 mm, with the central slice localized at the anterior commissure. fMRI data from each animal were registered to a common 3D space using the transformation matrix derived from high-resolution anatomical images as described above. Registered fMRI data were then analyzed in the following two steps: first, a boxcar function representing “on” and “off” periods of the stimuli was used as the reference function and used to cross-correlate with all time courses. The CBV-weighted fMRI signal is negatively correlated with the stimulation paradigm. Voxels with a cross-correlation coefficient less than -0.6 and with a p-value typically less than 10-8 were considered “activated”. Time courses of those activated voxels were averaged to generate an ideal reference function. This function was considered to have appropriate hemodynamic response shape and delay. Second, time courses from all voxels were fitted with the ideal reference function. Fit coefficients from all animals were subject to a one-sample two-tailed t-test. P<0.005 was considered significant in this group analysis. Data are presented as mean ± S.D. unless otherwise specified.
Results
Inter-subject Validation
In a realistic scanning scenario, each animal is carefully secured with the bite bar and ear bars. Nevertheless, differences in scanning position between rats are still quite evident. In order to evaluate the accuracy of the image registration procedure, we computed TLEs from individual subjects after registration to the master dataset. Table 1 lists the results performed by two experienced experimenters. The maximum distance between the tag pairs in the registered and the master datasets was 0.379±0.216 mm, which was the sixth tag on the far caudal section. The registration errors in the middle sections of the rat brain were between 0.16∼0.238 mm (tags 2∼5). The mean TLE differences calculated based on tags placed by two experienced experimenters were within 0.045 mm, indicating consistent performance of this method. Using a different registration approach, Liu et al. reported a registration accuracy of ∼0.5 mm (17). Our results appear to be at least comparable to or better than that study.
Table 1.
Registration error between the registered dataset and the master dataset.
| Tag Number | ||||||||
|---|---|---|---|---|---|---|---|---|
| #1 | #2 | #3 | #4 | #5 | #6 | #7 | ||
| I |
ΔX (mm) |
0.056 ±0.116 |
0.152 ±0.079 |
0.047 ± 0.062 |
-0.058 ± 0.062 |
-0.047 ±0.082 |
-0.117 ± 0.123 |
0.07 ± 0.185 |
|
ΔY (mm) |
-0.222 ±0.178 |
-0.187 ± 0.176 |
-0.211 ± 0.108 |
0.140 ± 0.181 |
-0.140 ± 0.092 |
-0.339 ± 0.217 |
0.070 ± 0.184 |
|
|
TLE (mm) |
0.275 ±0.141 |
0.272 ± 0.140 |
0.221 ± 0.113 |
0.200 ± 0.128 |
0.170 ± 0.086 |
0.379 ± 0.216 |
0.253 ± 0.104 |
|
| II |
ΔX (mm) |
-0.123 ±0.151 |
0.145 ±0.136 |
0.068 ±0.072 |
-0.109 ±0.058 |
-0.082 ±0.07 |
-0.178 ±0.183 |
0.055 ±0.147 |
|
ΔY (mm) |
0.136 ±0.232 |
0.150 ±0.150 |
0.212 ±0.08 |
0.00 ±0.144 |
0.095 ±0.281 |
-0.124 ±0.218 |
-0.041 ±0.329 |
|
|
TLE (mm) |
0.297 ±0.127 |
0.268 ±0.106 |
0.238 ±0.062 |
0.160 ±0.094 |
0.207 ±0.232 |
0.339 ±0.074 |
0.298 ±0.151 |
|
ΔX and ΔY are differences in X and Y coordinates of each tag in individual registered dataset relative to the master dataset. TLE is the target registration error calculated by two experimenters based on equation 2. Data are presented as mean ± S.D. (n = 11 animals).
Mapping fMRI Activation to Electrical Forepaw Stimulation on Common 3D Space
Consistent with previous studies, iron-oxide contrast agent significantly enhanced the contrast-to-noise ratio of the fMRI signal (18,19). A robust fMRI response was detected from all animals with an averaged fractional signal change of 13.5 ± 4.7 % (n = 6, mean ± S.D.) within the primary somatosensory cortex of the forelimb area (S1FL). A voxel-wise one-sample, two-tailed t-test was performed. Statistically significant activated areas were overlaid to the digital rat atlas (without masking) and are shown in Fig. 4.
Figure 4.
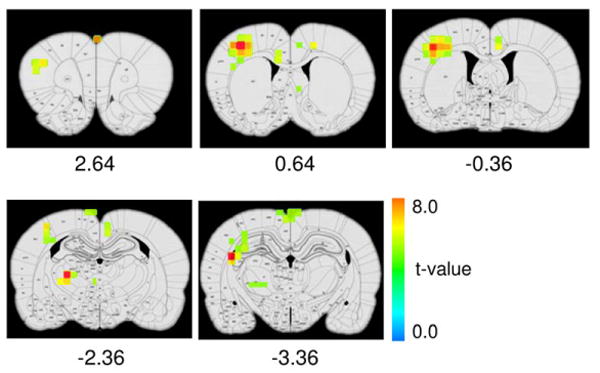
T-statistical activation maps superimposed onto a rat digital atlas (one-sample two-tailed t-test, p<0.005, n = 6 animals). With the aid of this rat atlas, activated structures can be identified, allowing for accurate region-of-interest analysis.
With the aid of the rat digital atlas, the following activated areas can be readily identified: the center of cortical activation is clearly clustered in S1FL region (0.64 mm from bregma) contralateral to the stimulation side. The ventrolateral thalamic nucleus (VL) and ventral posterolateral thalamic nucleus (VPL) are also activated, consistent with known somatosensory projection pathways in the CNS (14). There appears also to be an activated cluster in the fimbria of the hippocampus. The implication of this finding remains to be explored, as this area is generally not considered to be part of the somatosensory system. In addition, activated areas in the cortex also extended to the primary somatosensory cortex in the dysgranular zone (S1DZ), upper lip region (S1ULP) and barrel field (S1BF). Given the fact that our imaging resolution is relatively low and the fact that S1FL and S1DZ are anatomically close, the extension of cortical activation area to S1DZ may be explained by a partial-volume effect. But the activation of S1ULP and S1BF cannot be fully explained by partial-volume effect. In a high-resolution study by Keilholz et al. (10), activations of these areas were also evident (e.g. Fig. 5), suggesting that the electrical forepaw stimulation procedure we are currently using may activate neuronal pathways beyond S1FL.
Discussion
In the present study, a method for registering rat images to a common space is presented. This method is rooted in the biological observation that the skull shape and size as well as the brain structure of rats are essentially the same as long as their weights are within a given range. As such, the registration procedures employs only rigid-body transformations, scaling or shearing were not incorporated, preserving the unique properties of the stable shape and size inherent in the rat brain. The Paxinos rat atlas was used to facilitate the identification of activated areas in common stereotaxic space, allowing accurate ROI analysis.
Several technical limitations in the proposed method need to be considered. Consistent tag placement across animals is critically important to ensure successful registration. Tag placement is a manual procedure and thus is operator-dependent, leaving this method potentially vulnerable to operator performance. We have taken several steps to minimize operator-dependency: we standardized slice localization to the anterior commissure; we chose ten, a relatively large number of anatomical landmarks for tag placement. Those landmarks were readily identifiable in T2-weighted anatomical images and covered six brain slices with large anatomical coverage (rostral-caudal: 20 mm; dorsal-ventral: 10 mm; medial-lateral: 14.6 mm). Such a large anatomical coverage was essential for accurately computing the translational and rotational matrix. As a result, the registration accuracy between experienced operators was reasonably consistent as shown in table 1. In order to test whether reducing slice thickness could improve registration accuracy, we reduced slice thickness to 0.5 mm, with the total number of slices increased to 47, the registration outcome (data not shown), was comparable to that in table 1, but the total scan time doubled. Thus, this method has a registration accuracy of ∼0.4 mm and is more suitable for group analysis of imaging data at relatively low resolution, as is commonly used for functional imaging.
There have been efforts for automated registration of rodent images. Several techniques (20,21) have been developed to register 3D MRI images of mouse brain. The registration algorithm involves signal intensity correction, affine transformation and multiple-step deformation-based non-linear registration. The aim of these studies was to automatically identify anatomical phenotyping of mutant mice. In these studies, 3D anatomical images were acquired with a resolution as high as 60 μm, with the scan time ranging from 2 hours to 18.5 hours and the registration took up to 15 hours. Although these studies laid the technical foundations for registering rodent brain images in an automated way, the above algorithms do not take into account inherent distortions of EPI images and long time series (large volumes of 3D data), and thus cannot readily be applied to fMRI studies. In the functional neuroimaging literature, a recent study by Pascau et al. (22) applied a registration algorithm based on information theory, and utilized different approaches to mask the reference image. They reported a highest accuracy of 0.67 mm on average. Better registration accuracy with a tolerance estimated to be ∼0.5 mm was reported in Ref. 16. In that study, they applied a standard affine transformation with 12 degrees of freedom (3 translations, 3 rotations, 3 inflations, and 3 skews). However, the registration accuracy achieved by the above automated approaches appears to be readily achievable using the manual registration method as reported here with high efficiency. Recently, surface-based image registration has shown promise for image-guided liver surgery (23). Given the high degree of anatomical similarities among rats of similar weights, the development of automated image registration based upon 3D rat brain surface profiles will likely enhance the accuracy.
Acknowledgments
The authors thank Dr. J. B. Mandeville at the Massachusetts General Hospital and Dr. A. C. Silva at the National Institute of Neurological Disease and Stroke (NINDS) for valuable discussions. This work was supported by the Intramural Research Program of the National Institute on Drug Abuse, National Institutes of Health.
Footnotes
Publisher's Disclaimer: This is a PDF file of an unedited manuscript that has been accepted for publication. As a service to our customers we are providing this early version of the manuscript. The manuscript will undergo copyediting, typesetting, and review of the resulting proof before it is published in its final citable form. Please note that during the production process errors may be discovered which could affect the content, and all legal disclaimers that apply to the journal pertain.
References
- 1.Hyder F, Behar KL, Martin MA, Shulman RG. Dynamic magnetic resonance imaging of the rat brain during forepaw stimulation. J Cereb Blood Flow Metab. 1994;14:649–55. doi: 10.1038/jcbfm.1994.81. [DOI] [PubMed] [Google Scholar]
- 2.Duong TQ, Silva AC, Lee SP, Kim SG. Functional MRI of calcium-dependent synaptic activity: cross correlation with CBF and BOLD measurements. Magn Reson Med. 2000;43:383–92. doi: 10.1002/(sici)1522-2594(200003)43:3<383::aid-mrm10>3.0.co;2-q. [DOI] [PubMed] [Google Scholar]
- 3.Lu H, Patel S, Luo F, Li SJ, Hillard CJ, Ward BD, Hyde JS. Spatial correlations of laminar BOLD and CBV responses to rat whisker stimulation with neuronal activity localized by Fos expression. Magn Reson Med. 2004;52:1060–1068. doi: 10.1002/mrm.20265. [DOI] [PubMed] [Google Scholar]
- 4.Brey WW, Narayana PA. Correction for intensity falloff in surface coil magnetic resonance imaging. Med Phys. 1987;15:241–5. doi: 10.1118/1.596255. [DOI] [PubMed] [Google Scholar]
- 5.Paxinos G, Watson C, Pennisi M, Topple A. Bregma, lambda and the interaural midpoint in stereotaxic surgery with rats of different sex, strain and weight. J Neurosci Methods. 1985;13:139–43. doi: 10.1016/0165-0270(85)90026-3. [DOI] [PubMed] [Google Scholar]
- 6.Toga AW. A digital three-dimensional atlas of structure/function relationships. J Chem Neuroanat. 1991;4:313–8. doi: 10.1016/0891-0618(91)90039-f. [DOI] [PubMed] [Google Scholar]
- 7.Schweinhardt P, Fransson P, Olson L, Spenger C, Andersson JL. A template for spatial normalisation of MR images of the rat brain. J Neurosci Methods. 2003;129:105–13. doi: 10.1016/s0165-0270(03)00192-4. [DOI] [PubMed] [Google Scholar]
- 8.Schwarz AJ, Danckaert A, Reese T, Gozzi A, Paxinos G, Watson C, Merlo-Pich EV, Bifone A. A stereotaxic MRI template set for the rat brain with tissue class distribution maps and co-registered anatomical atlas: application to pharmacological MRI. Neuroimage. 2006;32:538–50. doi: 10.1016/j.neuroimage.2006.04.214. [DOI] [PubMed] [Google Scholar]
- 9.Leergaard TB, Bjaalie JG, Devor A, Wald LL, Dale AM. In vivo tracing of major rat brain pathways using manganese-enhanced magnetic resonance imaging and three-dimensional digital atlasing. Neuroimage. 2003;20:1591–600. doi: 10.1016/j.neuroimage.2003.07.009. [DOI] [PubMed] [Google Scholar]
- 10.Keilholz SD, Silva AC, Raman M, Merkle H, Koretsky AP. BOLD and CBV-weighted functional magnetic resonance imaging of the rat somatosensory system. Magn Reson Med. 2006;55:316–24. doi: 10.1002/mrm.20744. [DOI] [PubMed] [Google Scholar]
- 11.Cox RW. AFNI: software for analysis and visualization of functional magnetic resonance neuroimages. Comput Biomed Res. 1996;29:162–73. doi: 10.1006/cbmr.1996.0014. [DOI] [PubMed] [Google Scholar]
- 12.Lu H, Xi ZX, Gitajn L, Rea W, Yang Y, Stein EA. Cocaine-induced brain activation detected by dynamic manganese-enhanced magnetic resonance imaging (MEMRI) Proc Natl Acad Sci USA. 2007;104:2489–94. doi: 10.1073/pnas.0606983104. [DOI] [PMC free article] [PubMed] [Google Scholar]
- 13.Lu H, Scholl CA, Zuo Y, Stein EA, Yang Y. Quantifying the blood oxygenation level dependent effect in cerebral blood volume-weighted functional MRI at 9.4T. Magn Reson Med. 2007;58:616–21. doi: 10.1002/mrm.21354. [DOI] [PubMed] [Google Scholar]
- 14.Paxinos G, Watson C. The Rat Nernous System. 5th. Academic Press, Inc.; San Diego: [Google Scholar]
- 15.Arun KS, Huang TS, Blostein SD. Least-squares fitting of 2 3-D point sets. IEEE Trans Pattern Anal Mach Intell. 1987;9:699–700. doi: 10.1109/tpami.1987.4767965. [DOI] [PubMed] [Google Scholar]
- 16.Fitzpatrick JM, West JB, Maurer CR., Jr Predicting error in rigid-body point-based registration. IEEE Trans Med Imaging. 1998;17:694–702. doi: 10.1109/42.736021. [DOI] [PubMed] [Google Scholar]
- 17.Liu CH, Greve DN, Dai G, Marota JJ, Mandeville JB. Remifentanil administration reveals biphasic phMRI temporal responses in rat consistent with dynamic receptor regulation. Neuroimage. 2007;34:1042–53. doi: 10.1016/j.neuroimage.2006.10.028. [DOI] [PMC free article] [PubMed] [Google Scholar]
- 18.Mandeville JB, Jenkins BG, Chen YC, Choi JK, Kim YR, Belen D, Liu C, Kosofsky BE, Marota JJ. Exogenous contrast agent improves sensitivity of gradient-echo functional magnetic resonance imaging at 9.4 T. Magn Reson Med. 2004;52:1272–81. doi: 10.1002/mrm.20278. [DOI] [PubMed] [Google Scholar]
- 19.Zhao F, Wang P, Hendrich K, Ugurbil K, Kim SG. Cortical layer-dependent BOLD and CBV responses measured by spin-echo and gradient-echo fMRI: insights into hemodynamic regulation. Neuroimage. 2006;30:1149–1160. doi: 10.1016/j.neuroimage.2005.11.013. [DOI] [PubMed] [Google Scholar]
- 20.Nieman BJ, Flenniken AM, Adamson SL, Henkelman RM, Sled JG. Anatomical phenotyping in the brain and skull of a mutant mouse by magnetic resonance imaging and computed tomography. Physiological Genomics. 2006;24:154–62. doi: 10.1152/physiolgenomics.00217.2005. [DOI] [PubMed] [Google Scholar]
- 21.Chen XJ, Kovacevic N, Lobaugh NJ, Sled JG, Henkelman RM, Henderson JT. Neuroanatomical differences between mouse strains as shown by high-resolution 3D MRI. Neuroimage. 2006;29:99–105. doi: 10.1016/j.neuroimage.2005.07.008. [DOI] [PubMed] [Google Scholar]
- 22.Pascau J, Gispert JD, Michaelides M, Thanos PK, Volkow ND, Vaquero JJ, Soto-Montenegro ML, Desco M. Automated Method for Small-Animal PET Image Registration with Intrinsic Validation. Mol Imaging Biol. 2008 doi: 10.1007/s11307-008-0166-z. [DOI] [PMC free article] [PubMed] [Google Scholar]
- 23.Clements LW, Chapman WC, Dawant BM, Galloway RL, Jr, Miga MI. Robust surface registration using salient anatomical features for image-guided liver surgery: algorithm and validation. Med Phys. 2008;35:2528–40. doi: 10.1118/1.2911920. [DOI] [PMC free article] [PubMed] [Google Scholar]