

Abstract
Multiple sclerosis (MS) is primarily characterized as a neurodegenerative autoimmune disease. MS affects the central nervous system (CNS), mainly the white matter tissue, producing plaques or lesions in the brain and spinal cord. The white matter tissue contains nerve fibers, which transmit electrical signals throughout the nervous system. In addition to CNS lesions, MS is also characterized as an autoimmune disorder, which involves a dysregulation of the immune system causing the myelin sheath to be degraded. The myelin sheath insulates axons allowing for quicker nerve impulses between cells. Thus, this demyelinating process leads to the retardation or complete blockage of signal pathways in the CNS. The axons may also be damaged due to lack of insulation and nutrients supplied by surrounding cells. The inflammation can also affect the oligodendrocytes, which nourish the nerve cells. It is through these processes that scar tissue is formed (“sclerosis”) in various areas in the CNS (“multiple”).
Like most common diseases, MS has several characteristics of an etiologically complex disease including heterogeneity, incomplete penetrance, temporal changes, polygenic inheritance, environmental risk factors, and genetic predisposition. Clinically, the complexity of this disease involves the location, size, and duration of these lesions, which are variable and unpredictable. This lack of predictability can lead to a vast spectrum of symptoms, which can vary among attacks or episodes of the disease throughout the progression (Compston and Coles 2002; Kutzelnigg et al. 2005).
Symptoms for this disorder involve disturbances of vision, motor and sensory systems, coordination and balance, bowel/bladder/sexual, and cognition. Vision difficulties may include double vision, blurred vision, blindness in one or both eyes, eye pain, and jerky eye movements. Motor problems include partial or full paralysis, muscle weakness, stiffness, slurred speech, and twitching muscles or tremors. Some individuals experience sensory discomfort, such as numbness (especially in the extremities), loss of awareness, facial pain, electric shocks, sensitivity to heat, and a tightness around the torso or stomach (which has been termed “the MS hug”). Ataxia, nausea, vertigo, stuttering, and loss of the ability to produce rapidly alternating movements are symptoms of impaired coordination and balance. Bowel/bladder problems include urgency, incontinence, retention, and sexual impotence. Cognitive difficulties include depression, short-term or long-term memory loss, dementia, mood swings, and anxiety. Other symptoms include fatigue, sleeping disorders, and epileptic seizures. The most common of these symptoms includes visual problems, spasticity, numbness/tingling, bowel/bladder/sexual dysfunction, depression, and fatigue (Compston and Coles 2002; Noseworthy et al. 2000).
These various symptoms can appear in each of the four clinically-defined types of MS. The most common type is relapsing-remitting (RRMS), which occurs in approximately 55% of the cases. Clinically, it is characterized by relapses or attacks followed by either partial or total recovery of symptoms. Biologically, it is characterized as focal areas of inflammation and demyelination, which resolve themselves over time leading to recovery. Thus, the damage done by inflammation is at least partially reversible. Secondary progressive MS (SPMS) is the second most common type of MS accounting for about 30% of cases. SPMS is characterized by the initial relapses of RRMS, which over the course of the disease are replaced by progressive disability. Individuals with SPMS begin with reversible disability, but for unknown reasons, axonal degeneration occurs leading to irreversible damage, which presents clinically as progressive disability. Primary progressive_MS (PPMS) occurs in approximately 10% of MS cases. PPMS is characterized by progressive disability with no remitting stages. Thus, individuals with this clinical sub-type are plagued with irreversible damage that causes a slow or step-wise progression to increased disability with little to no symptomatic relief. Progressive relapsing MS (PRMS) occurs in nearly 5% of cases. This clinical sub-type is characterized by progressive disability from the onset of symptoms, similar to PPMS, but also involves acute attacks or relapses. The reasons for this neurological variability remain unknown. Much of the biological process is clinically silent. Moreover, despite intuitive reasoning, the lesion burden does not necessarily correlate with the amount or intensity of disability (Confavreux et al. 2000; Noseworthy et al. 2000; Trapp and Nave 2008) (Figure 1).
Figure 1.
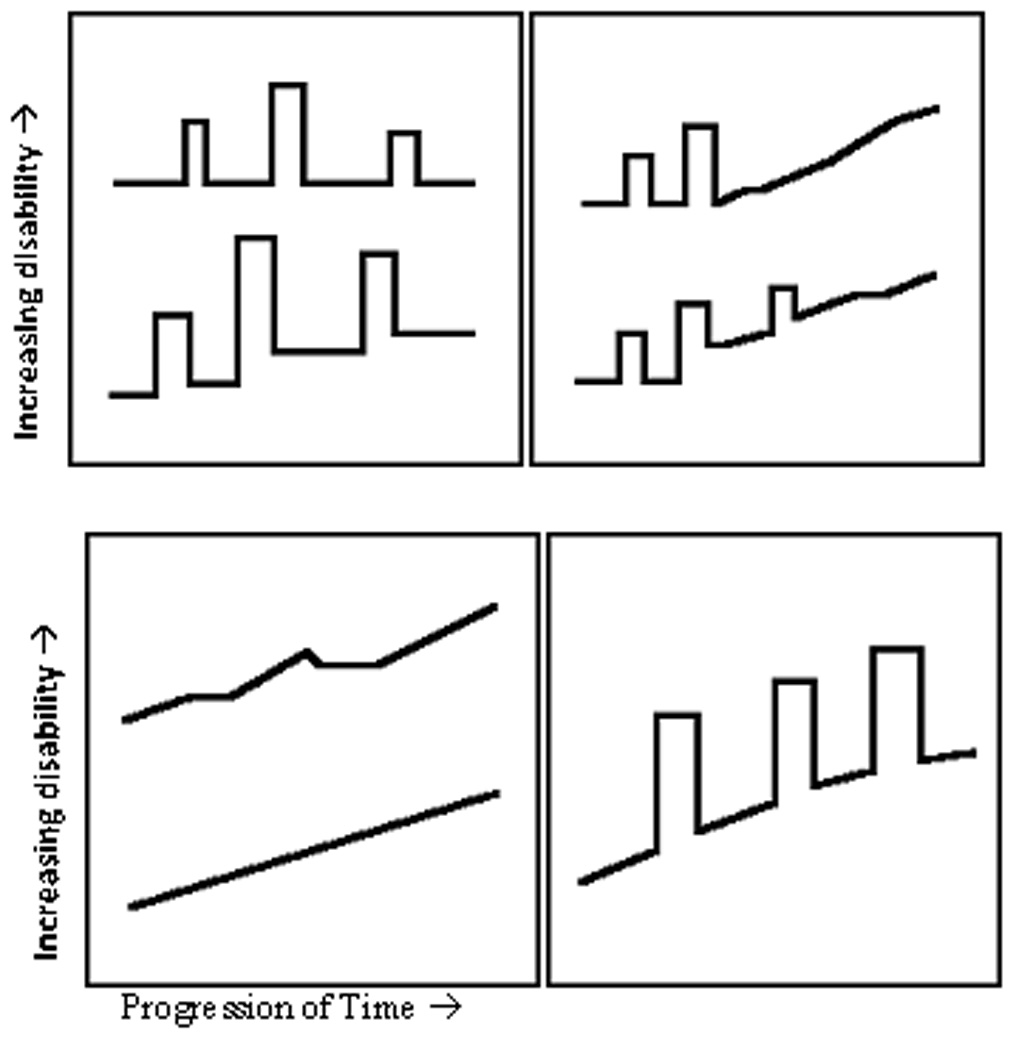
Types of MS (left to right; top to bottom): relapsing-remitting, secondary progressive, primary progressive, and progressive relapsing (excerpt from All About Multiple Sclerosis, available at www.mult-sclerosis.org).
MS is unmistakably a clinically complex disease. The heterogeneity in severity, multiple phenotype presentations, rate of onset, and pattern of symptoms are highly variable among individuals, where a continuum between slow mild onset and rapid acute onset is possible. This clinical variability translates to extreme debilitation for some, where others conduct their daily lives with no dramatic changes. Understanding the disease etiology of this autoimmune disorder is crucial to help those who suffer with extreme disability and to prevent those mildly affected from becoming debilitated.
Risk factors
Multiple sclerosis is primarily a disease of the temperate climates; approximately 1 in every 1000 Americans suffer from this disorder (e.g. about 400,000 Americans suffer from this disease), which is a point prevalence estimate of ~0.1%. MS is moderately common in the United States, Canada, Russia, Israel, Europe, New Zealand, and parts of Australia. Incidence in these high risk areas ranges from 0.1 to 0.2%. Individuals from regions above 40° latitude within the western hemisphere generally have a higher risk of MS than other regions. Although the regions of risk have not changed, it appears that the latitude gradient is disappearing, which indicates an increase in incidence in southern regions of these areas; for example, the southern part of the United States has comparable MS incidence to the northern parts, and southern regions in Europe have increased incidence of MS (Ascherio and Munger 2007). Areas of low prevalence, for example Asia, Africa, and South America, have incidence rates much lower than 0.1%, more on the order of ~0.005%. Equatorial countries are usually the areas of low risk, while the northernmost and southernmost countries tend to be areas of high risk (Kantarci and Wingerchuk 2006).
The geographic variation of MS may result in part from differences in genetic predisposition. However, beyond the potential for underlying genetic predisposition, it is possible that geographic differences in the amount of sunlight may prove to be potential risk factors. Incidence patterns have shown that risk cannot be associated with sunlight alone. For example, the far northern region of Norway should have the highest incidence of MS, but Scotland and England have higher incidence rates. This suggests that there may be some kind of interaction between sunlight and other factors, such as diet (Ebers 2008). Suggestions have been made that there is a connection between sun exposure and vitamin D deficiency because vitamin supplementation and past sun exposure are both associated with a person’s risk of MS. In addition to vitamin D, consumption of oily fish has been shown to lower the risk. Further evidence for the suggestive protection of a fish diet stems from the differences in prevalence between inland and coastal regions of various countries (prevalence up to 5 times higher among inland regions). Although positive relationships have been established, no conclusive evidence has pointed to how these factors contribute to the pathogenesis of MS (Ebers 2008; Kantarci and Wingerchuk 2006; Cantorna 2008).
The typical onset of MS is between the ages of 20 and 40 (Hauser and Goodkin 1998). Incidence for MS is low in childhood and rare past the age of 50 (Ascherio and Munger 2007). MS incidence peaks around age 24 and returns to baseline by age 60. This is opposite of what would be expected of an age-related mutation disorder, such as myasthenia gravis or rheumatoid arthritis where incidence increases with age (Ebers 2008).
Women have a two to three-fold higher incidence of MS than men. This is consistent with the phenomenon that women, especially during childbearing years, are more likely to have autoimmune diseases. Women in high risk areas have a lifetime risk of 1 in 200 (Ascherio and Munger 2007). However, this gender ratio was measured before oral contraceptives and the increase of smoking in women. Oral contraceptives are associated with decreased risk, while smoking is associated with increased risk (Trapp and Nave 2008; Alonso et al. 2005; Sundstrom, Nystrom, and Hallmans 2008).
Other potential risk factors include: a common pathogen specific to particular geographic areas, seasonal differences, diet differences, and variable soil minerals. There are two mainstream hypotheses concerning a widespread microbe causing MS: the virus hypothesis and the prevalence hypothesis. The virus hypothesis suggests that a virus increases one’s risk of developing MS if a person is infected in late childhood/early adulthood; however, the virus confers protection if a person is infected during infancy. The second hypothesis simply states that a specific unidentified pathogen that leads to MS is more prevalent in regions of high risk for MS. According to both hypotheses, age of infection by these microbes determines one’s level of susceptibility to MS. Other studies suggest a protective effect of Epstein-Barr virus seronegativity by up to a ten-fold decrease in the risk of acquiring MS (Ascherio and Munger 2007).
Although many putative risk factors have been identified, their contributions to the pathogenesis of MS are not well understood. With a better understanding of the etiology of MS, these risk factors may prove useful in identifying gene targets and clinical methods for alleviating symptoms. Research has shown that certain individuals (i.e. women and individuals diagnosed before age 35), certain disease courses (i.e. those diagnosed with RRMS with long intervals between relapses and complete recovery from relapses), and certain disease symptoms (i.e. those experiencing sensory symptoms, such as tingling or numbness, during relapses instead of motor symptoms, such as tremors and spasticity) have better prognoses. The future of MS research involves the continued identification of genetic variants and environmental factors that will lead to an increased understanding of the pathogenesis of this disorder. With this increased knowledge, better therapeutic treatments can be designed to alleviate an individual’s symptoms, improve outcomes, or aid in the prevention of disease (Compston and Coles 2002; Noseworthy et al. 2000).
Diagnosis
The phenotype of MS has been carefully defined. There are no reliable specific laboratory tests for MS so clinical and paraclinical evidence is essential for the diagnosis. A definite diagnosis of MS requires two different areas of the CNS being affected by inflammation in the form of lesion or plaque formation with two separate occurrences of an “attack,” usually described as a neurological dysfunction (Poser et al. 1983). This broad definition of an attack provides a challenge when designating individuals as affected; thus, paraclinical techniques, such as evoked response studies, tissue imaging procedures, and examination of the cerebrospinal fluid (CSF) were initially used to reduce subjectivity (Goodkin et al. 1991). In addition to this broad definition, there are six criteria required to give a positive diagnosis: 1) Objective abnormalities must be present causing dysfunction in the CNS. 2) These abnormalities must involve the white matter long tracts. 3) Two or more areas of the CNS must be affected. 4) The clinical pattern must either involve two or more separate episodes, each lasting 24 hours and at least 30 days apart, or a slow or step-wise progression of disability over six months and an abnormal spinal fluid screen, in which CSF would contain oligoclonal bands and increased production of immunoglobulin G (IgG). 5) The age of onset should be between the ages of 10 and 60. 6) The symptoms experienced cannot be attributed to another neurological disease. With advancing technologies, the criteria for MS were updated to integrate magnetic resonance imaging (MRI) into the diagnostic scheme. If clinical evidence does not support dissemination of lesions in both time and space, then MRIs can be used to provide evidence for this (McDonald et al. 2001).
Various tests, both paraclinical and laboratory-based, are now used to provide more accurate diagnoses. MRI scans are used to examine the brain and spinal cord for lesions, both active and old. Neurologic exams are performed to investigate coordination, strength, reflexes, and sensation. Various evoked potential tests are utilized to measure nerve response to stimulation. A spinal tap or lumbar puncture is performed to look at the CSF for various abnormalities, such as the number and type of white blood cells, glucose levels, and the levels of various proteins (antibodies and immunoglobins). Medical histories are collected along with various blood tests to rule out other disorders, such as neuromyelitis optica, stroke, brain inflammation, Lyme disease, tumors, or other autoimmune diseases (McDonald et al. 2001; Poser et al. 1983).
Once a person has been diagnosed with MS, the severity of disability must be quantified. Kurtzke Extended Disability Status Score (EDSS) measurements were developed as a method for measuring disability in eight functional systems (FS): pyramidal, cerebellar, brain stem, sensory, bowel and bladder, visual, cerebral, and other. The scale ranges from 0.0 (normal neurological exam) to 10.0 (death due to MS). Measurements 1.0 to 4.5 indicate a person who is fully ambulatory, while the 6.0 to 9.5 range indicates significant impairment. This scale is not linear; some of the important landmarks include: 6.0, requires unilateral assistance; 6.5, requires bilateral assistance; and 7.0, restricted to a wheelchair (Table I) (Kurtzke 1983).
Table I.
Extended Disability Status Score (EDSS) measurements and correlated disability (excerpt from All About Multiple Sclerosis, available at www.mult-sclerosis.org).
| 0.0 | Normal neurological exam |
| 1.0–4.5 | Fully ambulatory without aid |
| 5.0–5.5 | Disability impairs daily activity |
| 6.0 | Unilateral support needed |
| 6.5 | Bilateral support needed |
| 7.0–9.5 | Restricted to wheelchair |
| 10.0 | Death due to MS |
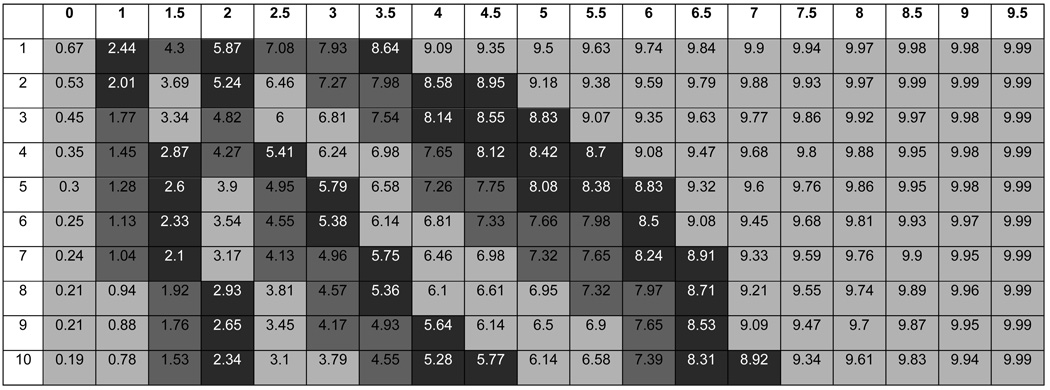
The EDSS, while an excellent attempt at quantifying MS disability, has its drawbacks. It is a subjective measurement that can change frequently even during a single exam. EDSS measurements do not assess disease duration or the difference in rates of disease progression. For example, a person who has a score of 5.0 after 3 years has a very different pattern of progression than a person with a score of 5.0 after 20 years. An algorithm was developed to create a new severity score, the Multiple Sclerosis Severity Score (MSSS), which provides clinicians with a more accurate gauge of future disability in their patients. This method compares the distribution of disability in individuals with comparable durations. The model was tested for its stability over time and its ability to predict future disability with a single EDSS measurement. This new score uses disease duration with EDSS measurements to calculate a person’s decile in the MS severity spectrum. Each decile corresponds to a pattern of disability or disease progression (Table II). Thus, by simply knowing the EDSS measurement and the disease duration, it is possible to predict a person’s approximate disability level after 30 years with MS (Roxburgh et al. 2005).
Table II.
Global Multiple Sclerosis Severity Scores (the x-axis corresponds EDSS scores from Table I and the y-axis corresponds to disease duration years). The deciles are color coded to illustrate different patterns in progression of MS(excerpt from Roxburgh et al. 2005).
 |
Genetics- Early Success
Some of the geographic variation of this disease may result from genetic predisposition. Family studies and twin studies have shown that there is a strong genetic component underlying the etiology of multiple sclerosis. The prevalence of this disease among first-degree relatives of affected individuals is 20 to 40 times higher than the overall population prevalence (λ1=20–40) (Hauser and Goodkin 1998; Mumford et al. 1994; Sadovnick et al. 1993; Sadovnick and Ebers 1995) (Figure 2). The higher concordance rate for monozygotic twins (25–34%) than for dizygotic twins (2–5%) indicates a high heritability. Various genetic studies have examined the risk of the disease to family members of an affected individual. Thus, those genetically identical (monozygotic twins) have the highest risk (~25–34%), and those genetically unrelated (general population) have the lowest risk (~0.1–0.2% in high risk areas). Adoptees have a comparable risk to the general population indicating that living with an affected individual has little or no effect on one’s susceptibility in the absence of biological relatedness (Compston and Coles 2002; Kantarci and Wingerchuk 2006).
Figure 2.
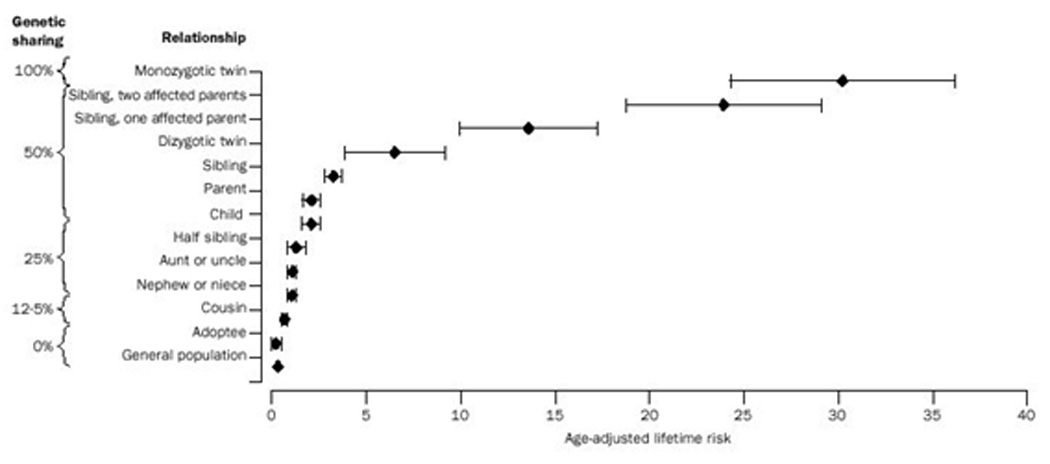
Lifetime risk of MS. (Reprinted from The Lancet, Volume 360, Issue 9333, Alastair Compston and Alasdair Coles, Multiple Sclerosis, Pages 1221–1231, 2002, with permission from Rightslink)
These data confirm the significant genetic contribution to MS. Because of its autoimmune nature, early attempts to identify MS genes were focused on the Major Histocompatibility Complex (MHC). The association between the MHC and MS was first discovered in the early 1970s (Batchelor, Compston, and McDonald 1978; Bertrams and Kuwert 1972; Naito et al. 1972). The specific haplotype associated with the original HLA-DR2 allelic association (HLA-DRB1*1501-DQB*0602) (Kantarci and Wingerchuk 2006) is responsible for this association, but explains only ~25–35% of the genetic component of MS (Dyment, Ebers, and Sadovnick 2004; Haines et al. 1998; Sawcer 2008), with an odds ratio of ~2.00. Recently, independent effects of additional alleles at the HLA-DRB1 locus (Barcellos et al. 2006) and other loci within the MHC (Chao et al. 2008; Yeo et al. 2007) have been described. However, the exact mechanism of how this region increases susceptibility is still unknown.
Genetic Challenges
Since the HLA-DR*1501 allele is not solely responsible for the genetic influence on MS, the search for additional MS genes has been extensive (Oksenberg and Barcellos 2005). MS researchers availed themselves of both genome-wide linkage screens and candidate gene approaches to identify these additional genes. Since the mid-1990s, numerous genome-wide linkage screens have been performed to identify regions that contain MS susceptibility loci. In initial screens, over 70 regions were identified as possible loci for harboring disease alleles (Ebers et al. 1996; Haines et al. 1996; Kuokkanen et al. 1997; Sawcer et al. 1996). However, there is little or no overlap between these regions and every chromosome has been implicated in the risk of MS (Transatlantic Multiple Sclerosis Genetics Cooperative 2001). With limited exceptions, further linkage investigations of these regions has resulted in a lack of replication (Kenealy et al. 2004; Kenealy et al. 2006). More recent and definitive linkage studies performed by the International Multiple Sclerosis Genetics Consortium (IMSGC) (International Multiple Sclerosis Genetics Consortium 2005) clearly demonstrated that the only reliably strong linkage signal resides in the MHC. The primary conclusion from these studies, aside from confirmation of the MHC effect, is that the remaining genetic effects in MS are more moderate in size, and that linkage studies are not adequately powered to detect or confirm these disease loci. Thus application of more powerful genome-wide screening tools, such as genome-wide association studies, was needed.
The alternative approach of taking a focused look at specific candidate genes has been equally frustrating. Although over 100 different candidate genes have been examined and published (Oksenberg et al. 2008), none have been consistently replicated and none have been accepted by the MS genetics community as confirmed. In subsequent review of these studies, several reasons became obvious as to why these studies have not been successful. Most studies lacked strong biological rationale for their so-called candidate genes, others lacked comprehensive coverage of variation in their genes of interest (i.e. few SNPs or haplotypes were examined), and arguably the most crucial fact was that these studies had small sample sizes resulting in a lack of power to detect the mild to moderate effects these genes might have in MS (Sawcer 2008).
New genetic approaches
To address the problems in candidate gene studies, there is a need to design studies that explicitly identify the most likely biological candidates by applying the concept of genomic convergence (Hauser et al. 2003). This methodology first identifies candidate genes where altered gene expression has been observed in multiple independent studies of MS patients or MS animal models. Then the list is further refined to genes (directly or peripherally) known to have involvement in the autoimmune process. The final requirement is that these genes lie within regions of previous genetic linkage. Gregory et al. (2007) used this approach to identify a set of biologically plausible candidate genes. Then using the emerging hapmap data, they identified SNPs covering the common genetic variation in the genes under study (fulfilling the requirement of a comprehensive examination of the candidate gene locus). Finally, large family-based and case-control datasets with sufficient power to detect moderate genetic effects were assembled. In 2007, more than three decades since HLA was first identified, this approach was used to detect a second susceptibility locus for MS, interleukin-7 receptor α gene (IL7RA) (Gregory et al. 2007).
New innovations in technology have addressed the power and coverage issues related to genome-wide screens and in the past two years, genome-wide association studies (GWAS) have become the norm. The IMSGC performed one of the first published GWAS, resulting in the confirmation of IL7RA and the identification of other genetic associations. This study identified an additional gene, interleukin-2 receptor α gene (IL2RA), as an MS disease locus. Based on this initial GWAS, a set of additional genes were tested in independent datasets and have now been confirmed in multiple datasets including CLEC16A, and CD226 (International Multiple Sclerosis Genetics Consortium 2009).
With this second wave, we have a better understanding of what we might expect to find going forward not only in MS, but in complex genetic disease in general. As a scientific community, the field was perhaps naïve to think that all the loci would have larger effects like HLA and that all the risk alleles would be common variants (seen in at least 1% of the population). We are most likely looking for smaller effect sizes with odds ratios around 1.1–1.3.
Looking at common versus rare variation
The data to date suggest that there is one strong genetic effect (HLA DR*1501) and a series of smaller yet important effects (IL7R, IL2R, CLEC16A). These latter effects have been identified primarily through the GWAS approach, whose success in complex disease cannot be overstated. However, it is important to point out that the GWAS approach rests, and tests, only one of two alternative theories that have emerged concerning the architecture of susceptibility to common diseases. GWAS assumes the common disease/common variant hypothesis (CDCV) (Pritchard 2001; Reich and Lander 2001). The CDCV hypothesis suggests that susceptibility to common diseases is determined by a few common variants with lower penetrance. However, the alternative hypothesis invokes the existence of multiple rare variants (MRV, e.g. extensive heterogeneity) (Smith and Lusis 2002). The MRV hypothesis suggests that susceptibility is determined by a large number of rare variants with higher penetrance.
The primary focus in the field of gene discovery over the past five years has been testing the CDCV hypothesis, in part because the tools to do so (i.e. dbSNP, the HapMap Project, and large-scale so-called SNP chips) have become available. These tools have been brought together to perform genome-wide association studies, which have now been applied to over 100 different phenotypes and have identified and confirmed over 350 new genetic associations (http://www.genome.gov/19518660#3). With this incredible flood of data comes the problem of performing thorough analyses. Virtually every study published so far has analyzed the data one SNP at a time and performed analyses assuming simple models. More complex analyses, including those using haplotype information, stratification, and particularly examining the data for gene×gene interactions have yet to become part of the mainstream analysis paradigm.
The MRV hypothesis has received much less attention, but there is growing evidence that it is an important aspect of some complex diseases. The HLA allele and the IL7RA allele are both great examples of common alleles. The HLA allele has a larger effect (odds ratio (OR) ~2) while the IL7RA allele has a smaller effect (OR~1.2). These two gene polymorphisms, however, have very modest attributable risk. Thus, most of the genetic variance, or heritability, attributed to MS is still unknown. MS susceptibility is likely determined by both common variants with lower penetrance and rare variants with higher penetrance. Due to the heterogeneity of this disease, we could be looking for 20–100 common alleles with very modest effect sizes and many more rare alleles. That could explain the variable nature of this complex disease (Sawcer 2008; Wang et al. 2005). With the new technology and our ability to combine larger datasets, we are now better equipped to begin looking for common variants with smaller effect sizes and for rarer variants that could contribute to MS susceptibility.
Gene-gene and Gene-environment interactions
Another explanation for the missing heritability is the possibility of gene × gene or gene × environment interactions. With the lack of great success of GWAS in finding a multitude of variants associated with MS and with the new view that we are looking for variants with smaller effect sizes, interactions between various genes has also surfaced as an architectural component to consider when examining the genetics of complex diseases; perhaps we have not found many large effects because two or more variants have to be present. Despite the amount of linkage and association studies and the amount of available samples, few significant results replicate across different samples. This could be explained by epistasis. If epistasis is acting, previously unreplicated main effects are being observed under the context of other polymorphisms or environmental influences. If a variant with an observed main effect is analyzed with another variant (or environmental variable), these two small effects could create a larger, nonlinear effect (Hirschhorn et al. 2002; Moore 2003). Epistasis may explain why there has been so much frustration over the years to identify a large portion of the genetic component of many common diseases (Sawcer 2008; Wang et al. 2005). These analyses are in their infancy as the data generated from GWAS is only now beginning to be examined in greater depth.
MS has a strong genetic component that is finally beginning to reveal itself. The success of both the genomic convergence influenced candidate gene approach and the GWAS approach has been both a relief and a boon to the collective efforts of the scientific community. MS researchers have made significant inroads, but the majority of the genetic architecture of MS remains undefined. As we move forward, we will continue to extend our knowledge of the genes related to the CDCV hypothesis and their functional consequences, begin to test the MRV hypothesis, and utilize more comprehensive analytic approaches with the existing genetic and epidemiologic data. It is through these comprehensive approaches that we will continue to expand our understanding of the genetics influencing MS.
Footnotes
Publisher's Disclaimer: This is a PDF file of an unedited manuscript that has been accepted for publication. As a service to our customers we are providing this early version of the manuscript. The manuscript will undergo copyediting, typesetting, and review of the resulting proof before it is published in its final citable form. Please note that during the production process errors may be discovered which could affect the content, and all legal disclaimers that apply to the journal pertain.
References
- 1.Alonso A, et al. Recent use of oral contraceptives and the risk of multiple sclerosis. Arch.Neurol. 2005;62(9):1362–1365. doi: 10.1001/archneur.62.9.1362. [DOI] [PubMed] [Google Scholar]
- 2.Ascherio A, Munger KL. Environmental risk factors for multiple sclerosis. Part I: the role of infection. Ann.Neurol. 2007;61(4):288–299. doi: 10.1002/ana.21117. [DOI] [PubMed] [Google Scholar]
- 3.Barcellos LF, et al. Heterogeneity at the HLA-DRB1 locus and risk for multiple sclerosis. Hum Mol.Genet. 2006;15(18):2813–2824. doi: 10.1093/hmg/ddl223. [DOI] [PubMed] [Google Scholar]
- 4.Batchelor JR, Compston A, McDonald WI. The significance of the association between HLA and multiple sclerosis. Br Med Bull. 1978;34(3):279–284. doi: 10.1093/oxfordjournals.bmb.a071512. [DOI] [PubMed] [Google Scholar]
- 5.Bertrams J, Kuwert E. HL-A antigen frequencies in multiple sclerosis. Significant increase of HL-A3, HL-A10 and W5, and decrease of HL-A12. European Journal of Neurology. 1972;7(74):78. doi: 10.1159/000114414. [DOI] [PubMed] [Google Scholar]
- 6.Cantorna MT. Vitamin D and multiple sclerosis: an update. Nutr.Rev. 2008;66(10 Suppl 2):S135–S138. doi: 10.1111/j.1753-4887.2008.00097.x. [DOI] [PMC free article] [PubMed] [Google Scholar]
- 7.Chao MJ, et al. HLA class I alleles tag HLA-DRB1*1501 haplotypes for differential risk in multiple sclerosis susceptibility. Proc.Natl.Acad.Sci.U.S.A. 2008;105(35):13069–13074. doi: 10.1073/pnas.0801042105. [DOI] [PMC free article] [PubMed] [Google Scholar]
- 8.Compston A, Coles A. Multiple sclerosis. Lancet. 2002;359(9313):1221–1231. doi: 10.1016/S0140-6736(02)08220-X. [DOI] [PubMed] [Google Scholar]
- 9.Confavreux C, et al. Relapses and progression of disability in multiple sclerosis. N.Engl.J.Med. 2000;343(20):1430–1438. doi: 10.1056/NEJM200011163432001. [DOI] [PubMed] [Google Scholar]
- 10.Dyment DA, Ebers GC, Sadovnick AD. Genetics of multiple sclerosis. Lancet Neurol. 2004;3(2):104–110. doi: 10.1016/s1474-4422(03)00663-x. [DOI] [PubMed] [Google Scholar]
- 11.Ebers GC. Environmental factors and multiple sclerosis. Lancet Neurol. 2008;7(3):268–277. doi: 10.1016/S1474-4422(08)70042-5. [DOI] [PubMed] [Google Scholar]
- 12.Ebers GC, et al. A full genome search in multiple sclerosis. Nat.Genet. 1996;13(4):472–476. doi: 10.1038/ng0896-472. [DOI] [PubMed] [Google Scholar]
- 13.Goodkin DE, et al. Diagnostic criteria for multiple sclerosis research involving multiply affected families. Arch.Neurol. 1991;48(8):805–807. doi: 10.1001/archneur.1991.00530200041016. [DOI] [PubMed] [Google Scholar]
- 14.Gregory SG, et al. Interleukin 7 receptor alpha chain (IL7R) shows allelic and functional association with multiple sclerosis. Nat Genet. 2007 doi: 10.1038/ng2103. [DOI] [PubMed] [Google Scholar]
- 15.Haines JL, et al. The Multiple Sclerosis Genetics Group. A complete genomic screen for multiple sclerosis underscores a role for the major histocompatability complex. Nat.Genet. 1996;13(4):469–471. doi: 10.1038/ng0896-469. [DOI] [PubMed] [Google Scholar]
- 16.Haines JL, et al. The Multiple Sclerosis Genetics Group. Linkage of the MHC to familial multiple sclerosis suggests genetic heterogeneity. Hum Mol.Genet. 1998;7(8):1229–1234. doi: 10.1093/hmg/7.8.1229. [DOI] [PubMed] [Google Scholar]
- 17.Hauser MA, et al. Genomic convergence: identifying candidate genes for Parkinson's disease by combining serial analysis of gene expression and genetic linkage. Hum.Mol.Genet. 2003;12(6):671–677. [PubMed] [Google Scholar]
- 18.Hauser SL, Goodkin DE. Multiple Sclerosis and Other Demyelinating Diseases. In: Fauci A, et al., editors. Harrison's Principle of Internal Medicine. New York: McGraw Hill; 1998. pp. 2409–2419. [Google Scholar]
- 19.Hirschhorn JN, et al. A comprehensive review of genetic association studies. Genet.Med. 2002;4(2):45–61. doi: 10.1097/00125817-200203000-00002. [DOI] [PubMed] [Google Scholar]
- 20.International Multiple Sclerosis Genetics Consortium. A high-density screen for linkage in multiple sclerosis. Am J Hum Genet. 2005;77:454–467. doi: 10.1086/444547. [DOI] [PMC free article] [PubMed] [Google Scholar]
- 21.International Multiple Sclerosis Genetics Consortium. The expanding genetic overlap between multiple sclerosis and type I diabetes. Genes Immun. 2009;10(1):11–14. doi: 10.1038/gene.2008.83. [DOI] [PMC free article] [PubMed] [Google Scholar]
- 22.Kantarci O, Wingerchuk D. Epidemiology and natural history of multiple sclerosis: new insights. Curr.Opin.Neurol. 2006;19(3):248–254. doi: 10.1097/01.wco.0000227033.47458.82. [DOI] [PubMed] [Google Scholar]
- 23.Kenealy SJ, et al. A second-generation genomic screen for multiple sclerosis. Am.J.Hum.Genet. 2004;75(6):1070–1078. doi: 10.1086/426459. [DOI] [PMC free article] [PubMed] [Google Scholar]
- 24.Kenealy SJ, et al. Examination of seven candidate regions for multiple sclerosis: strong evidence of linkage to chromosome 1q44. Genes Immun. 2006;7(1):73–76. doi: 10.1038/sj.gene.6364275. [DOI] [PubMed] [Google Scholar]
- 25.Kuokkanen S, et al. Genomwide scan of multiple sclerosis Finnish multiplex families. Am J Hum Genet. 1997;61:1379–1387. doi: 10.1086/301637. [DOI] [PMC free article] [PubMed] [Google Scholar]
- 26.Kurtzke JF. Rating neurologic impairment in multiple sclerosis: an expanded disability status scale (EDSS) Neurology. 1983;33(11):1444–1452. doi: 10.1212/wnl.33.11.1444. [DOI] [PubMed] [Google Scholar]
- 27.Kutzelnigg A, et al. Cortical demyelination and diffuse white matter injury in multiple sclerosis. Brain. 2005;128(Pt 11):2705–2712. doi: 10.1093/brain/awh641. [DOI] [PubMed] [Google Scholar]
- 28.McDonald WI, et al. Recommended diagnostic criteria for multiple sclerosis: guidelines from the International Panel on the diagnosis of multiple sclerosis. Ann.Neurol. 2001;50(1):121–127. doi: 10.1002/ana.1032. [DOI] [PubMed] [Google Scholar]
- 29.Moore JH. The ubiquitous nature of epistasis in determining susceptibility to common human diseases. Hum.Hered. 2003;56(1–3):73–82. doi: 10.1159/000073735. [DOI] [PubMed] [Google Scholar]
- 30.Mumford GL, et al. The British Isles survey of multiple sclerosis in twins. Neurology. 1994;44(11):15. doi: 10.1212/wnl.44.1.11. [DOI] [PubMed] [Google Scholar]
- 31.Naito S, et al. Multiple sclerosis: association with HL-A3. Tissue Antigens. 1972;2(1):1–4. doi: 10.1111/j.1399-0039.1972.tb00111.x. [DOI] [PubMed] [Google Scholar]
- 32.Noseworthy JH, et al. Multiple sclerosis. N.Engl.J.Med. 2000;343(13):938–952. doi: 10.1056/NEJM200009283431307. [DOI] [PubMed] [Google Scholar]
- 33.Oksenberg JR, et al. The genetics of multiple sclerosis: SNPs to pathways to pathogenesis. Nat.Rev.Genet. 2008;9(7):516–526. doi: 10.1038/nrg2395. [DOI] [PubMed] [Google Scholar]
- 34.Oksenberg JR, Barcellos LF. Multiple sclerosis genetics: leaving no stone unturned. Genes Immun. 2005;6(5):375–387. doi: 10.1038/sj.gene.6364237. [DOI] [PubMed] [Google Scholar]
- 35.Poser CM, et al. New diagnostic criteria for multiple sclerosis: guidelines for research protocols. Ann.Neurol. 1983;13(3):227–231. doi: 10.1002/ana.410130302. [DOI] [PubMed] [Google Scholar]
- 36.Pritchard JK. Are rare variants responsible for susceptibility to complex diseases? Am.J.Hum.Genet. 2001;69(1):124–137. doi: 10.1086/321272. [DOI] [PMC free article] [PubMed] [Google Scholar]
- 37.Reich DE, Lander ES. On the allelic spectrum of human disease. Trends Genet. 2001;17(9):502–510. doi: 10.1016/s0168-9525(01)02410-6. [DOI] [PubMed] [Google Scholar]
- 38.Roxburgh RH, et al. Multiple Sclerosis Severity Score: using disability and disease duration to rate disease severity. Neurology. 2005;64(7):1144–1151. doi: 10.1212/01.WNL.0000156155.19270.F8. [DOI] [PubMed] [Google Scholar]
- 39.Sadovnick AD, et al. A population based study of multiple sclerosis in twins: update. Annal of Neurology. 1993;33:281–285. doi: 10.1002/ana.410330309. [DOI] [PubMed] [Google Scholar]
- 40.Sadovnick AD, Ebers GC. Genetics of multiple sclerosis. Neurologic Clinics. 1995;13:99–118. [PubMed] [Google Scholar]
- 41.Sawcer S. The complex genetics of multiple sclerosis: pitfalls and prospects. Brain. 2008 doi: 10.1093/brain/awn081. [DOI] [PMC free article] [PubMed] [Google Scholar]
- 42.Sawcer S, et al. A genome screen in multiple sclerosis reveals susceptibility loci on chromosome 6p21 and 17q22. Nature Genetics. 1996;13:464–468. doi: 10.1038/ng0896-464. [DOI] [PubMed] [Google Scholar]
- 43.Smith DJ, Lusis AJ. The allelic structure of common disease. Hum.Mol.Genet. 2002;11(20):2455–2461. doi: 10.1093/hmg/11.20.2455. [DOI] [PubMed] [Google Scholar]
- 44.Sundstrom P, Nystrom L, Hallmans G. Smoke exposure increases the risk for multiple sclerosis. Eur.J.Neurol. 2008;15(6):579–583. doi: 10.1111/j.1468-1331.2008.02122.x. [DOI] [PubMed] [Google Scholar]
- 45.Transatlantic Multiple Sclerosis Genetics Cooperative. A meta-analysis of genomic screens in multiple sclerosis. Mult.Scler. 2001;7(1):3–11. doi: 10.1177/135245850100700102. [DOI] [PubMed] [Google Scholar]
- 46.Trapp BD, Nave KA. Multiple sclerosis: an immune or neurodegenerative disorder? Annu.Rev.Neurosci. 2008;31:247–269. doi: 10.1146/annurev.neuro.30.051606.094313. [DOI] [PubMed] [Google Scholar]
- 47.Wang WY, et al. Genome-wide association studies: theoretical and practical concerns. Nat.Rev.Genet. 2005;6(2):109–118. doi: 10.1038/nrg1522. [DOI] [PubMed] [Google Scholar]
- 48.Yeo TW, et al. A second major histocompatibility complex susceptibility locus for multiple sclerosis. Ann.Neurol. 2007;61(3):228–236. doi: 10.1002/ana.21063. [DOI] [PMC free article] [PubMed] [Google Scholar]