

Abstract
Cultured cancer cells undergoing apoptosis show an increase in the NMR signal at a chemical shift of 1.3 ppm (-CH2-) corresponding to the so-called “mobile lipids” (ML) originating from the mobile acyl chains in triacylglycerides. A single NMR spectrum can provide an overview of the cellular metabolic changes caused by anticancer drugs providing qualitative and quantitative information on cellular metabolites. With this in mind, we studied the appearance of ML resonance in BT-20 and MCF-7 human breast cancer cells after their exposure to paclitaxel-loaded liposomes and polymeric micelles as a method to follow the apoptotic activity initiated by drug-loaded pharmaceutical nanocarriers.
BT-20 and MCF-7 cells were incubated with 1.5 μg/mL paclitaxel–loaded liposomes or micelles for 24, 48 and 72 hrs in DMEM medium. Empty liposomes and micelles and untreated cells were used as controls. The progression of apoptosis induced in cancer cells by drug-loaded nanocarriers was readily detectable by NMR with a markedly increased area of the ML peak at 1.3 ppm. The presence of liposome- and micelle-forming materials did not induce or interfere with the increase in ML signals. Thus, the use of NMR for the detection of ML as a marker of apoptosis can be successfully applied to the study of pharmacological effects of anti-cancer drugs loaded into pharmaceutical nanocarriers.
Keywords: Apoptosis, Mobile lipids, NMR, Paclitaxel, Liposomes, Micelles
Introduction
Several studies have reported that live cultured cancer cells exposed to anticancer drugs or to anti-Fas antibodies undergoing apoptosis1 and cells at certain stages of proliferation and cell cycle2 show an increase in the proton nuclear magnetic resonance (1H NMR) signal corresponding to the so-called mobile lipids (ML) represented mostly by triacylglycerides. This signal is attributed primarily to the methylene group (-CH2-) of fatty acyl chains1, 3, 4 at 1.3 ppm. ML apparently come from intracellular lipid bodies or membrane microdomains1 during the ongoing metabolic changes associated with programmed cell death1, 3. The increasing intensity observed for the methylene group suggested that 1H NMR might be both a qualitative and a quantitative4 tool for a noninvasive evaluation of apoptosis in cell cultures and in tissues. Thus, the ML NMR signal may serve as an indication of apoptosis in cells, including drug-treated cancer cells. Specifically, it may provide a more convenient assay for apoptosis than conventional biochemical techniques5-7, and provide a better understanding of the mechanism involved in the activity of the drugs, since this methodology can be used to differentiate apoptosis from cell necrosis8.
Given the increasing importance of lipid and polymeric drug delivery systems (DDS) in advanced nanomedicine9, 10, we investigated the feasibility of using the NMR detection of ML as an alternative and noninvasive screen to measure the pro-apoptotic activity of liposomes and polymeric micelles loaded with an anti-cancer drug. This method might prove useful for assessment of the pro-apoptotic activity of various drugs and drug-loaded delivery systems. We examined the NMR resonance of ML in two drug-treated human breast cancer cell lines, BT-20 and MCF-7. The BT-20 cells were treated with paclitaxel-loaded liposomes or control empty liposomes, while MCF-7 cells were treated with paclitaxel-loaded micelles based on a polyethylene glycol and phospatidylethanolamine (PEG-PE) conjugate or with control empty PEG-PE micelles. Paclitaxel (PCL) was selected as model drug since it is widely used as an anti-cancer drug that induces apoptosis by freezing the microtubule dynamics, which inhibits growth and cell cycle progression11. To quantify the level of ML expression, we used a new approach. In previous studies, the intensity of ML exposure was determined by the ratio between the intensity of signal from the fatty acyl chains -CH2- at 1.3 ppm and the lactate 4, 12 -CH3 at 0.9 ppm or lysine 1 -CH2- at 1.7 ppm. Instead, we measured the increase in ML by normalizing the signal intensity at 1.3 ppm to the average intensity of a broad region of the spectrum from 1.6 ppm to 4.7 ppm.
Using these lipid- and polymer-based drug-loaded nanocarriers we have demonstrated that: 1) the drug activity is not hidden or altered by the carrier, 2) drug-loaded liposomes and micelles are highly effective in inducing apoptosis in cancer cells, and 3) the delivery systems tested show no toxicity on their own.
Experimental Methods
Materials
1,2-Distearoyl-sn-glycero-3-phosphoethanolamine-N-[methoxy (polyethylene glycol)-2000] (PEG2k-PE), egg phosphatidylcholine (ePC) and cholesterol (CHOL) were purchased from Avanti Polar Lipids (Alabaster, AL, USA). Reagent grade paclitaxel (PCL) was purchased from Natural Pharmaceuticals (Beverly, MA, USA). Deuterium oxide was purchased from Cambridge Laboratories Inc. (Andover, MA, USA). Methanol (CH3OH), acetonitrile, chloroform (CHCl3) were purchased in analytical grade preparations from Fisher Scientific and used without further purification.
Cell culture
BT-20 and MCF-7 cancer cells were obtained from the ATCC (Manassas, VA, USA). and grown in a 10% fetal bovine serum (FBS) Dulbecco's Modified Eagle Medium (DMEM), at 37°C and 5% CO2. Trypsin, DMEM and supplements (penicillin, streptomycin and amphotericin B) and Trypan Blue Solution were from CellGro (Kansas City, MO, USA). FBS was purchased from Hyclone (Logan, Utah, USA).
Methods
Preparation of liposomes and micelles
For liposome preparation13, 14, a mixture of ePC and CHOL at a 7:3 molar ratio in chloroform, with or without the addition of 1% wt of PCL in methanol, was used. The organic solvents were removed by rotary evaporation and further dried for 4 hs by freeze-drying on a Freezone 4.5 (Labconco, Kansas City, MO). The lipid film obtained was hydrated to a lipid concentration of 2 mg/ml with PBS (phosphate buffered saline) pH 7.4 at room temperature and bath-sonicated for about 15 mins. The lipid dispersion was extruded 11 times through polycarbonate filters (pore size 200 nm) with a Micro Extruder (Avanti Lipids).
For micelle preparations 15, 16, a thin polymeric film of PEG2k-PE in chloroform with or without 1% wt of PCL in methanol was prepared by evaporation of the organic solvents. The film was further dried under high vacuum for 4 hs at -48 °C. To generate the spontaneous self-assembly of micelles, the dry polymeric film was hydrated at room temperature with PBS pH 7.4 at a concentration of 10 mg of micelle-forming material per 1 mL of PBS. The hydrated mixture was vigorously vortexed for 5 min. The PCL not incorporated was removed by filtration of the micelle suspension through a 0.2 μm nylon membrane (Millipore Co., Bedford, MA).
Liposome and micelle characterization: drug loading, zeta potential, and size
The amount of PCL incorporated into liposomal and micellar formulations was determined with a reversed phase HPLC (D-7000 HPLC system, Hitachi, Japan) using an XBridge column (4.6 mm × 250 mm, Waters Co., Milford, MA). A known amount of both formulations was solubilized with acetonitrile to release free PCL and then analyzed with acetonitrile:water (52:48% v/v) as the mobile phase at a 1.0 mL/min flow rate with the detection at 227 nm (the absorbance wavelength of paclitaxel). Each run was done in triplicate. The PCL loading was determined using a calibration curve obtained under the same conditions using standard concentrations of PCL in acetonitrile ranging from 0.2 to 30.25 μg/mL.
For both formulations, size and size distribution were analyzed by dynamic light scattering (DLS) using a Zeta Plus Instrument (Brookhaven Instrument Co., Holtsville, NY). Their zeta-potential (ζ) was measured by Zeta Phase Analysis Light Scattering (PALS) with an ultrasensitive zeta potential analyzer (Brookhaven Instruments, Holtsville, NY). Liposome and micelle suspensions were diluted in deionized water or in 1 mM potassium chloride (KCl) to be analyzed for size distribution and ζ respectively. All measurements were performed in triplicate.
Morphology by TEM analysis
Morphology for PCL-loaded micelles and liposomes was additionally analyzed by transmission electron microscopy (TEM). Micelles and liposomes were analyzed at 10 mg/ml concentration, and 1.5% of PTA (phosphotungstic acid) negative stain. The samples were placed on a circular grid and examined with a JEOL JEM-1010 electron microscope (JEOL USA, Inc, Peabody, MA).
Cell culture treatments
BT-20 and MCF-7 human breast cancer cells were grown in 10% FBS containing DMEM up to 80% confluence. In order to compensate for possible death loss in untreated and control cell cultures due to overgrowing, different amounts were seeded in 150×25mm Petri dishes (Corning, NY) and allowed to adhere overnight. 8×10⁶, 3×10⁶, and 1.5×10⁶ cells/dish in 20 ml of medium were seeded respectively for the 24, 48 and 72 hs treatment with empty liposomes, or micelles or untreated control cells. For the 1.5 μg PCL/ml of medium for both liposomes and micelles, 8×10⁶ cells/dish in 20 ml of medium were seeded for all the three time-points. BT-20 cells were treated with drug-loaded and empty liposomes, while MCF-7 cells were treated with drug-loaded and empty micelles. After the appropriate incubation time, the medium was removed, the cells were washed once with 1 ml of trypsin solution, and detached from the plate with an additional 2 ml of trypsin solution. Cells were pelleted, washed three times with sterile deuterated PBS pH 7.4 to remove any traces of the medium and H2O, that might potentially interfere with the NMR analysis and finally resuspended in 1 ml of deuterated PBS pH 7.4 and stored on ice until transfer into a glass NMR tube immediately prior to analysis 17.
1D NMR: detection of ML
The pellets of BT-20 and MCF-7 cells (2-5×10⁷ cells) in sterile deuterated buffer were triturated with a Pasteur pipet and transferred into 5 mm NMR tubes. Cell viability was determined before and after NMR analysis by trypan blue exclusion18. 1H NMR spectra were acquired on a 500 MHz Varian Inova NMR spectrometer at room temperature using a 60-degree pulse, 10,000 Hz spectrum width, acquiring 32 k points (1.8-acquisition time). The residual water signal was suppressed by presaturation during the 2 sec relaxation delay. 160 scans (10 minutes) were sufficient to obtain a good signal-to-noise ratio. Mobile lipid intensity (corresponding to -CH2-) was determined as the area above the line drawn between the minima in the spectrum closest to 1.1 and 1.6 ppm and measured with software integration. The area of the ML peak was normalized to the integral of a wide region of the spectrum (from 1.6 to 4.7 ppm), again as the area above a line between the minima at these endpoints. The resonance intensity of this wide area was used as the internal concentration reference used to normalize mobile lipid intensity.
2D NMR: 1H TOCSY
BT-20 cells treated with PCL-loaded liposomes were further analyzed with homonuclear total correlation spectroscopy (1H TOCSY). Approximately 5×10⁶ cells were suspended in 80 μL of D2O PBS and loaded into a 2 mm NMR tube. From four-to-ten times fewer BT-20 cells were used than for the 1D NMR. The thinner tube enhances signal because it has less skin effect. The TOCSY was acquired phase-sensitive, 2×256 increments of 48 scans (6 hours) on the 500 MHz Varian Inova NMR spectrometer at room temperature.
Results
Drug loading, size distribution, zeta potential (ζ) and morphology of liposomes and micelles
The drug loading was evaluated by HPLC as described in Methods. The loading efficiency (PCL loaded amount/total PCL amount) was ca. 73 % wt for liposomes and ca. 93% wt for micelles.
Liposome and micelle nanoformulations (both empty and drug-loaded) were characterized by measuring size, size distribution and the ζ value. The PCL-loaded liposomes showed a slightly increased mean diameter (around 140 nm) versus the empty ones (123 nm) due to the drug incorporation into the lipid bilayer. The values of ζ were comparable (Figure 1 and Figure 2). Empty and PCL-loaded micelles were also diluted for optimal reading and analyzed for their size and size distribution. The mean size was 9.3 and 13.3 nm for empty and loaded micelles, respectively (Figure 1). As with liposomes, there were no significant differences in ζ value between empty and drug-loaded micelles (Figure 2). Drug-loaded nanocarriers were analyzed by TEM to show their morphology (Figure 3). In both cases, their shape appeared to be regular and rounded.
Figure 1.
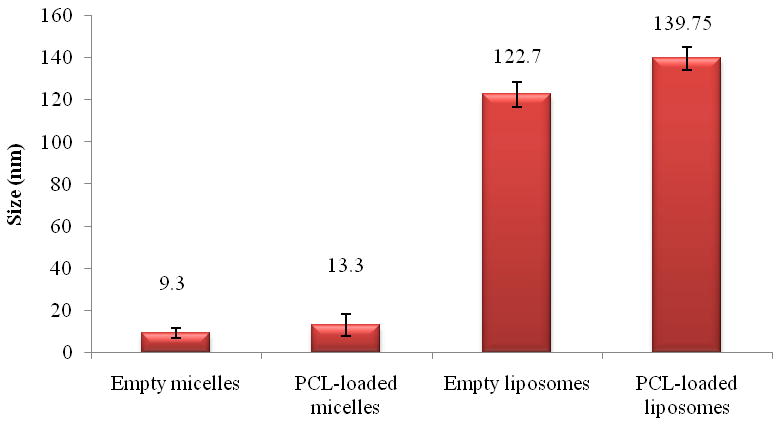
Size of micellar and liposomal preparations (SD± nm).
Figure 2.
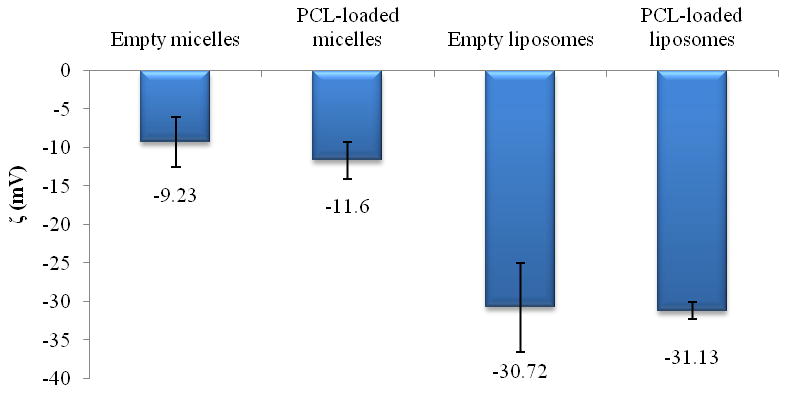
Zeta potential of micellar and liposomal preparations (SD ±mV).
Figure 3.
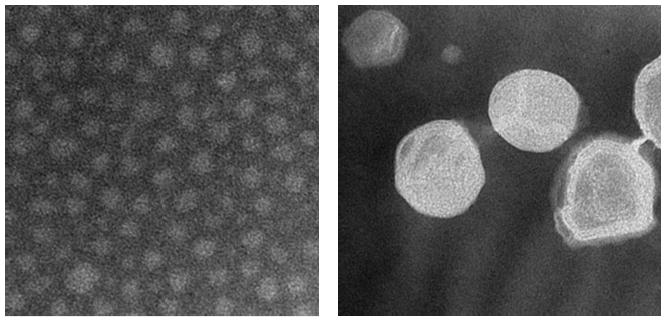
TEM analysis: morphology of drug-loaded micelles (right panel) and liposomes (left panel).
1D NMR: detection of ML
NMR spectra provides a qualitative and quantitative evaluation of the appearance of ML. For these time-dependent experiments, in order to avoid cell death due to overgrowing, a lower number of cells were seeded for the untreated control and empty liposome-treated sample compared to the drug-loaded carriers (as described in “Methods” section).
The -CH2- signal intensity of fatty acyl chains of ML was quantified for PCL-loaded liposome-treated BT-20 cells and PCL-loaded micelle-treated MCF-7 cells. The resulting analysis revealed a significant increase in the intensity of the signal related to the ML (-CH2-, 1.3 ppm) in cells treated with PCL-loaded nanocarriers, while for empty liposomes and micelles the signal remained unchanged for 3 days of observation time. The same was true for the untreated control cells. Figures 4 and 5 show the time-dependent appearance of ML in cells treated with PCL-loaded and empty liposomes or micelles and in untreated cells. Similar trends were clearly seen for BT-20 cells treated with liposomal preparations and for MCF-7 treated with micellar preparations.
Figure 4.
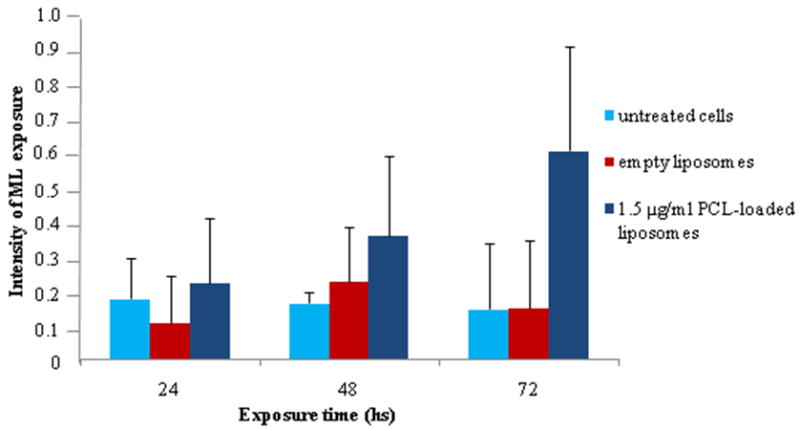
Appearance of ML in the BT-20 breast cancer cell line after 24, 48 and 72 h incubation with PCL-loaded liposomes, empty liposomes, and control.
Figure 5.
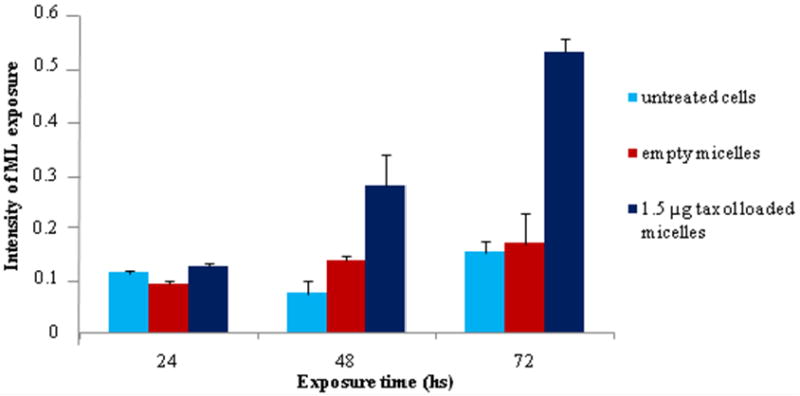
Appearance of the ML in MCF -7 breast cancer cell line after 24, 48 and 72 h incubation with PCL-loaded micelles, empty micelles, and control.
The progression of apoptosis induced with the drug-loaded formulations shown in Figure 6 shows a tendency in the programmed cell death (PCD) over time. The pattern was similar with both PCL-loaded formulations. PCL-loaded liposomes and micelles resulted in twice the cytotoxicity after a 72 h incubation compared to the 48 h. Such data are significant for further understanding the mechanism of PCD driven by these drug-loaded nanopreparations.
Figure 6.
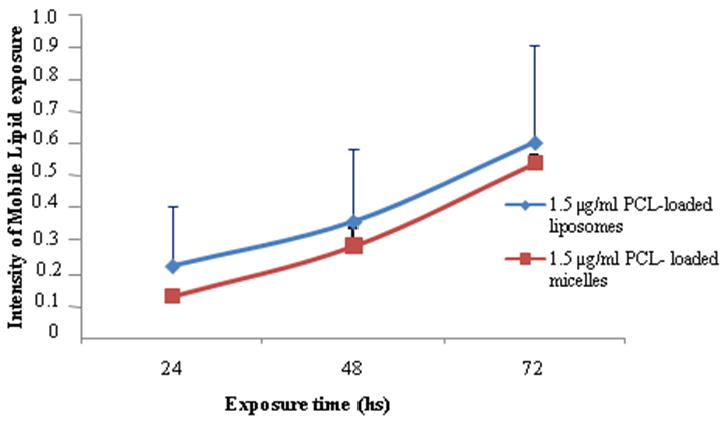
Apoptotis progression in BT-20 cells treated with PCL-loaded liposomes (1.5 μg PCL/ml), and in MCF-7 cells treated with PCL-loaded micelles (1.5 μg PCL/ml).
In the cells treated with PCL-loaded nanocarriers, the methylene peak intensity corresponding to ML steadily and significantly increased over the 72 h of treatment (Figure 7), while no significant changes in this peak were observed for the cells treated with empty liposomes (Figure 8). Very similar result was obtained in the case of cell treatment with drug-loaded and drug-free micelles (data not shown). Cells treated with PCL-liposomes showed a slight increase in the -CH3 lactate peak, which is due to the presence of ML themselves (Figure 7), and not because of any independent metabolites as confirmed by two-dimensional NMR (see next the paragraph).
Figure 7.
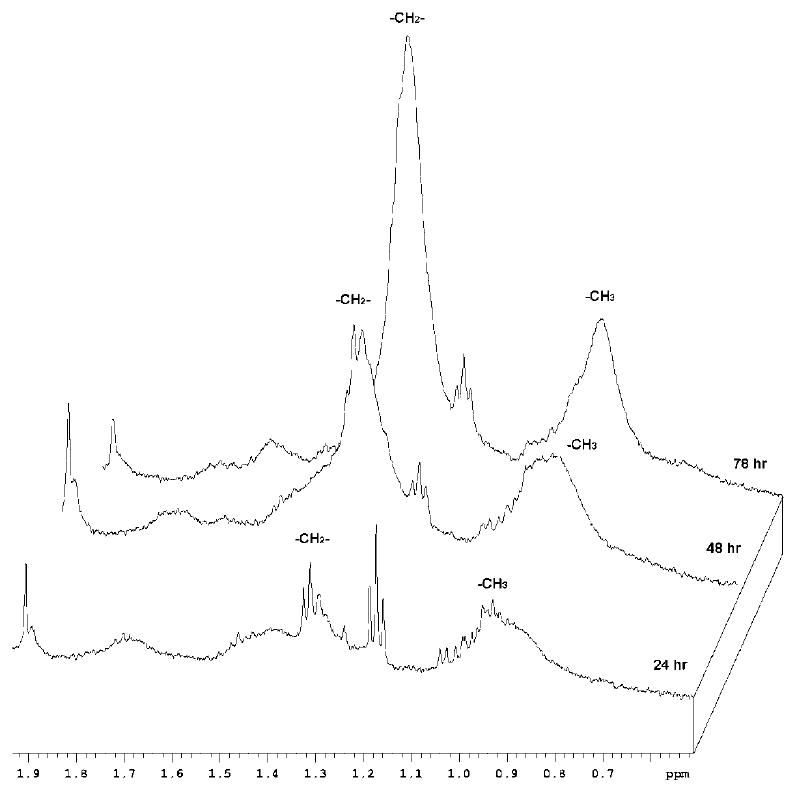
1H NMR spectra in PBS/D2O (500 MHz) for PCL-loaded liposome-treated BT-20 cells. Notice a clear increase in the ML peak intensity (indicative of apoptosis) at 1.3 ppm over a 72 h incubation time.
Figure 8.
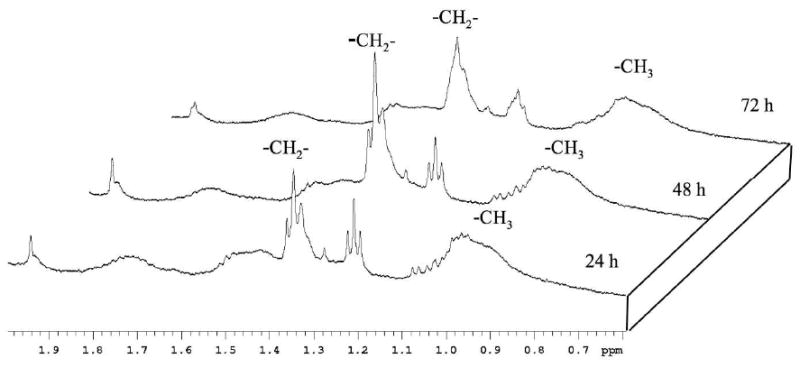
1H NMR spectra in PBS/D2O (500 MHz) for empty liposome-treated BT-20 cell. No significant increase in the ML signal occurs even after a 72 hour incubation time.
2D NMR: 1H TOCSY
NMR spectra were acquired using cultures grown to 2-5×10⁷ cells7, 12, 18, 19. Reducing the number is necessary to be competitive with other apoptosis assays. Approximately 5×10⁶ cells were grown and collected from the dishes of half the size. They provided an ample NMR signal to determine ML in 10 minutes and, further, to acquire a 2D 1H TOCSY in a few hours.
Many metabolites have aliphatic -CH3 resonances. A 2D 1H TOCSY spectrum was acquired to confirm that the increased -CH3 intensity we observed in 1D NMR was due to the ML, not to an increase in some unrelated metabolite. The TOCSY (Figure 9) confirms the expected strong cross-peaks between the ML (-CH2-) signal at 1.2 ppm and the increasing -CH3 signal at 0.8 ppm, independent of a minor -CH3 signal at 0.9 ppm, which did not change significantly with the increase in ML.
Figure 9.
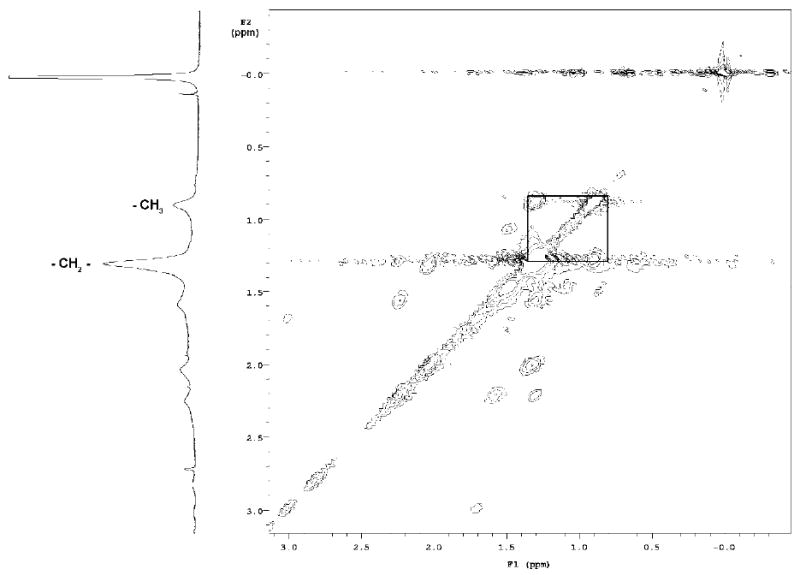
1H NMR:TOCSY. BT-20 cells. The signals of (-CH2-) and -CH3 of ML and corresponding cross peaks are highlighted.
Discussion
Pharmaceutical nanocarriers are represented mostly by lipid-based and polymeric biodegradable nanosystems like liposomes and micelles. These drug-loaded nanocarriers are of great interest because of their increasing presence in clinical practice and their numerous advantages with respect to the classic drug administration pathways 15, 16, 20-22,23, 24. All the advantages of the liposomal and micellar preparations made them excellent candidates for anticancer therapy. Thus, it is of great importance to assess the feasibility of application of noninvasive techniques to follow their anticancer power, efficiency, and progression efficacy.
When cells undergo apoptosis, they change metabolically and morphologically. The change in ML, which is detectable by 1H NMR, was studied previously only for free apoptosis-inducing drugs. Our data indicate that the onset of apoptosis is associated with a large increase in NMR methylene resonance intensity after treatment with drug-loaded liposomes or micelles. This effect was observed in two different human breast cancer cell lines, BT-20 and MCF-7, treated with PCL-loaded formulations. The signal intensity of the methylene NMR resonance remained low and essentially constant for cells treated with the empty liposomes or micelles (as shown in Figures 4, 5 and 8). This confirms that the increase in the ML occurs only on exposure to drug-loaded nanocarrier formulations (Figures 4, 5 and 7), is clearly associated with apoptosis, and is independent of the means used to induce the PCD. Thus, this NMR methodology could be successfully applied to study the pharmacological effects mediated by anticancer drugs loaded into pharmaceutical nanocarriers. The data also show the method allows for the determination of the quantitative relationship between the degree of apoptosis induced by drug-loaded DDS and the methylene resonance signal intensity. Additionally, in the previous study with free PCL as anti-cancer drug1, it was also shown that the increase in ML signal intensity correlates with the increase in the number of apoptotic cells.
Thus, the increased signal intensity we detected using PCL loaded into nanocarriers demonstrates that drug activity is not hidden or altered by the carrier, and drug-loaded liposomes and micelles effectively induce the apoptosis in cancer cells. Additionally, we were able to follow the progression of apoptosis in cells treated with drug-loaded pharmaceutical nanocarriers.
We have used a new approach to monitor the fatty acyl chain signal intensity. To quantify the increase in ML, we normalized the signal intensity of the methylene group at 1.3 ppm to the integral of a wide region of the spectrum (from 1.6 to 4.7 ppm). Previous studies have variously normalized the ML lipids based on the evaluation of the -CH2-/-CH34, 25 or -CH2/lysine ratios1. Our approach appears to be more indicative of the apoptosis than the previous ones, since the overall intensity of many metabolites (as measured by the broad integral) is a fairer indication of the number of cells and their metabolic status compared to a single specific spectral feature.
Thus, NMR as a methodology for following drug-induced cell apoptosis appeared to be a useful alternative to some other techniques such as fluorescence-activated cell sorting (FACS) or TUNEL test.
Conclusion
The level of apoptosis induced in cancer cells by drug-loaded pharmaceutical nanocarriers, such as liposomes and micelles, can be detected by NMR by following the increase in the area of the peak at 1.3 ppm indicative of the mobile lipids. The presence of liposome- and micelle-forming material did not interfere with the ML signal. Thus, the use of NMR for the detection of ML can be successfully applied to the study of pharmacological effects of anti-cancer drugs loaded into pharmaceutical nanocarriers.
Acknowledgments
This work was supported by the NIH grant #R01 CA128486 to Vladimir P. Torchilin
Abbreviations
- DDS
drug delivery systems
- PCL
paclitaxel
- ML
mobile lipids
- PEG2k-PE
1,2-distearoyl-sn-glycero-3-phosphoethanolamine-N-[methoxy (polyethylene glycol)-2000])
- ePC
egg phosphatidylcholine
- CHOL
cholesterol
- FBS
fetal bovine serum
- DMEM
Dulbecco's Modified Eagle Medium
- PCD
programmed cell death
References
- 1.Brisdelli F, Iorio E, Knijn A, Ferretti A, Marcheggiani D, Lenti L, Strom R, Podo F, Bozzi A. Two-step formation of 1H NMR visible mobile lipids during apoptosis of paclitaxel-treated K562 cells. Biochem Pharmacol. 2003;65:1271–80. doi: 10.1016/s0006-2952(03)00080-7. [DOI] [PubMed] [Google Scholar]
- 2.Rosi A, Grande S, Luciani AM, Barone P, Mlynarik V, Viti V, Guidoni L. (1H) MRS studies of signals from mobile lipids and from lipid metabolites: comparison of the behavior in cultured tumor cells and in spheroids. NMR Biomed. 2004;17:76–91. doi: 10.1002/nbm.867. [DOI] [PubMed] [Google Scholar]
- 3.Hakumaki JM, Kauppinen RA. 1H NMR visible lipids in the life and death of cells. Trends Biochem Sci. 2000;25:357–62. doi: 10.1016/s0968-0004(00)01614-5. [DOI] [PubMed] [Google Scholar]
- 4.Shih CM, Ko WC, Yang LY, Lin CJ, Wu JS, Lo TY, Wang SH, Chen CT. Detection of apoptosis and necrosis in normal human lung cells using 1H NMR spectroscopy. Ann N Y Acad Sci. 2005;1042:488–96. doi: 10.1196/annals.1338.042. [DOI] [PubMed] [Google Scholar]
- 5.Hakumaki JM, Brindle KM. Techniques: Visualizing apoptosis using nuclear magnetic resonance. Trends Pharmacol Sci. 2003;24:146–9. doi: 10.1016/S0165-6147(03)00032-4. [DOI] [PubMed] [Google Scholar]
- 6.Hakumaki JM, Poptani H, Sandmair AM, Yla-Herttuala S, Kauppinen RA. 1H MRS detects polyunsaturated fatty acid accumulation during gene therapy of glioma: implications for the in vivo detection of apoptosis. Nat Med. 1999;5:1323–7. doi: 10.1038/15279. [DOI] [PubMed] [Google Scholar]
- 7.Rainaldi G, Romano R, Indovina P, Ferrante A, Motta A, Indovina PL, Santini MT. Metabolomics using 1H-NMR of apoptosis and Necrosis in HL60 leukemia cells: differences between the two types of cell death and independence from the stimulus of apoptosis used. Radiat Res. 2008;169:170–80. doi: 10.1667/RR0958.1. [DOI] [PubMed] [Google Scholar]
- 8.Bezabeh T, Mowat MR, Jarolim L, Greenberg AH, Smith IC. Detection of drug-induced apoptosis and necrosis in human cervical carcinoma cells using 1H NMR spectroscopy. Cell Death Differ. 2001;8:219–24. doi: 10.1038/sj.cdd.4400802. [DOI] [PubMed] [Google Scholar]
- 9.ElBayoumi TA, Torchilin VP. Tumor-targeted nanomedicines: enhanced antitumor efficacy in vivo of doxorubicin-loaded, long-circulating liposomes modified with cancer-specific monoclonal antibody. Clin Cancer Res. 2009;15:1973–80. doi: 10.1158/1078-0432.CCR-08-2392. [DOI] [PMC free article] [PubMed] [Google Scholar]
- 10.Torchilin V. Multifunctional and stimuli-sensitive pharmaceutical nanocarriers. Eur J Pharm Biopharm. 2009;71:431–44. doi: 10.1016/j.ejpb.2008.09.026. [DOI] [PMC free article] [PubMed] [Google Scholar]
- 11.Wang TH, Wang HS, Soong YK. Paclitaxel-induced cell death: where the cell cycle and apoptosis come together. Cancer. 2000;88:2619–28. doi: 10.1002/1097-0142(20000601)88:11<2619::aid-cncr26>3.0.co;2-j. [DOI] [PubMed] [Google Scholar]
- 12.Blankenberg FG, Katsikis PD, Storrs RW, Beaulieu C, Spielman D, Chen JY, Naumovski L, Tait JF. Quantitative analysis of apoptotic cell death using proton nuclear magnetic resonance spectroscopy. Blood. 1997;89:3778–86. [PubMed] [Google Scholar]
- 13.Pappalardo JS, Quattrocchi V, Langellotti C, Di Giacomo S, Gnazzo V, Olivera V, Calamante G, Zamorano PI, Levchenko TS, Torchilin VP. Improved transfection of spleen-derived antigen-presenting cells in culture using TATp-liposomes. J Control Release. 2009;134:41–6. doi: 10.1016/j.jconrel.2008.11.006. [DOI] [PubMed] [Google Scholar]
- 14.Sawant RM, Hurley JP, Salmaso S, Kale A, Tolcheva E, Levchenko TS, Torchilin VP. “SMART” drug delivery systems: double-targeted pH-responsive pharmaceutical nanocarriers. Bioconjug Chem. 2006;17:943–9. doi: 10.1021/bc060080h. [DOI] [PMC free article] [PubMed] [Google Scholar]
- 15.Musacchio T, Laquintana V, Latrofa A, Trapani G, Torchilin VP. PEG-PE Micelles Loaded with Paclitaxel and Surface-Modified by a PBR-Ligand: Synergistic Anticancer Effect. Mol Pharm. 2008 doi: 10.1021/mp800158c. in press. [DOI] [PMC free article] [PubMed] [Google Scholar]
- 16.Torchilin VP, Lukyanov AN, Gao Z, Papahadjopoulos-Sternberg B. Immunomicelles: targeted pharmaceutical carriers for poorly soluble drugs. Proc Natl Acad Sci U S A. 2003;100:6039–44. doi: 10.1073/pnas.0931428100. [DOI] [PMC free article] [PubMed] [Google Scholar]
- 17.Blankenberg FG, Storrs RW, Naumovski L, Goralski T, Spielman D. Detection of apoptotic cell death by proton nuclear magnetic resonance spectroscopy. Blood. 1996;87:1951–6. [PubMed] [Google Scholar]
- 18.Ferretti A, Knijn A, Iorio E, Pulciani S, Giambenedetti M, Molinari A, Meschini S, Stringaro A, Calcabrini A, Freitas I, Strom R, Arancia G, Podo F. Biophysical and structural characterization of 1H-NMR-detectable mobile lipid domains in NIH-3T3 fibroblasts. Biochim Biophys Acta. 1999;1438:329–48. doi: 10.1016/s1388-1981(99)00071-2. [DOI] [PubMed] [Google Scholar]
- 19.Barba I, Cabanas ME, Arus C. The relationship between nuclear magnetic resonance-visible lipids, lipid droplets, and cell proliferation in cultured C6 cells. Cancer Res. 1999;59:1861–8. [PubMed] [Google Scholar]
- 20.Chang DK, Chiu CY, Kuo SY, Lin WC, Lo A, Wang YP, Li PC, Wu HC. Antiangiogenic targeting liposomes increase therapeutic efficacy for solid tumors. J Biol Chem. 2009;284:12905–16. doi: 10.1074/jbc.M900280200. [DOI] [PMC free article] [PubMed] [Google Scholar]
- 21.Jayanna PK, Torchilin VP, Petrenko VA. Liposomes targeted by fusion phage proteins. Nanomedicine. 2009;5:83–9. doi: 10.1016/j.nano.2008.07.006. [DOI] [PMC free article] [PubMed] [Google Scholar]
- 22.Li X, Ding L, Xu Y, Wang Y, Ping Q. Targeted delivery of doxorubicin using stealth liposomes modified with transferrin. Int J Pharm. 2009;373:116–23. doi: 10.1016/j.ijpharm.2009.01.023. [DOI] [PubMed] [Google Scholar]
- 23.Yuan F, Leunig M, Huang SK, Berk DA, Papahadjopoulos D, Jain RK. Microvascular permeability and interstitial penetration of sterically stabilized (stealth) liposomes in a human tumor xenograft. Cancer Res. 1994;54:3352–6. [PubMed] [Google Scholar]
- 24.Maeda H, Sawa T, Konno T. Mechanism of tumor-targeted delivery of macromolecular drugs, including the EPR effect in solid tumor and clinical overview of the prototype polymeric drug SMANCS. J Control Release. 2001;74:47–61. doi: 10.1016/s0168-3659(01)00309-1. [DOI] [PubMed] [Google Scholar]
- 25.Al-Saffar NM TJ, Robertson D, Clarke PA, Jackson LE, Leach MO, Ronen SM. Apoptosis is associated with triacylglycerol accumulation in Jurkat T-cells. British Journal of Cancer. 2002;86:963–70. doi: 10.1038/sj.bjc.6600188. [DOI] [PMC free article] [PubMed] [Google Scholar]