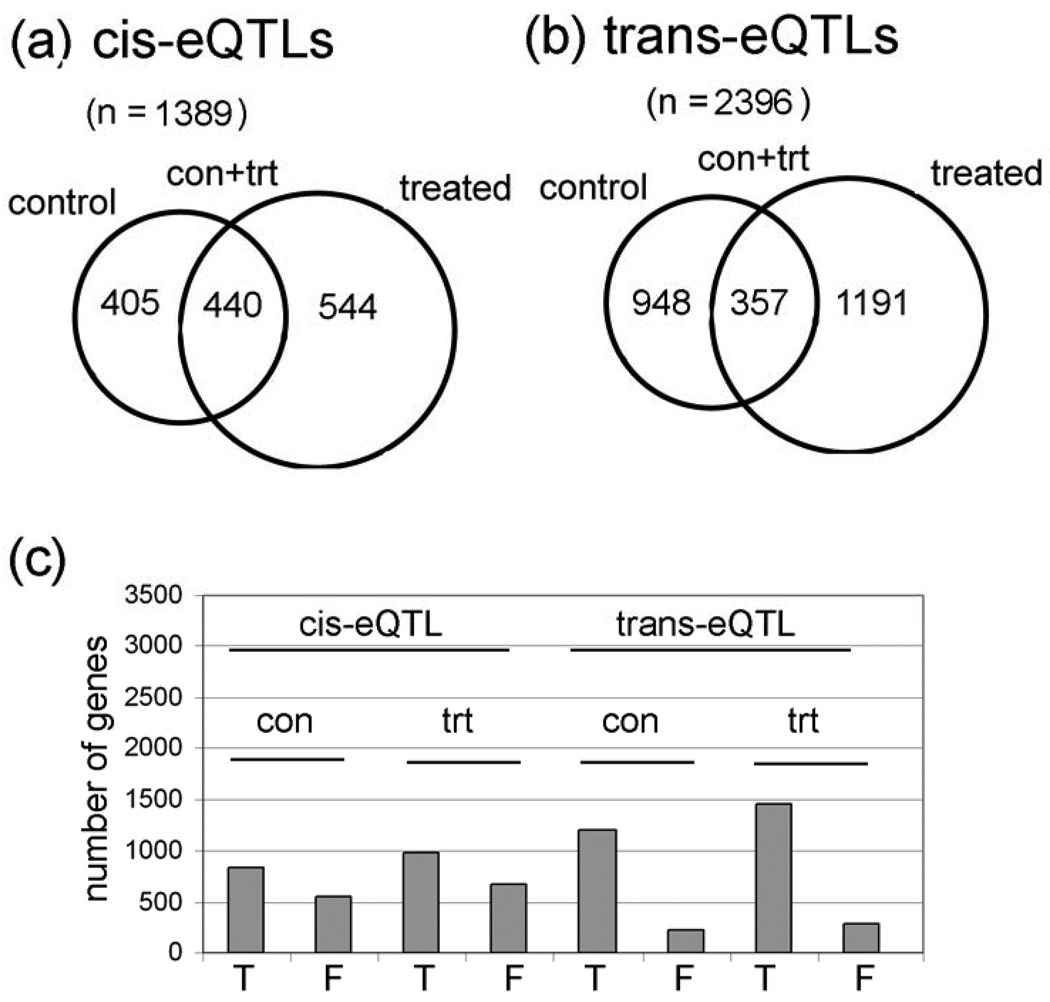
Figure 1. Control and lead-treated cis-eQTLs and trans-eQTLs.
(a) Venn diagrams of numbers of genes with cis-eQTLs and (b) trans-eQTLs in each category (con only, con + trt only, and treated only). Detailed information is in Supplementary Table S2 and Supplementary Table S3. c, Graph of the number of true (T) and false (F) cis-eQTL based on outlier analyses of the 14 probes in each of the 18,000 Affymetrix probesets. Notice that cis-eQTL have a higher percentage of false eQTL than do trans-eQTL.

