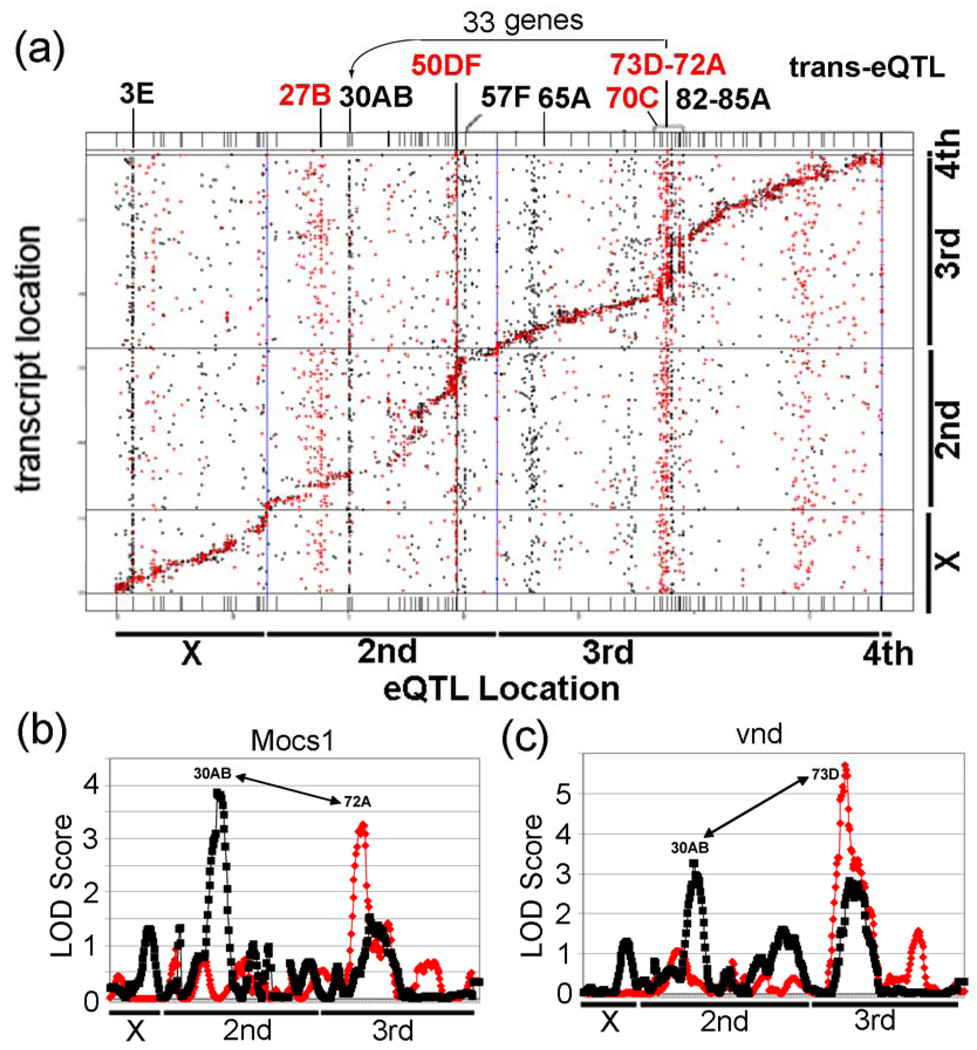
Figure 3. Results of a genetical genomics study of control and lead-treated from 75 RIL Drosophila lines.
(a) Locations of the eQTLs are represented on the x-axis and locations of transcripts (based on their chromosomal locations) are represented on the y-axis. eQTL locations for cis regulated genes every 5 cM are present along the diagonal. Notice the control trans-eQTL transbands at 27B, 50DF, 70C, and 73D–72A. Also, notice the lead induced transbands at 3E, 30AB, 57F, 65A, and 82D–85A. The genetic and physical maps of the lines are not perfectly aligned along the diagonal, due to regions with greatly reduced recombination in certain regions (bands 50–57 and 75–85) in the RILs compared to traditional crosses. It is not clear why these regions had reduced recombination. (b) Graphs of eQTL analysis of Mocs1, which is co-regulated by trans-eQTL at 30AB and 72A, and (c) vnd, which is co-regulated by trans-eQTL at 30AB and 73D. The LOD Score is the log of the probability distribution, as described in the Materials and Methods. Red, eQTL of genes from control flies. Black, eQTL of genes from lead-treated flies.

