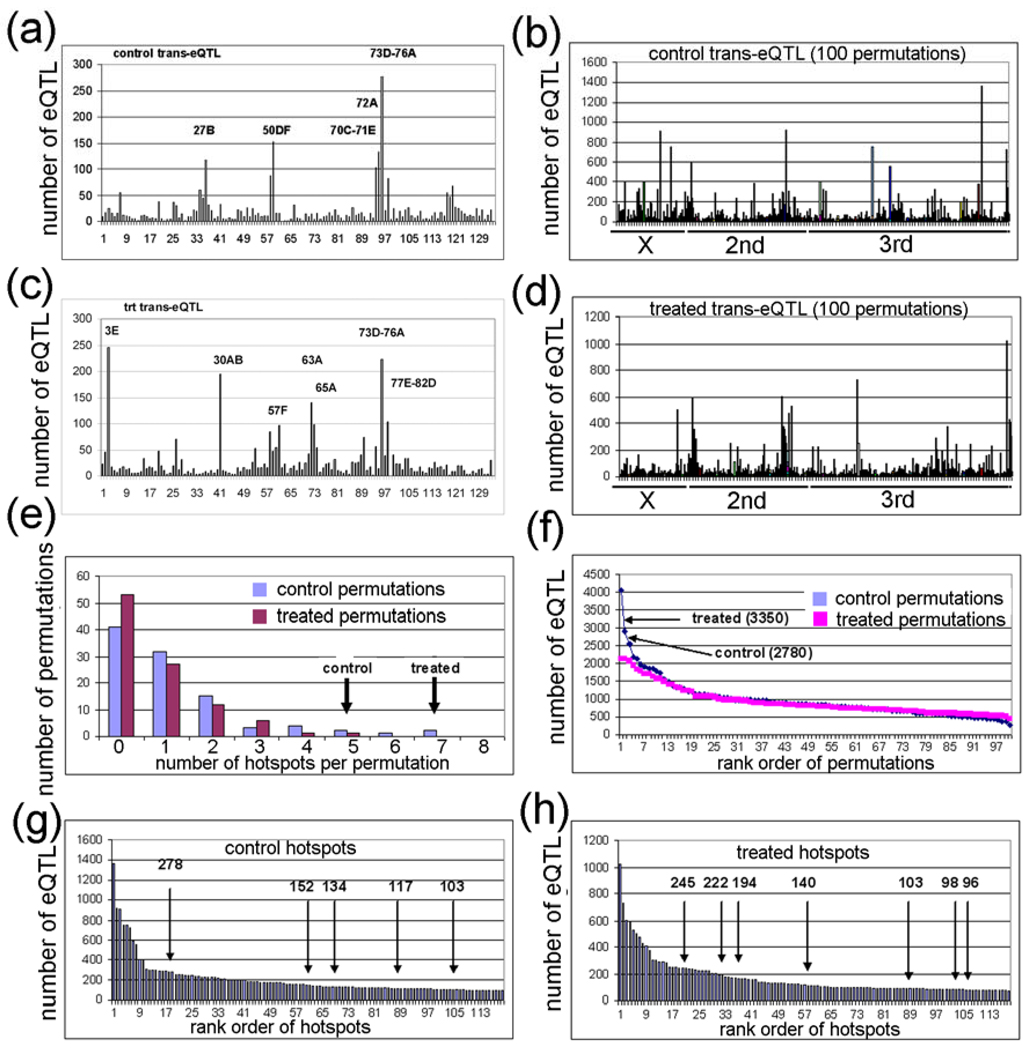
Figure 4. Permutation analysis of control and treated eQTL data.
(a,c) Plot of control and treated eQTL data showing genome location (x-axis) and the number of eQTL (y-axis). The 5 control and 7 treated eQTL transbands are indicated. (b,d) Plot of 100 control and 100 treated permutation analyses in which the RIL labels were randomized. (e) Plot of the number of transbands per permutation (x-axis) and the number of permutations with the corresponding number of transbands (y-axis). The experimental control and treated transband numbers are indicated (arrows). (f) Plot of the rank order of permutations (x-axis) versus the number of eQTL in the transband (y-axis). The number of eQTL in the control and treated transbands from the experimental data are indicated (arrows). (g,h) Plot of rank order of transbands (x-axis) versus the number of eQTL in the corresponding transband (y-axis). The control and treated transbands are indicated (arrows).

