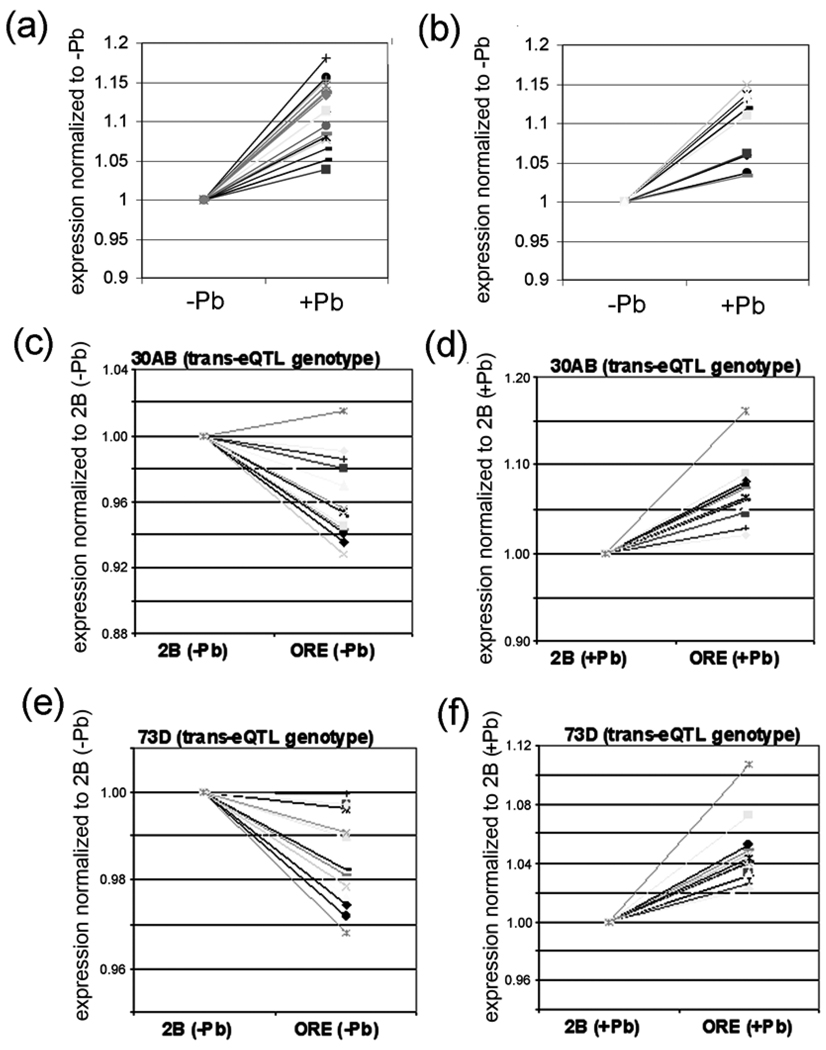
Figure 6. Effect of lead on the expression of genes co-regulated by 30AB and 73D.
(a) All 19 genes that are co-regulated by 72A and 30AB show an increase in expression after lead exposure. (b) All 14 genes co-regulated by 73D and 30AB also show an increase in expression after lead exposure. The data in a and b is from the mean expression levels from the 75 RILs in the absence of lead and the mean levels from the 75 RILs in the presence of lead. (c–f) Effects of genotype and environment on the 14 genes co-regulated by the transbands located 30AB and 73D. The relative expression of the 14 genes with the indicated transband genotype was normalized to 1 and the effect of changing the hotpot genotype is shown. Notice that relative expression decreases slightly (except for one gene) in the absence of lead but increases in the presence of lead when the transband genotype changes from 2B to ORE. A similar pattern is seen for all 19 genes that are co-regulated by the transbands located at 72A and 30AB (Supplementary Table S4).

