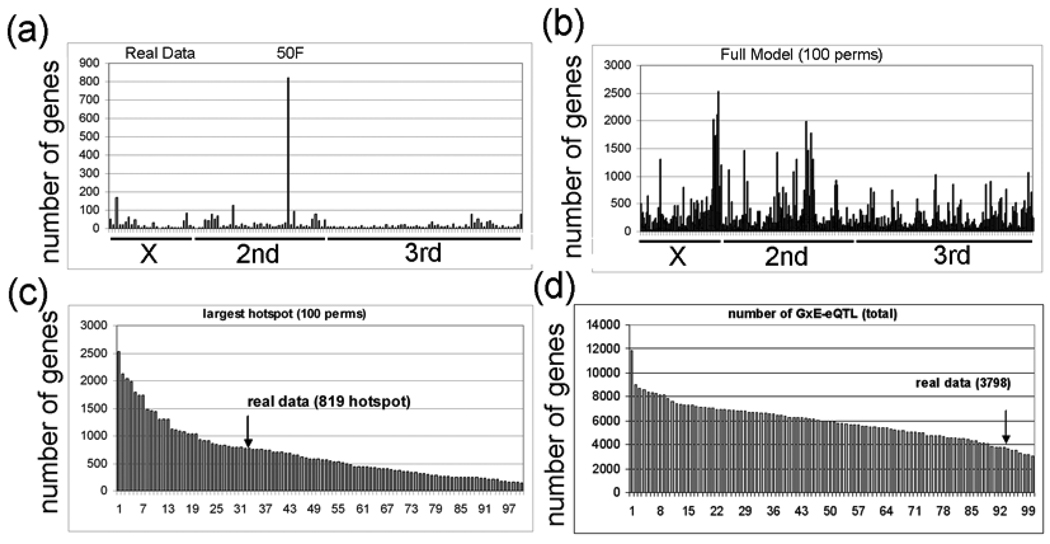
Figure 8. Permutation analysis of the GxE-eQTL data.
a, The experimental GxE-eQTL data are plotted with eQTL location (x-axis) and number of probesets with eQTL at the corresponding location (y-axis) (intensity = G + E + GXE + error). The hotspot with 812 probesets at 50DF is indicated (50F). b, The GxE-eQTL results of 100 permutations is plotted (intensity = G + E + GXE + error). c, The rank order of GxE-eQTL hotspots (x-axis) in the 100 permutations is plotted versus the number of genes with eQTL in the largest transband (y-axis). The experimental data (real data) has 819 probesets in the largest transband. d, The rank order of the number of GxE-eQTL in the 100 permutations is plotted. Notice that most (94%) of the permutations have larger transbands than the experimental data (arrow).

