

Abstract
Human serum albumin (HSA)-coated liposomal formulations were synthesized and evaluated for the delivery of antisense oligodeoxyribonucleotide (ODN) G3139 in KB human oral carcinoma cells. Liposomes composed of dimethyldioctadecyl ammonium bromide/egg phosphatidylcholine/α-tocopheryl polyethylene glycol 1000 succinate (58:40:2 molar ratio) complexed with G3139 and coated with HSA were investigated for Bcl-2 down regulating activity. Cellular uptake of HSA-coated liposome-ODN complexes was more efficient than the uncoated liposome-ODN complexes. Treatment of the cells with HSA-coated liposome-ODN complexes resulted in efficient Bcl-2 mRNA down regulation that was approximately 3-fold greater than with uncoated liposomes (p<0.05) and 6-fold greater than with free ODN. The transfection efficiency of liposome-ODN complexes coated with HSA was dependent on the concentration of HSA used and on the contents of α-helix and β-strand in HSA. HSA-coated liposomes are effective delivery vehicles for antisense ODN.
Keywords: Liposomes, antisense oligonucleotide, G3139, Bcl-2, lipoplex, human serum albumin, drug delivery, cancer
1. Introduction
G3139, also known as genasense and oblimersen sodium, is an 18-mer phosphorothioate ODN complementary to the initial coding region of Bcl-2 mRNA and is designed for inhibiting Bcl-2 expression in cancer cells.1 In clinical studies, G3139 is given by continuous i.v. infusion and has so far produced mixed results, possibly due to inefficient delivery. Improving delivery, therefore, is regarded as a critical potential strategy for improving therapeutic efficacy of ODN drugs.2–6 Cationic liposomes can form electrostatic complexes (lipoplexes) with ODNs and have shown some promise as delivery vehicles.7,8 Nonetheless, further improvements in delivery efficiency may be required for clinical application of liposomal ODN.
Human serum albumin (HSA) is the most abundant protein in human plasma. It has been reported to improve the delivery of plasmid DNA.9,10 Plasma proteins have also been shown to enhance cellular uptake of liposomal ODN.11 In this study, we prepared formulations consisting of liposome-ODN coated with HSA, and investigated the effects of HSA on transfection efficiencies. We investigated the effect of HSA concentration on the stability and transfection efficiencies of liposome-ODN complexes, and examined the effect of the secondary structure in HSA on the transfection efficiencies of liposome-ODN complexes coated with HSA. We demonstrated that treatment of the cells with HSA-coated liposome-ODN complexes resulted in significant enhanced Bcl-2 mRNA down-regulation. The transfection efficiency of liposome-ODN coated with HSA was found to be dependent on the concentration of HSA and the content of α-helix and β-strand in HSA.
2. Materials and Methods
2.1. Materials
Dimethyldioctadecyl ammonium bromide (DDAB) and HSA were purchased from Sigma-Aldrich (St. Louis, MO, USA). Egg phosphatidylcholine (PC) was purchased from Lipoid GMBH (Ludwigshafen, Germany). α-tocopheryl polyethylene glycol 1000 succinate (TPGS) was obtained as a gift from Eastman Chemical Ltd. (Llangefni, Anglesey, UK). RPMI-1640 media, fetal bovine serum (FBS), trypsin-EDTA and penicillin-streptomycin were purchased from Invitrogen (Grand Island, NY, USA).
2.2. Antisense oligonucleotides
G3139, a fully phosphorothioated 18-mer oliogonucleotide (Sequence 5'-3': TCT CCC AGC GTG CGC CAT), G3622, a reversed sequence control for G3139 (Sequence 5'-3': TAC CGC GTG CGA CCC TCT), and FITC-labeled G3139 (Sequence 5'-3': FITC-TCT CCC AGC GTG CGC CAT) were obtained from Alpha DNA (Quebec, Canada).
2.3. Preparation of cationic liposomes and liposome-ODN complexes
Cationic liposomes were prepared from DDAB, PC and TPGS by ethanol dilution as described previously12 with minor modification. Briefly, DDAB, PC and TPGS were dissolved in ethanol at a molar ratio of 58:40:2 and injected into a stirring HEPES buffered solution (20 mM HEPES, pH 7.4) at room temperature. Ethanol was removed by dialysis using a MWCO 10,000 Dalton Float-A-Lyser (Spectrum Laboratories Inc., Ranco Dominguez, CA) and against HEPES buffer (20 mM HEPES, pH 7.4) for 2 h at room temperature. The resulting liposomes were then sterilized using a 0.22 µm filter (Fisher Scientific, Pittsburgh, PA, USA). Cationic liposome-ODN complexes were prepared by mixing cationic liposomes with an equal volume of ODN in HEPES buffer (20 mM HEPES, pH 7.4) and incubated at room temperature for 15 min. HSA was directly added to the liposome-ODN complexes at molar ratios to lipids of 0.15:100, 0.75:100, 1.5:100, 3:100, 4.5:100 and 9:100, and incubated for 15 min before use in transfection studies. The concentration of ODN was fixed at 0.9 µM. The model structure of HSA-coated liposome-ODN complexes is presented in Figure 1.13
Figure 1.

A model structure of HSA-coated liposome-ODN complex.13
2.4. Size and zeta potential measurements
The particle size of liposome-ODN complexes was determined by dynamic light scattering using a particle sizer (NICOMP 370, Santa Barbara, CA, USA) ) in the volume weighing mode. The liposome-ODN complexes was prepared in 20 mM HEPES, pH 7.4 (300 µl). Prior to measurement the samples were diluted with the same buffer to 500 µl. The zeta potential of liposome-ODN complexes was determined by phase analysis light scattering using a PALS zeta potential analyzer (Brookhaven Instrument Corp, Holtsville, NY, USA).
2.5. Encapsulation efficiency
Liposome-ODN complexes were prepared in 100 µl of 20 mM HEPES, pH 7.4. Their encapsulation efficiency was determined by centrifugation (14,000 rpm, 20 min) through a Microcon centrifugal filter device, MWCO 10,000 (Millipore Corporation, Bedford, MA, USA) The content of unencapsulated ODN in the supernatant was determined by measuring OD at 260 nm on a Nanodrop spectrometer (ND1000, NanoDrop Technologies, Inc., Wilmington, DE, USA). The encapsulation efficiency (%) was calculated as follows. Empty liposomes were used as a background control. A standard curve was generated between 0.5 and 15 µg of ODN per ml in 20 mM HEPES, pH 7.4.
2.6. Agarose gel electrophoresis
The liposome-ODN complexes were analyzed on a 1.2 % agarose gel stained with ethidium bromide (0.5 µg/ml) in 1x TBE buffer (Invitrogen, Calsbad, CA, USA). Electrophoresis was carried out at 100 V for 30 min. The volume of the sample loaded in the gel well was 15 µl of liposome-ODN complexes containing 2.5 µg of ODN. The ODN was visualized using a UV transilluminator (Electronic UV Transilluminator, Ultra-Lum, Claremont, CA, USA) and imaged using Kodak DC 290 digital camera (Eastman Kodak, Rochester, NY, USA).
2.7. Preparation of heated HSA
HSA was dissolved at a concentration of 5 mg/ml in 1 ml of phosphate buffer, pH 7.4 and heated to different temperatures (50 °C, 70 °C and 90 °C) in a thermal cycler (Techne PHC-3, Pegasus Scientific Inc, Frederick, MD, USA), incubated for 30 min and cooled to room temperature. The heated HSA was directly used to coat the liposome-ODN to study the effect of heated HSA on the Bcl-2 down regulation in KB cells.
2.8. Circular dichroism (CD) spectra measurement
The content of alpha-helix in HSA solution was determined using CD spectra on a Circular Dichroism Spectrometer Model 62A DS, (AVIV Associates, Lakewood, NJ, USA), using a 1-cm path length cuvette in phosphate buffer, pH 7.4. The concentration of HSA was 1 mg/ml. The settings for measurement were 180–260 nm scanning wavelength, 1.0-nm bandwidth, 5 sec time constant, 25 °C, and three accumulations. The content of alpha-helix and beta strand (%) in HSA was quantified by using K2D2 software publicly accessible at http://www.ogic.ca/projects/k2d2/.14
2.9. Cell culture
KB (originally identified as a human oral carcinoma cell line, later identified as a subline of human cervical cancer HeLa cell line) cells was grown in RPMI-1640 (Invitrogen, Grand Island, NY, USA) containing 10% FBS, 100 µg/ml streptomycin and 100 U/ml penicillin. The cells were maintained at 37 °C in a humidified incubator with 5% CO2.
2.10. Transfection study of liposome-ODN complexes
KB cells were seeded into 6-well plates at a density of 2×10⁴ cells/cm2 in 2 ml of growth medium and grown to 60–70% confluent on the day of the experiment. Prior to transfection, the medium was removed and the cells were rinsed with phosphate-buffered saline (PBS, pH 7.4), and then supplied with 850 µl of fresh culture medium without FBS. The cells were incubated with 150 µl of liposome-ODN complexes (N/P ratio of 3) at a final ODN concentration of 0.9 µM for 4 h. Untreated cells, cells transfected with free G3139, and cells transfected with Oligofectamine™ Reagent (15 µl per well) were used as controls. After transfection, the medium was replaced with 2 ml of fresh growth medium, and the cells were incubated for 48 h at 37 °C under 5% CO2 atmosphere. All transfection experiments were performed in triplicate.
2.11. Intracellular delivery of liposome-ODN complexes
KB cells were seeded into 6-well plates at a density of 2×10⁴ cells/cm2 in 2 ml of growth medium. Liposomes complexed with ODN spiked with 10% fluorescent ODN FITC-G3139 were added to the cells. After 4 h incubation at 37 °C, the cells were washed with PBS three times, fixed with 3% paraformaldehyde and imaged using a confocal laser scanning microscope (ZEISS LSM 510 META, ZEISS GmbH, Jena, Germany). ODN uptake by KB cells was measured by flow cytometry on a FACSCalibur flow cytometer (Becton Dickinson, Franklin Lakes, NJ, USA).
2.12. RNA extraction
Total RNA from cultured cells was extracted 48 h after incubation with the liposome-ODN formulation. Cells were harvested by trypsinization with 0.25% trypsin-EDTA and washed with PBS, pH 7.4. The cells were then lysed with 250 µl of Trizol reagent (Invitrogen, Grand Island, NY, USA) for 5 min and total RNA was extracted by adding 100 µl of chloroform. The cell lysate was centrifuged at 12,000 rpm at 4 °C for 10 min and the supernatant was collected. The total RNA was further purified by ethanol precipitation15 and total RNA concentrations were quantified by measurement of UV absorbance at 260 nm using a NanoDrop spectrophotometer (ND1000, NanoDrop Technologies, Inc., Wilmington, DE, USA)
2.13. Determination of Bcl-2 mRNA expression by quantitative RT-PCR
The level of Bcl-2 mRNA expression was measured using quantitative RT-PCR. Synthesis of cDNA was performed using the first-strand cDNA synthesis kit (Invitrogen Carlsbad, CA, USA) as follows. Two µg of total mRNA were mixed with 1 µL of 50 ng/µl random hexamer primer and 1 µl of 10 mM dNTP mix, and heated to 65 °C for 5 min using a thermal cycler (Biorad, Hercules, CA, USA), and then cooled to 4 °C for 5 min. Ten µl of cDNA synthesis mix containing 1 µl of 200 U/µl SupersScriptIII RT, 1 µl of 40 U/µl RNaseOUT, 2 µl of 10xRT buffer, 4 µl of 25 mM MgCl2 and 2 µl of 0.1 M DTT were added into each sample and the samples were then incubated in a thermal cycler (Biorad, Hercules, CA, USA) at 25 °C for 10 min and heated to 50 °C for 50 min followed by heating to 85 °C for 5 min and cooling to 4 °C for 5 min. The resulting cDNA was amplified by quantitative real-time PCR StepOnePlus Real-Time PCR System (Applied Biosystems, Foster City, CA, USA) using Taqman Universal Master Mix (Applied Biosystems, Foster City, CA, USA). Primer and probe sequences were designed by the Primer Express program (Applied Biosystems): Bcl-2 forward primer 5’ CCCTGTGGATGACTGAGTACCTG, Bcl-2 reverse 5’ CCAGCCTCCGTTATCCTGG, Bcl-2 probe 5’ FAM-ACCGGCACCTGCACACCTGGA-TAMRA, ABL forward 5’ TGGAGATTAACACTCTAAGCATAACTAAAGGT, ABL reverse 5’ GATGTAGTTGCTTGGGACCCA, ABL probe 5’ FAM-CCATTTTTGGTTTGGGCTTCACACCATT- TAMPRA. Relative gene expression values were determined by the ΔΔCT method using the StepOne v2.0 software (Applied Biosystems, Foster City, CA, USA). Bcl-2 expression was normalized to a housekeeping gene ABL as an endogenous reference in the corresponding samples, and relative to the untreated control cells.
2.14. Protein extraction
Liposome-ODN transfection of KB cells was performed as described above. After 48 h incubation, the cells were harvested by trypsinizing with 0.25 % trypsin-EDTA and washing with PBS, pH 7.4. The cells was then lysed with 50 µl of 25 mM HEPES lysis buffer, pH 7.4 (Boston BioProducts, Worcester, MA, USA) containing protease Inhibitor Cocktail Set III (CalBiochem, San Diego, CA, USA) and incubated on ice for 10 min. The cell lysate was then centrifuged at 12,000 rpm at 4 °C for 10 min and the supernatant was collected. The total protein concentration was determined by the bicinchoninic acid (BCA) protein assay (Pierce, Rockford, IL, USA).
2.15. Evaluation of Bcl-2 protein by Western blot analysis
Cell lysate containing 20 µg of total protein was separated on a 4–20% Precast Gel Tris HCl -polyacrylamide gel (Bio-Rad, Hercules, CA, USA) at 180 V for 1 h 30 min and then blotted to polyvinylidine difluoride membranes (Hybond™-P, Amersham Bioscience, GE Healthcare, Piscataway, NJ, USA) at 180 mA overnight at 4 °C. The membranes were blocked for 1 h in 10% powdered nonfat milk in Tris-buffered saline/Tween-20, and then incubated with monoclonal mouse anti-human Bcl-2 (Dakocytomation, Glostrup, Denmark) at a dilution of 1:1000 or polyclonal goat anti-human actin antibody (Santa Cruz, Santa Cruz, CA, USA) at a dilution of 1:2000 overnight at 4 °C. Following four washing steps, the membranes were incubated with horseradish peroxidase linked anti-mouse IgG (Amersham Bioscience, GE Healthcare, Piscataway, NJ, USA) at a dilution of 1:2000 or rabbit anti-goat IgG (Pierce, Rockford, IL, USA) at a dilution of 1:4000 for 2 h at room temperature. The membranes were then developed with SuperSignal West Dura Extended Duration Substrate (Pierce, Rockford, IL, USA) and imaged with an autoradiography film (Hyblot CL™, Denville Scientific, Inc., Metuchen, NJ, USA). The Bcl-2 protein level was quantified using ImageJ software and normalized with the β-actin level from the same sample.
2.16. Statistical analysis
The results were presented as the mean ± standard deviation (SD) of three repeat studies unless otherwise indicated. Statistical significance of the differences in fluorescent intensity data obtained by flow cytometry were examined using the Student's t-Test. Statistical significance of the differences in Bcl-2 mRNA and Bcl-2 protein expressions were examined using one-way analysis of variance (ANOVA) followed by an LSD post hoc test. The significance level was set at p<0.05.
3. Results
3.1. Liposome characterization
Cationic liposomes prepared by ethanol dilution had an average diameter of 28.06 ± 4.06 nm as determined by dynamic light scattering. We then investigated the ability of our liposome formulation to form electrostatic complexes with the ODN and retard its migration during agarose gel electrophoresis. Figure 2 shows liposome-ODN complexes formed at lipid-to-ODN ratios of 0.4, 2, 4, 6, and 8. Complexes were completely retarded at lipid-to-ODN ratios above 4. Liposome-ODN formulation with a lipid-to-ODN ratio of 6 was then selected for further investigation. The particle size of the liposome-ODN complexes was 91.1 ± 11.6 nm and the efficiency of oligonucleotide encapsulation was 87.2 ± 1.7 %.
Figure 2.
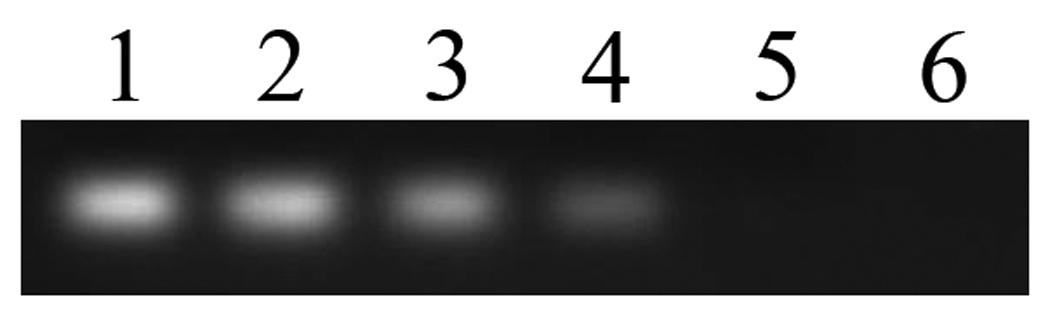
Gel electrophoresis analysis of ODN in liposome formulation. Lane 1: free G3139 (2.5 µg); lanes 2–6: liposome-ODN complexes at lipid-to-ODN ratios of 0.4, 2, 4, 6, and 8, respectively.
3.2. Intracellular delivery of HSA-coated liposome-ODN complexes
Intracellular delivery of HSA-coated liposome-ODN complexes was examined by confocal fluorescence microscopy (Figure 3A). FITC-ODN was incorporated into liposome-ODN complexes or liposome-ODN complexes coated with HSA, which were incubated with KB cells for 4 h at 37 °C. Cells exhibited ODN uptake as shown by its fluorescence. The brighter fluorescence in the cytoplasm of the cells treated with HSA-coated liposome-ODN complexes suggested more efficient endosomal escape of the ODN into the cytoplasm. The fluorescence intensity of the cells treated with HSA-coated liposome-ODN complexes examined by flow cytometry was significantly higher than that treated with the uncoated liposome-ODN complexes (p<0.05) (Figure 3B and 3C).
Figure 3.
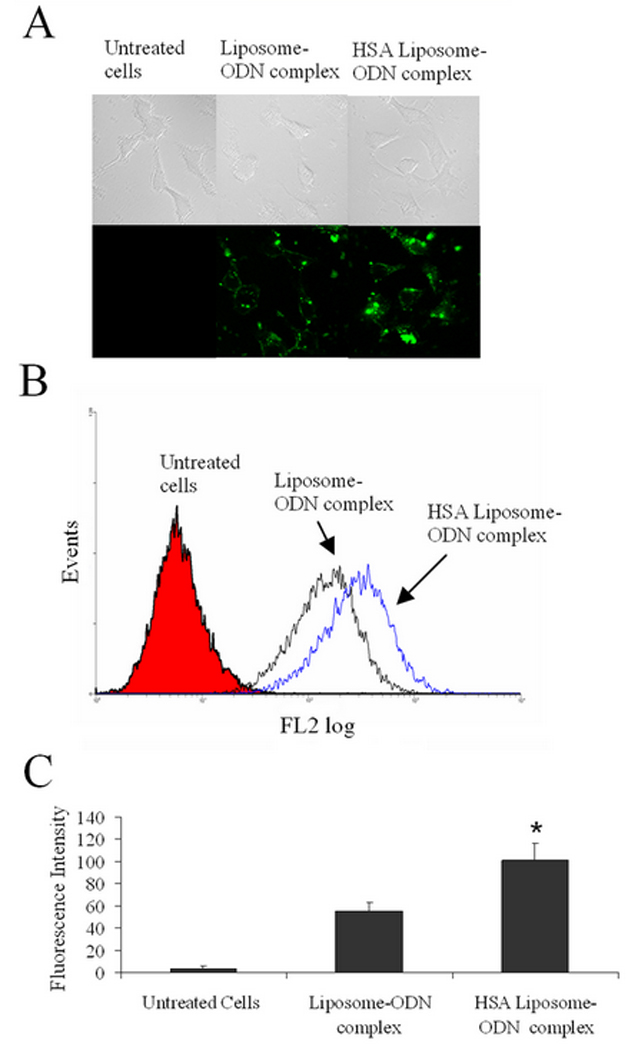
Intracellular delivery of HSA-coated liposome-ODN complexes in KB cells visualized on a confocal microscope (A) measured on a FACSCalibur flow cytometer (B) and fluorescent intensity (B). Cells were incubated with HSA-coated liposome complexed with ODN spiked with 10% fluorescent ODN FITC-G3139 at HSA to liposome molar ratio of 1.5:100 for 4 h at 37 °C. Differences values * were statistically significant (P<0.05).
3.3. Effect of HSA concentration on Bcl-2 down regulation
The role of protein-to-lipid ratio in transfection activity of HSA-coated liposome-ODN complexes was examined. Figure 4A shows the real-time RT-PCR analysis of liposome-ODN complexes coated with HSA at molar ratios of 0.15:100, 1.5:100, 3:100, 4.5:100 and 9:100. Oligofectamine-ODN complexes were used as a positive control and had a Bcl-2 down regulation of 81.3 ± 1.1%. The Bcl-2 down regulation in KB cells by the uncoated liposome-ODN formulation was observed with a reduction of 51.3 ± 2.8%. When HSA was added to the liposome-ODN complexes, the Bcl-2 down regulation was significantly enhanced (p<0.05). The degree of enhancement was affected by the molar ratio of HSA-to-lipid in the liposome formulation. The enhancement was most profound at the HSA to liposome molar ratio of 3:100 with 85.0 ± 0.9 % reduction (p<0.05) in cellular Bcl-2 expression. The Bcl-2 down regulation decreased to a value of 66.3 ± 4.7% at the high molar ratio of 9:100. Co-incubation of HSA-coated liposome-ODN complexes with excess HSA (100 times) did not produce enhancement of Bcl-2down regulation.
Figure 4.
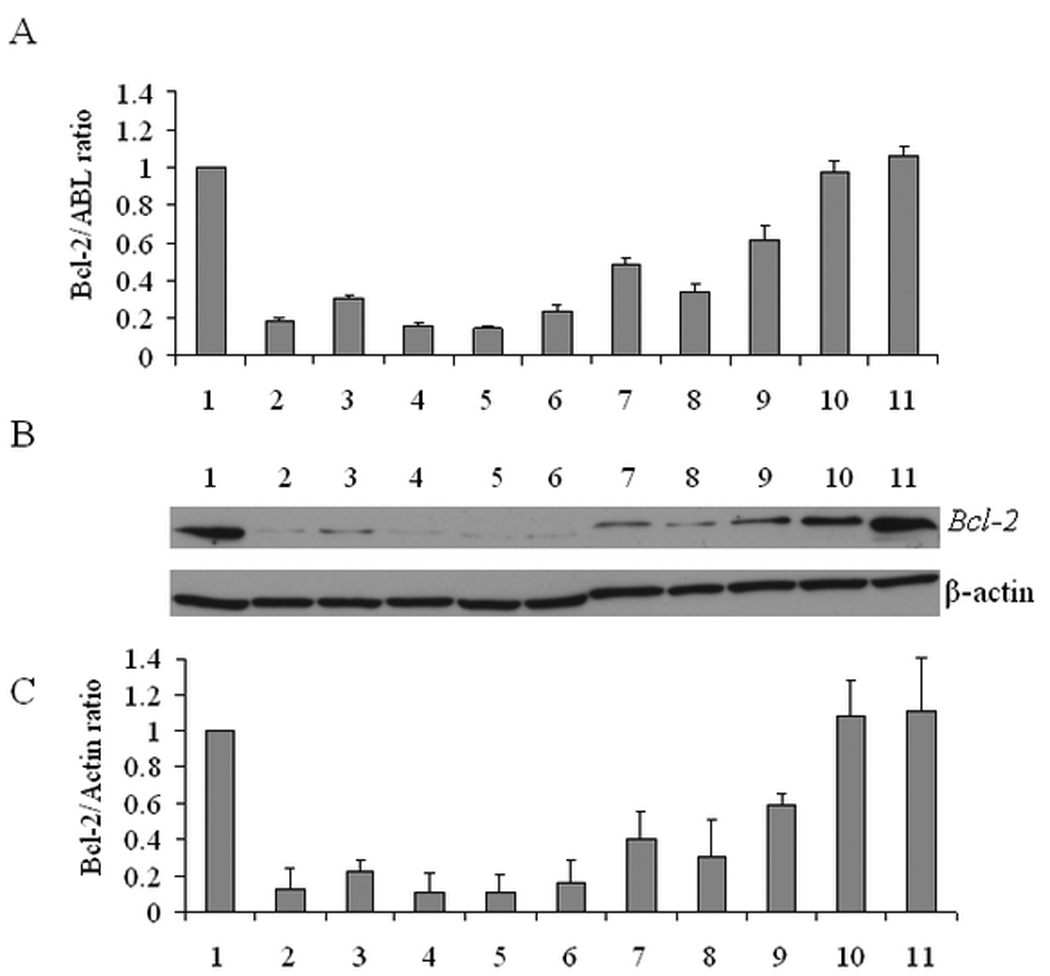
Effect of HSA concentration on transfection efficiency of liposome-ODN complexes in KB cells. Bcl-2 mRNA expression determined by real-time RT-PCR (A), Bcl-2 protein expression determined by Western blot (B) and quantification of Bcl-2 protein level normalized by β-actin (C). 1) untreated cells; 2) Oligofectamine-ODN complexes; 3) liposome-ODN complexes coated with HSA at 0.15:100 molar ratio; 4) 1.5:100 molar ratio; 5) 3:100 molar ratio; 6) 4.5:100 molar ratio; 7) uncoated liposome-ODN complexes; 8) liposome-ODN complexes coated with HSA at 9:100 molar ratio; 9) liposome-ODN complexes co-incubation with excess HSA (150:100 molar ratio); 10) free G3139; 11) free G3622. Each value represents the mean ± SD of three repeat studies.
The ability of HSA-coated liposome-ODN complexes to down-regulate the Bcl-2 protein in KB cells was examined by Western blotting. As shown in Figure 4B and 4C, cells treated with HSA-coated liposome-ODN complexes reduced Bcl-2 protein level to 89.5 ± 10.0 % at a molar ratio of 3:100, compared to 59.5 ± 15.0 % by uncoated liposome-ODN complexes. The Bcl-2 down regulation level was dependent on the molar ratio of HSA in the liposome formulation. At a concentration of 9:100, HSA-coated liposome-ODN complexes exhibited reduced Bcl-2 down regulation level. HSA-coated liposome-ODN complexes co-incubated with excess HSA (100 times) did not enhance Bcl-2 protein down regulation. In summary, the observed effects on Bcl-2 protein level correlated with the antisense ODN activity measured by the Bcl-2 mRNA level as shown in Figure 4A.
3.4. Effect of HSA on the stability of liposome-ODN complexes
Due to its negative charge, HSA may affect the stability of positively charged liposome-ODN complexes. Zeta potential measurement was performed following the addition of HSA to liposome-ODN. Figure 5 shows the zeta potential of the liposome-ODN complexes in the presence of HSA at the molar ratios of 0:100, 0.15:100, 0.75:100, 1.5:100, 3:100, 4.5:100 and 9:100. The zeta potential of plain liposome-ODN complexes had a positive value of +22.0 ± 1.2 mV. The presence of HSA at the molar ratios of 0.15:100 and 0.75:100 did not affect the zeta potential value of liposome-ODN. At a molar ratio greater than 0.75:100, the zeta potential value gradually decreased and turned to negative values of −3.1 ± 2.0 and −11.3 ± 0.5 mV at the molar ratios of 4.5:100 and 9:100, respectively.
Figure 5.
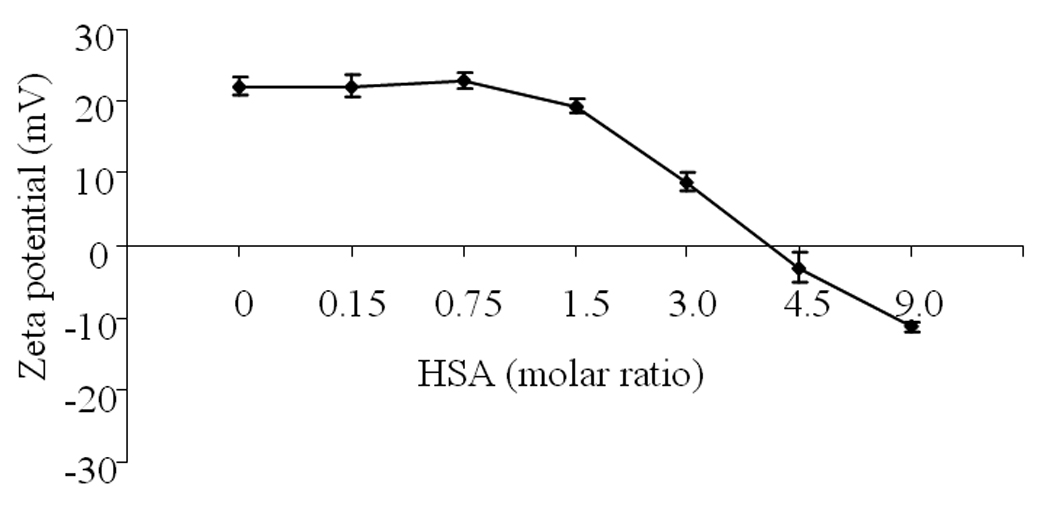
Zeta potential of liposome-ODN complexes formed at varying concentration of HSA. Each value represents the mean ± SD of three repeat studies.
Gel electrophoresis was used to evaluate the stability of liposome-ODN complexes coated with HSA. Figure 6 shows gel electrophoresis of liposome-ODN complexes incubated with HSA at 15 min and 4 h. Liposome-ODN complexes were destabilized by HSA at a molar ratio of 9:100 as free ODN could be detected on the gel. At HSA molar ratios of 1.5:100, 4.5:100, the formation of liposome-ODN complexes was not affected relative to the untreated liposome-ODN complexes.
Figure 6.
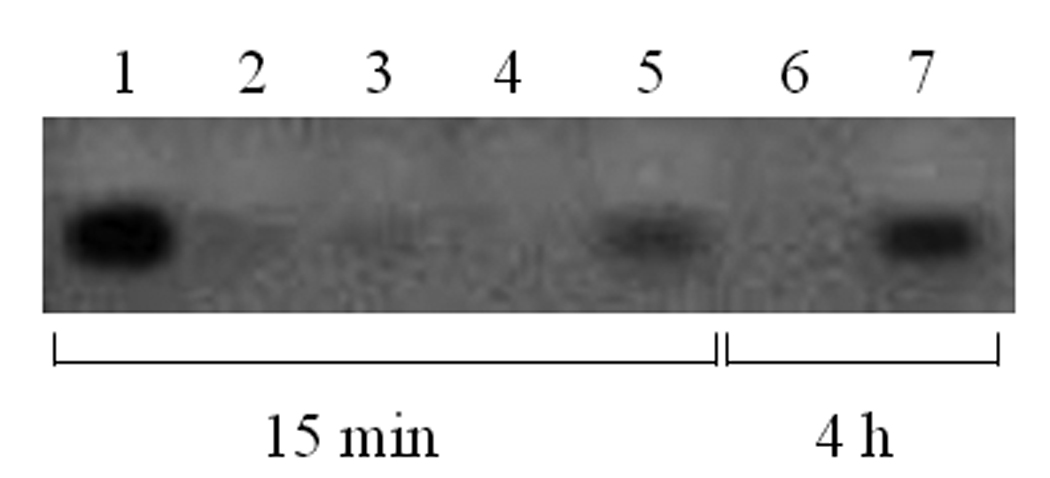
Gel electrophoresis of liposome-ODN complexes coated with HSA. Lane 1: free G3139 (2.5 µg); lane 2: uncoated liposome-ODN complexes; lanes 3–5: liposome-ODN complexes coated with HSA at molar ratios of 1.5:100, 4.5:100 and 9:100, respectively. The incubation time of liposome-ODN complexes coated with HSA was 15 min. Lane 6: uncoated liposome-ODN complexes; lane 7: liposome-ODN complexes coated with HSA at molar ratios of 9:100. The incubation time of liposome-ODN complexes coated with HSA was 4 h.
3.5. Effect of heated HSA on Bcl-2 down regulation
HSA was heated to varying temperatures and then added to liposome-ODN complexes in order to study the effect of protein denaturation on ODN transfection. The Bcl-2 mRNA down regulation by ODN in unheated and heated HSA-coated liposome-ODN complexes is shown in Figure 7A. The Bcl-2 mRNA down regulation was decreased as the HSA was heated. The Bcl-2 down regulation by unheated HSA-coated liposome-ODN formulation was observed with a reduction of 85.7 ± 5.9 %. In contrast, liposome-ODN complexes coated with HSA heated to 50 °C, 70 °C and 90 °C had a Bcl-2 mRNA reduction of 76.8 ± 7.4 %, 8.4 ± 14.1 % and 5.9 ± 17.5 %, respectively. The same trend was obtained based on Bcl-2 protein level (Figure 7B and 7C). Treatment with liposome-ODN complexes coated with HSA heated to 50 °C had a Bcl-2 protein reduction of 37.0 ± 3.4 %. Liposome-ODN complexes coated with HSA heated to 70 °C and 90 °C did not significantly reduce Bcl-2 protein level. Unheated HSA-coated liposome-ODN complexes decreased Bcl-2 protein level up to 81.0 ± 12.5 %.
Figure 7.
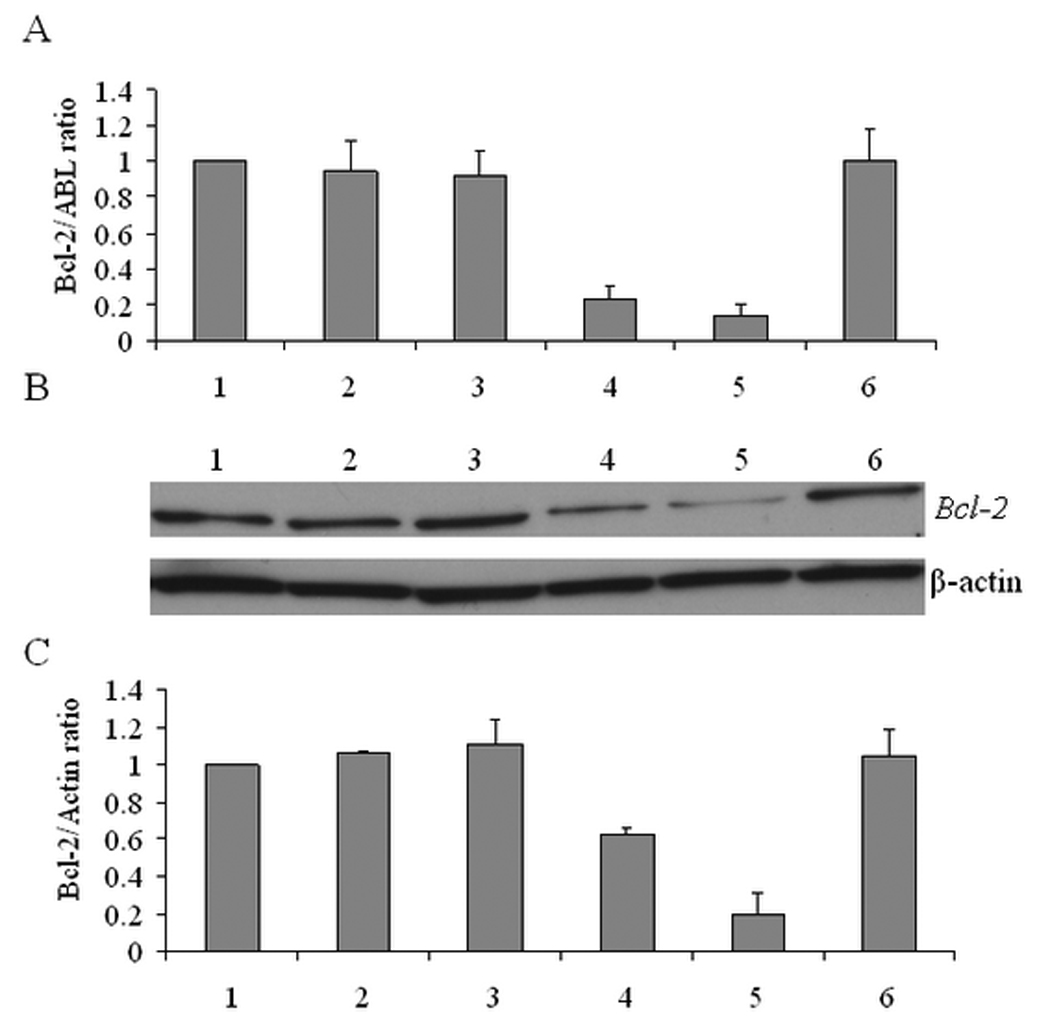
Effect of heat denaturation of HSA on transfection efficiency of liposome-ODN complexes in KB cells at different temperatures. Evaluation of Bcl-2 mRNA expression by real-time RT-PCR (A), Bcl-2 protein expression using Western blot (B) and quantification of Bcl-2 protein level normalized by β-actin (C). 1) untreated cells; 2) HSA heated to 90 °C; 3) 70 °C; 4) 50 °C; 5) unheated HSA; 6) free ODN. Each value represents the mean ± SD of three repeat studies.
3.6. Content of secondary structure in heated HSA
CD spectroscopy was performed to quantify the content of secondary structure in HSA heated to different temperatures. Figure 8A shows the CD spectra of unheated HSA and HSA heated to 50 °C, 70 °C and 90 °C. The CD spectra of unheated HSA and heated HSA have a negative broad band between 200 and 250 nm. Unheated HSA showed highest CD intensity. The CD intensity of HSA decreased with increasing the heating temperature. The content of α-helix and β-strand in unheated HSA and heated HSA was quantified using K2D2 software, and plotted with the corresponding HSA (Figure 8B). The content of α-helix in HSA had a tendency to decrease as the heating temperature increased. The content ranks of α-helix in HSA were: unheated HSA (45.5 ± 4.1 %) ~ HSA heated to 50 °C (45.2 ± 3.6 %) > HSA heated to 70 °C (34.3 ± 7.7 %) > HSA heated to 90 °C (26.8 ± 1.3 %). On the other hand, the content of β-strand in HSA had a tendency to increase as the heating temperature increased. The content ranks of β-strand in HSA were: unheated HSA (9.7 ± 0.02 %) ~HSA heated to 50 °C (8.9 ± 1.1 %) < HSA heated to 70 °C (11.5 ± 2.9 %) < HSA heated to 90 °C (17.3 ± 0.2 %). This finding demonstrated that heating temperature affected the HSA conformation and specifically the content of the secondary structure in HSA.
Figure 8.
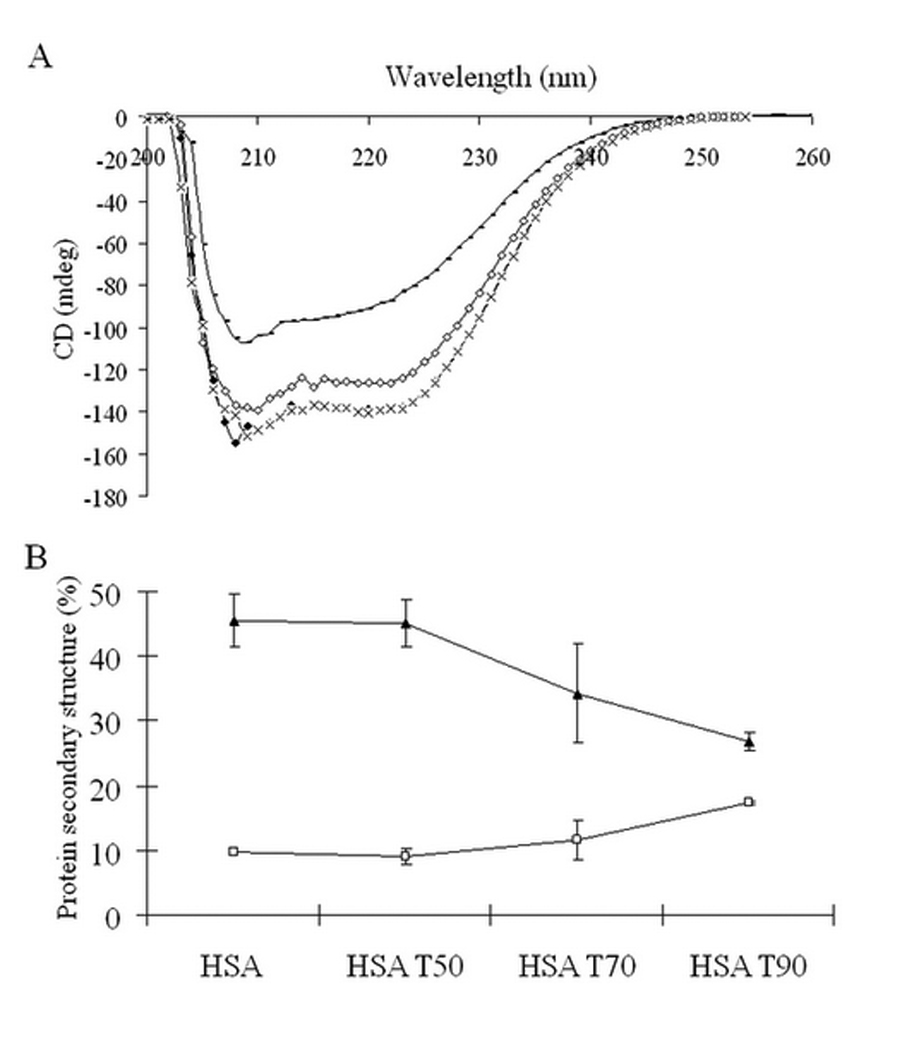
CD spectra of HSA heated to different temperatures (♦) unheated HSA; (−) HSA heated to 90 °C; (◊) HSA heated to 70 °C; (×) HSA heated to 50°C (A) and protein secondary structure (%) in corresponding unheated HSA and heated HSA was quantified using K2D2 software. Each value represents the mean ± SD of two repeat studies. (▲) α-helix; (□) β-strand (B).
4. Discussion
The application of HSA and other serum albumin has been reported in delivery of drugs and genes.16,17 In this study, we formulated HSA-coated liposomes encapsulating the Bcl-2 antisense oligonucleotide G3139, and evaluated the effect of the HSA concentration and HSA denaturation on the Bcl-2 down regulation in KB cells. We found that HSA at an appropriate concentration could enhance the delivery of liposome-ODN complexes in KB cells. The enhanced transfection efficiencies depended on the HSA concentration and the secondary structure of HSA. Interestingly, HSA-coated liposome-ODN complexes exhibited high efficiency in Bcl-2 mRNA and protein down regulation relative to Oligofectamine-ODN complexes.
Intracellular delivery of G3139 in KB cells showed that HSA can enhance delivery of liposome-ODN complexes. The increased transfection efficiency of HSA-coated liposome-ODN complexes could be due to both increased cellular uptake and the fusogenic property of HSA. The enhancement of cell uptake by HSA is proposed to take place by binding of HSA to cell surface proteins followed by endocytosis.9,18 Albumin may exhibit fusogenic property at acidic pH in the endosomes.9,19 The carboxyls in human serum albumin can become protonated upon acidification of the endosomes, which may result in conformational changes that exposes hydrophobic α-helixes normally residing in the hydrophobic core of the folded structure of HSA. The protonated HSA can then interact with endosomal membrane and induce its fusion with the liposomes or destabilization.9,20 The degree to which HSA enhance cellular uptake of liposome-ODN complexes depended on the amount of HSA in the HSA-coated liposome-ODN complexes and its secondary structure of the protein.
Our study showed that excessively high level of HSA did not trigger transfection enhancement. This is because high concentration of HSA can induce electrostatic destabilization of the liposome-ODN complexes. HSA possesses negative charge that can compete with the negatively charged ODN for binding to the positively charged liposomes and thus induce the release of ODN. Indeed, the addition of high concentration of HSA to liposome-ODN complexes was shown to change the surface charge of the complexes to negative and causes ODN release. The negative charge of liposome-ODN complexes containing high concentration of albumin may then inhibit their binding to the negatively charged cell surfaces, which lead to decrease in ODNdelivery activity.10,21 In addition, high amount of albumin also can cause aggregation of thecarrier system and thus decrease ODN delivery.22
Heating of albumin at increased temperatures can alter its secondary structure.23,24 The decrease in Bcl-2 down regulation could be due to a decrease in α-helix content and an increase in β-strand in heated HSA. This may affect HSA interaction with the cell surface as well as the endosomalytic activity of HSA. Our study on heated HSA demonstrated that heating to temperature of 70 °C and 90 °C greatly decreased the content of α-helix and increased the formation of β-strand relative to that heated to 50 °C and unheated HSA. This finding is in agreement with the reported denaturation of HSA taking place above 55 °C.24 Therefore, HSA conformation, specifically the content of α-helix and β-strand, can affect the efficiency of ODN delivery.
5. Conclusion
The liposomes formulated in this study had the ability to complex to ODN and yielded nanosized particles. Liposome-ODN complexes coated with HSA effectively enhanced the transfection efficiency in KB oral carcinoma cells. The formulation of HSA-coated liposomes was very efficient in Bcl-2 mRNA and protein down regulation. The transfection efficiency of liposome-ODN complexes coated with HSA was dependent on the concentration of HSA and the content of α-helix and β-strand in HSA. Another advantage of HSA is that it is biocompatible and nontoxic. The cytotoxicity of lipoplexes was found to be decreased in the presence of human serum albumin.25 This study suggests that HSA-coated liposome is a highly effective delivery vehicle for enhancing the delivery efficacy and therapeutic efficacy of antisense oligonucleotides and warrants further investigation.
Acknowledgments
This work was supported in part by NIH grant CA-135243 and NSF grant EEC-0425626. We are grateful to Prof. Rumiana Koynova for helpful advice in revising the manuscript.
References
- 1.Klasa RJ, Gillum AM, Klem RE, Frankel SR. Oblimersen Bcl-2 antisense: facilitating apoptosis in anticancer treatment. Antisense and Nucleic Acid Drug Dev. 2002;12:193–213. doi: 10.1089/108729002760220798. [DOI] [PubMed] [Google Scholar]
- 2.Ko YT, Falcao C, Torchilin VP. Cationic liposomes loaded with proapoptotic peptide d-(KLAKLAK)(2) and Bcl-2 antisense oligodeoxynucleotide G3139 for enhanced anticancer therapy. Mol. Pharm. 2009;6:971–977. doi: 10.1021/mp900006h. [DOI] [PMC free article] [PubMed] [Google Scholar]
- 3.Yessine MA, Meier C, Petereit HU, Leroux JC. On the role of methacrylic acid copolymers in the intracellular delivery of antisense oligonucleotides. Eur. J. Pharm. Biopharm. 2006;63:1–10. doi: 10.1016/j.ejpb.2005.10.010. [DOI] [PubMed] [Google Scholar]
- 4.Matsumoto T, Numata M, Anada T, Mizu M, Koumoto K, Sakurai K, Nagasaki T, Shinkai S. Chemically modified polysaccharide schizophyllan for antisense oligonucleotides delivery to enhance the cellular uptake efficiency. Biochim. Biophys. Acta. 2004;1670:91–104. doi: 10.1016/j.bbagen.2003.10.019. [DOI] [PubMed] [Google Scholar]
- 5.Chiu SJ, Liu S, Perrotti D, Marcucci G, Lee RJ. Efficient delivery of a Bcl-2-specific antisense oligodeoxyribonucleotide (G3139) via transferrin receptor-targeted liposomes. J. Control. Release. 2006;112:199–207. doi: 10.1016/j.jconrel.2006.02.011. [DOI] [PubMed] [Google Scholar]
- 6.Yang L, Li J, Zhou W, Yuan X, Li S. Targeted delivery of antisense oligodeoxynucleotides to folate receptor-overexpressing tumor cells. J. Control. Release. 2004;95:321–331. doi: 10.1016/j.jconrel.2003.11.021. [DOI] [PubMed] [Google Scholar]
- 7.Buck AC, Shen C, Schirrmeister H, Schmid-Kotsas A, Munzert G, Guhlmann A, Mehrke G, Klug N, Gross HJ, Bachem M, Reske SN. Liposomal delivery of antisense oligonucleotides for efficient downregulation of Bcl-2 and induction of apoptosis. Cancer Biother. Radiopharm. 2002;17:281–289. doi: 10.1089/10849780260179242. [DOI] [PubMed] [Google Scholar]
- 8.Meidan VM, Glezer J, Salomon S, Sidi Y, Barenholz Y, Cohen JS, Lilling G. Specific lipoplex-mediated antisense against Bcl-2 in breast cancer cells: a comparison between different formulations. J. Liposome Res. 2006;16:27–43. doi: 10.1080/08982100500528685. [DOI] [PubMed] [Google Scholar]
- 9.Simões S, Slepushkin V, Pires P, Gaspar R, Pedroso de Lima MC, Düzgüneş N. Human serum albumin enhances DNA transfection by lipoplexes and confers resistance to inhibition by serum. Biochim. Biophys. Acta. 2000;1463:459–469. doi: 10.1016/s0005-2736(99)00238-2. [DOI] [PubMed] [Google Scholar]
- 10.Orson FM, Song L, Gautam A, Densmore CL, Bhogal BS, Kinsey BM. Gene delivery to the lung using protein/polyethylenimine/plasmid complexes. Gene Ther. 2002;9:463–471. doi: 10.1038/sj.gt.3301666. [DOI] [PubMed] [Google Scholar]
- 11.Wasan EK, Waterhouse D, Sivak O, Bally MB, Klasa RJ, Wasan KM. Plasma protein binding, lipoprotein distribution and uptake of free and lipid-associated BCL-2 antisense oligodeoxynucleotides (G3139) in human melanoma cells. Int. J. Pharm. 2002;241:57–64. doi: 10.1016/s0378-5173(02)00131-x. [DOI] [PubMed] [Google Scholar]
- 12.Maurer N, Wong KF, Stark H, Louie L, McIntosh D, Wong T, Scherrer P, Semple SC, Cullis PR. Spontaneous entrapment of polynucleotides upon electrostatic interaction with ethanol-destabilized cationic liposomes. Biophys. J. 2001;80:2310–2326. doi: 10.1016/S0006-3495(01)76202-9. [DOI] [PMC free article] [PubMed] [Google Scholar]
- 13.Weisman S, Hirsch-Lerner D, Barenholz Y, Talmon Y. Nanostructure of cationic lipid-oligonucleotide complexes. Biophys J. 2004;87:609–614. doi: 10.1529/biophysj.103.033480. [DOI] [PMC free article] [PubMed] [Google Scholar]
- 14.Perez-Iratxeta C, Andrade-Navarro MA. K2D2: estimation of protein secondary structure from circular dichroism spectra. BMC Struct. Biol. 2008;8:25. doi: 10.1186/1472-6807-8-25. [DOI] [PMC free article] [PubMed] [Google Scholar]
- 15.Sambrook J, Fritsch EF, Maniatis T. Molecular Cloning a laboratory manual. 2th ed. New York: Cold Spring Harbor Laboratory Press; 1989. Extraction, purification, and analysis of Messenger RNA from Eukaryotic cells; pp. 7.6–7.9. [Google Scholar]
- 16.Dreis S, Rothweiler F, Michaelis M, Cinatl J, Jr, Kreuter J, Langer K. Preparation, characterisation and maintenance of drug efficacy of doxorubicin-loaded human serum albumin (HSA) nanoparticles. Int. J. Pharm. 2007;341:207–214. doi: 10.1016/j.ijpharm.2007.03.036. [DOI] [PubMed] [Google Scholar]
- 17.Kang H, Alam MR, Dixit V, Fisher M, Juliano RL. Cellular delivery and biological activity of antisense oligonucleotides conjugated to a targeted protein carrier. Bioconjug. Chem. 2008;19:2182–2188. doi: 10.1021/bc800270w. [DOI] [PMC free article] [PubMed] [Google Scholar]
- 18.Carrabino S, Di Gioia S, Copreni E, Conese M. Serum albumin enhances. polyethylenimine-mediated gene delivery to human respiratory epithelial cells. J. Gene Med. 2005;7:1555–1564. doi: 10.1002/jgm.799. [DOI] [PubMed] [Google Scholar]
- 19.Wilschut J, Hoekstra D. Membrane fusion: lipid vesicles as a model system. Chem Phys. Lipids. 1986;40:145–166. doi: 10.1016/0009-3084(86)90068-x. [DOI] [PubMed] [Google Scholar]
- 20.Düzgüneş N, De Ilarduya CT, Simões S, Zhdanov RI, Konopka K, Pedroso de Lima MC. Cationic liposomes for gene delivery: novel cationic lipids and enhancement by proteins and peptides. Curr. Med. Chem. 2003;10:1213–1220. doi: 10.2174/0929867033457403. [DOI] [PubMed] [Google Scholar]
- 21.Sanders NN, Van Rompaey E, De Smedt SC, Demeester J. Structural alterations of gene complexes by cystic fibrosis sputum. Am. J. Respir. Crit. Care Med. 2001;164:486–493. doi: 10.1164/ajrccm.164.3.2011041. [DOI] [PubMed] [Google Scholar]
- 22.Sanders NN, De Smedt SC, Demeester J. Mobility and stability of gene complexes in biogels. J. Control. Release. 2003;87:117–129. doi: 10.1016/s0168-3659(02)00355-3. [DOI] [PubMed] [Google Scholar]
- 23.Bramanti E, Benedetti E. Determination of the secondary structure of isomeric forms of human serum albumin by a particular frequency deconvolution procedure applied to Fourier transform IR analysis. Biopolymers. 1996;38:639–653. doi: 10.1002/(sici)1097-0282(199605)38:5<639::aid-bip8>3.0.co;2-t. [DOI] [PubMed] [Google Scholar]
- 24.Murayama K, Tomida M. Heat-induced secondary structure and conformation change of bovine serum albumin investigated by Fourier transform infrared spectroscopy. Biochemistry. 2004;43:11526–11532. doi: 10.1021/bi0489154. [DOI] [PubMed] [Google Scholar]
- 25.Faneca H, Simões S, Pedroso de Lima MC. Association of albumin or protamine to lipoplexes: enhancement of transfection and resistance to serum. J. Gene Med. 2004;6:681–692. doi: 10.1002/jgm.550. [DOI] [PubMed] [Google Scholar]