Abstract
Unlike those for monomeric superfamily members, heterotropic allosteric effectors of the tetrameric E. coli glycerol kinase (EGK) bind to only one of the two domains that define the catalytic cleft and far from the active site. An R369A amino acid substitution removes oligomeric interactions of a novel mini domain-swap loop of one subunit with the catalytic site of another subunit, and an A65T substitution perturbs oligomeric interactions in a second interface. Linked-functions enzyme kinetics, analytical ultracentrifugation, and FRET are used to assess effects of these substitutions on the allosteric control of catalysis. Inhibition by phosphotransferase system protein IIAGlc is reduced by the R369A substitution, and inhibition by fructose 1,6-bisphosphate is abolished by the A65T substitution. The oligomeric interactions enable the heterotropic allosteric effectors to act on both domains and modulate the catalytic cleft closure despite binding to only one domain.
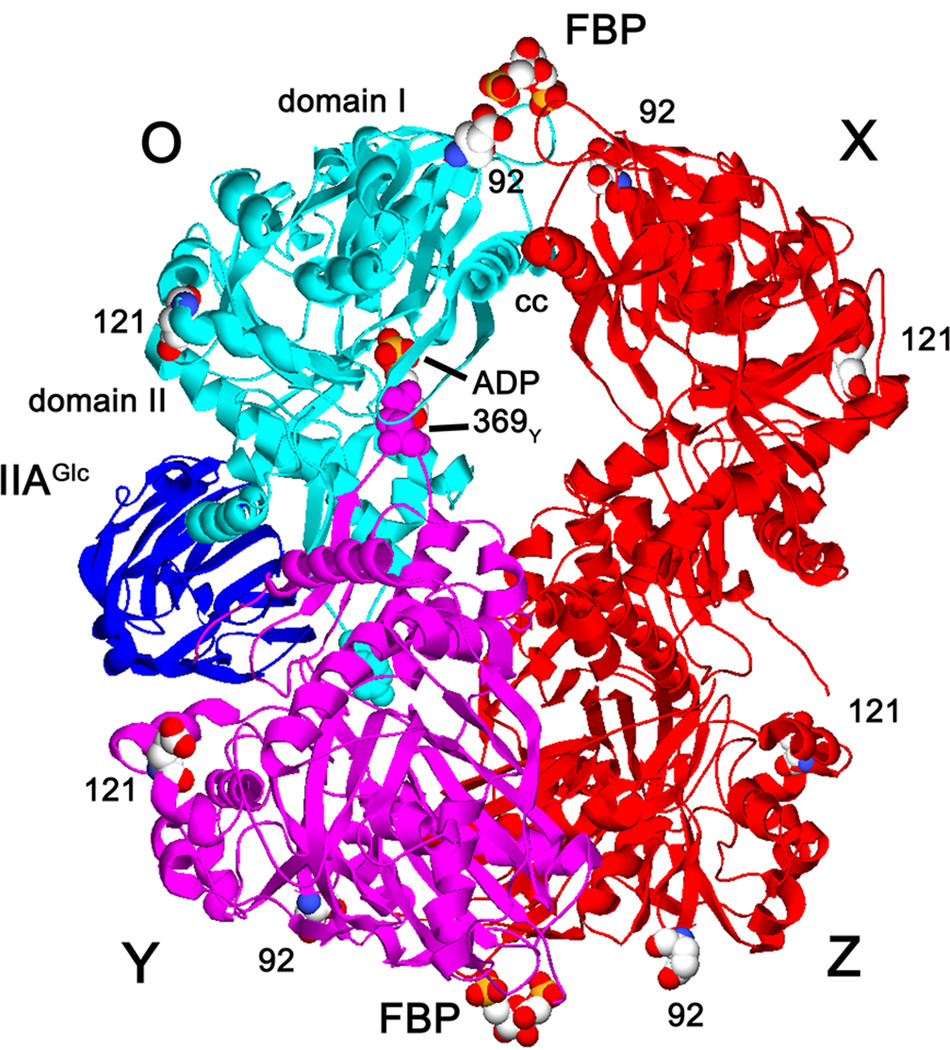
Its crystal structure [1] shows that EGK is a member of the sugar kinase/actin/hsp 70 superfamily of proteins [2].1 The common structure of superfamily members consists of two domains with the ATPase catalytic site located in a cleft between the domains, as shown in figure 1 for EGK. Catalysis is associated with relative movement of the domains that closes the cleft upon substrate binding [3, 4]. The functional activities of several members of the superfamily, including EGK [5], hexokinases [6], actin [7], and hsp70 [8], are modulated by allosteric effectors, and it is generally believed that the effectors act on the cleft closure. For most superfamily members, crystal structures support this conclusion by showing that allosteric effectors interact with both domains. Allosteric effectors for actin [7] and glucokinase [9] as well as the peptide domain linker of hsp70 [10] bind to a hydrophobic cleft that is formed between the domains opposite the substrate binding sites. Nucleotide exchange factors for hsp70 span the catalytic cleft [11, 12]. Modulation of catalysis or nucleotide binding, both activation and inhibition, by heterotropic allosteric effectors thus appears to arise from direct steric action on the cleft closure as a result of their interactions with both domains.
Figure 1.
Structure of EGK. Ribbon structures of the EGK tetramer with IIAGlc bound to one subunit are shown with labels for each protein and the domains of EGK. Subunits are labeled OXYZ with the O subunit shown in cyan and the Y subunit shown in magenta. FBP bound at each pole of the tetramer, ADP bound at the catalytic site of the O subunit, and the sites of the E92C and E121C substitutions are shown as spacefilled models with CPK colors. The sites of the non-native cysteine substitutions are separated by the following distances between the indicated subunits (Å): E92C: OX, 46; OY, 98; E121C: OX, 87; OY, 50. R369 amino acids for the O and Y subunits are shown as spacefilled models in the color of the subunit. The coiled-coil α–helices that contain the S58W and A65T substitution sites are labeled as cc. This composite structure was constructed by superposition of structures from pdb files 1glc [68] and 1bo5 [20] by using Deep View/Swiss-PdbViewer version 3.7 [69] and POV-Ray version 3.1 (www.povray.org).
The catalytic activity of EGK is inhibited allosterically by FBP and by the phosphotransferase system phosphocarrier protein IIAGlc [5]. The structural basis for these heterotropic allosteric controls appears to be novel within the superfamily. The hydrophobic cleft is occupied by amino acid residues 292–297, thus not accessible for allosteric effectors. As shown in figure 1, the binding site for FBP is located in only domain I about 35 Å from the catalytic site and the binding site for IIAGlc is located in only domain II about 30Å from the catalytic site. Inhibition by these heterotropic allosteric effectors thus does not involve direct steric interactions with both domains. This observation raises questions about relations between this novel allosteric control and the direct steric control that is seen for other superfamily members. These questions focus on the basis for communication between allosteric and catalytic sites that are not near one another. In current views of allostery, these communications are mediated by sparse networks of amino acid residues and may occur between binding sites on a monomeric protein [13–18].
Identification of these networks and the roles of individual amino acid residues in them is a key aspect of understanding allosteric control [19]. Crystal structures of EGK without and with IIAGlc or FBP do not show conformational differences that could reveal networks [20, 21]. However, the structures provide insights into possible roles of the oligomeric structure in the novel allosteric control. While other superfamily members whose activities are controlled allosterically are monomeric, EGK displays a dimer-tetramer equilibrium in solution and is a tetramer in the crystal. The requirement for tetramer formation for FBP inhibition has long been established [22, 23]. FBP binds to two sites per tetramer at a subunit-subunit interface and domain I of each subunit contributes one-half of a binding site (figure 1) [20]. Much of this interface consists of coiled-coil interactions between α-helices from the two subunits, and perturbation of these interactions by the amino acid substitution S58W [24] or A65T [21] abolishes FBP inhibition. These substitutions have small effects on IIAGlc inhibition. Thus, oligomeric interactions that are essential for FBP allosteric control are not essential for IIAGlc allosteric control but may be elements of a IIAGlc allosteric network. Here, linked-function initial-velocity enzyme kinetics of the A65T EGK shows that these interactions are elements of a IIAGlc allosteric network.
A second oligomeric interaction could have a role in allosteric control and may be related to the direct steric mode seen for other superfamily members: a domain II loop which contains R369 from one subunit penetrates deeply into the catalytic site cleft of a neighboring subunit. This mini domain-swap element [25] is observed in other glycerol kinases [26–28] and in E. coli xylulokinase [29]. This interaction for the O and Y subunits of EGK is shown in figure 1. The shortest distance between the R369 residue and the substrate-binding sites of the neighboring subunit is 10 Å, indicating that the loop does not interact directly with the substrates. Amino acid residues on the loop from one subunit, including R369, interact with both domains of the other subunit, and it was suggested that R369 may be involved in allosteric control of catalytic activity [1]. Here, the amino acid substitution R369A is used to assess roles of the oligomeric domain-bridging interactions in allosteric control of EGK. This substitution reduces IIAGlc inhibition significantly but has little effect on FBP inhibition. A FRET approach that is based on tetramer disproportionation is used to identify the functional dimer for EGK and determine that the domain swap loop is not removed from the catalytic cleft upon dimer formation.
Materials & Methods
Materials
Reagents were purchased from Sigma Chemical Company (St. Louis, MO) unless otherwise indicated. IIAGlc was prepared as described [30] from the BL21(DE3) strain of E. coli bearing the pVEX-crr plasmid which was generously provided by Drs. Norman Meadow and Saul Roseman of the Department of Biology of The Johns Hopkins University, Baltimore, MD. The concentration of IIAGlc was determined from absorbance at 260 nm by using an extinction coefficient of 1.6 mM−1cm−1 as described [31] and the molar concentration of IIAGlc was determined on the basis of a molecular mass of 18.1 kDa [32].
EGK and A65T EGK were purified as described [33, 34]. The plasmid construct for the R369A EGK was generously supplied by Dr. S. James Remington of the University of Oregon. The entire reading frame for the variant enzyme was verified by using the ABI Big Dye DNA sequencing protocol. Electrophoresis of DNA sequencing reactions and Sequencher software for sequence analysis were provided by the Gene Technologies Laboratory of Texas A&M University. The R369A EGK enzyme was purified as described [33]. The site-directed variant EGK enzymes E92C and E121C were constructed as described [34]. These enzymes were purified by using Q-Sepharose HP, Source 15Q, and ATP-agarose (C-8 linkage) affinity chromatographies on an Akta Purifier system. SDS-PAGE with GelCode Blue stain was used to show homogeneity of >95%. Glycerol kinase concentrations were determined from absorbance at 280 nm by using an extinction coefficient of 1.73 (mg/mL)−1cm−1 or 97.2 mM−1 (subunits)cm−1 [33].
Enzyme kinetics
Glycerol kinase enzyme activity was measured by using the continuous ADP-coupled spectrophotometric assay at pH 7.00 and 25°C to determine initial velocities as described [31]. The assays contained 50 mM triethanolamine-HCl buffer, 5 mM MgCl2, 20 mM KCl, 7.5 units each of pyruvate kinase and lactate dehydrogenase, 0.2 mM PEP, 0.2 mM NADH, and 10 mM glycerol in a total volume of 0.5 mL with ATP and IIAGlc concentrations as shown in the figures. The following enzyme concentrations were used in the assays: EGK and A65T EGK, 0.5 µg/mL (9 nM (subunits)); R369A EGK, 4 µg/mL (72 nM (subunits)). For initial-velocity and IIAGlc inhibition assays, reactions were initiated by addition of enzyme (5–10 µL). For FBP inhibition assays, FBP concentrations ranged from 0 to 10 mM and reactions were initiated by addition of ATP after 90 min incubation of the remaining assay components. One unit of glycerol kinase is defined as the amount of the enzyme that produces 1 µmol of ADP per minute per mL in this assay.
Kinetics Data Analysis
Data from titrations of specific activity with FBP or IIAGlc at 2.5 mM ATP were fit to equation 1:
| (1) |
where X is FBP or IIAGlc, SA[X] is the specific activity at the concentration of X, SA0 is the specific activity in the absence of the inhibitor, W is given by SA∞/SA0, SA∞ is the specific activity in the saturating presence of inhibitor, K0.5 is equal to the concentration of X that gives 50% of the maximum inhibition, and nH is the Hill coefficient. When X is IIAGlc, the value for nH is fixed at 1.0.
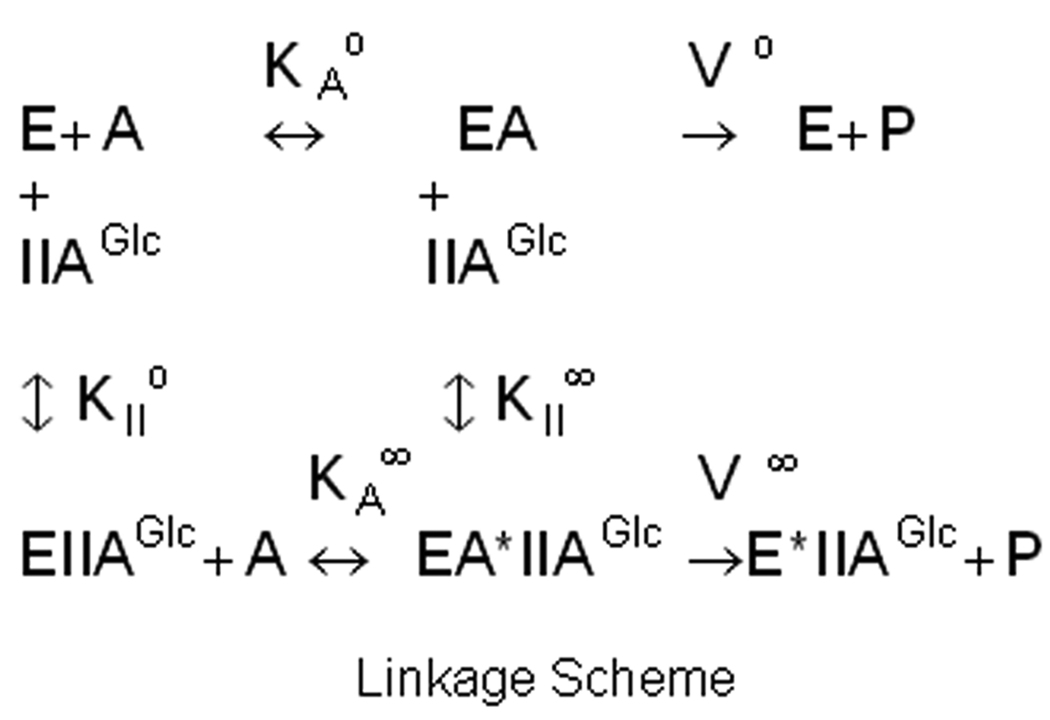
Effects of amino acid substitutions on allosteric coupling are described in terms of the thermodynamic linkage scheme that is shown in figure 2, which indicates relations between binding of IIAGlc, the Michaelis constant for MgATP, and Vmax in the context of the single-substrate, single-modifier case [35] based on the assumption of rapid equilibrium for binding of substrate [36]. The allosteric coupling constant Q describes the relation between binding of MgATP and IIAGlc and is defined in terms of the linkage scheme as Q = KAo/KA∞= KIIo/KII∞. The value of Q is >1 for cooperative coupling, <1 for antagonistic coupling, and equals 1 when there is no allosteric coupling. The coupling parameter W describes the effect of IIAGlc on Vmax and is given by W = V∞/Vo. The value of W is >1 if Vmax is increased by the allosteric effector, <1 if Vmax is decreased by the allosteric effector, and equals 1 when there is no allosteric effect on Vmax. The parameters of the linkage scheme are determined by using initial-velocity enzyme kinetics studies varying the concentration of ATP at fixed concentrations of IIAGlc and fitting the data to equation 2 [37]:
| (2) |
Figure 2.
Thermodynamic linkage scheme for allosteric coupling between IIAGlc and MgATP. E is the EGK-glycerol complex, A is MgATP, KAo is the Michaelis constant for MgATP in the absence of IIAGlc, KA∞ is the Michaelis constant for MgATP in the saturating presence of IIAGlc, KIIo is the dissociation constant for IIAGlc binding in the absence of MgATP, KII∞ is the dissociation constant for IIAGlc binding in the saturating presence of MgATP, Vo is Vmax in the absence of IIAGlc, and V∞ is Vmax in the saturating presence of IIAGlc.
Initial-velocity kinetics parameters were estimated by varying the concentrations of both substrates and fitting the data to equation 3, as described [33, 38]:
| (3) |
For kinetics data analysis, the parameters are estimated from fits to the respective equation by using the computer program Enzfitter version 2.0.18.0 (Biosoft) running under Windows XP on a Pentium® 4 processor. The parameter uncertainties are given as the 95% confidence intervals from the fit. For the E92C and E121C EGKs, data were fit to the equations by using Kaleidagraph and the parameter uncertainties are shown as standard errors. For these enzymes, catalytic parameters were obtained from fits of initial velocity data to the Michaelis-Menten equation.
Ligand binding stoichiometry
Determinations of ligand binding stoichiometry for ATP or glycerol were performed by equilibrium dialysis in 0.1 M triethanolamine buffer at pH 7.0 and ambient temperature as described [38]. Glycerol kinase concentrations were about 0.1 mM (subunits). The total concentration of ATP and of glycerol was about 1 mM. ATP concentration in each dialysis compartment was determined from absorbance at 259 nm and 280 nm using two equations with two unknowns and extinction coefficients at each wavelength for EGK and ATP. Glycerol concentration in each dialysis compartment was determined by using a glycerol 3-phosphate dehydrogenase spectrophotometic assay with excess ATP [38]. Three experiments were performed for for each enzyme and ligand. The parameter uncertainties are given as the standard deviations.
Analytical ultracentrifugation
Samples were subjected to sedimentation velocity analytical ultracentrifugation in a Beckman XLA centrifuge with an An60Ti rotor. Standard double-sector aluminum centerpiece cells with a 1.2 cm optical pathlength and quartz windows were used. The samples were equilibrated by dialysis with 0.1 M triethanolamine buffer pH 7.0 containing 2 mM glycerol. Enzyme loading concentrations were 3.7–5.3 µM (subunits). Centrifugation was at 28,500 rpm and 25°C with absorbance scans at 280 nm taken at 3.5 min intervals. The absorbance scans were fit to a single sedimentation coefficient by using the computer program Svedberg from John Philo, with the uncertainties given as the 95% confidence intervals [39].
FRET determinations
The E92C and E121C EGK variant enzymes at a protein concentration of about 8 µM (subunits) in 0.1 M triethanolamine buffer pH 8 with 2 mM glycerol and 2.5 mM ATP were labeled with extrinsic fluorophores by incubation at ambient temperature for 30 minutes with a 5-fold molar excess (subunits) of the iodoacetamido derivative of dansyl, fluorescein, or OG (Invitrogen-Molecular Probes). The reaction was quenched by adding β–mercaptoethanol to a final concentration of 10 mM. The samples were chromatographed on Sephadex G-25 and dialyzed against three changes of standard buffer pH 7 to remove unconjugated fluorophore. After dialysis, the protein concentration and fluorophore label stoichiometry were determined as described [34, 40]. Fluorescence emission spectra at 25°C in 0.1 M triethanolamine HCl buffer at pH 7.0 with 2 mM glycerol were recorded by using an ISS Phoenix spectrofluorometer with the excitation wavelength set to 336 nm. To identify the site of conjugation, OG-modified enzyme was reduced, carboxymethylated, and treated with trypsin, and peptides were isolated by using C18 reverse-phase chromatography as described [34, 40]. Column fractions that contained A480-absorbing material were analyzed by the Texas A&M University Protein Chemistry Laboratory by using MALDI-TOF mass spectrometry.
Results
Effects of the substitutions on allosteric inhibition by IIAGlc
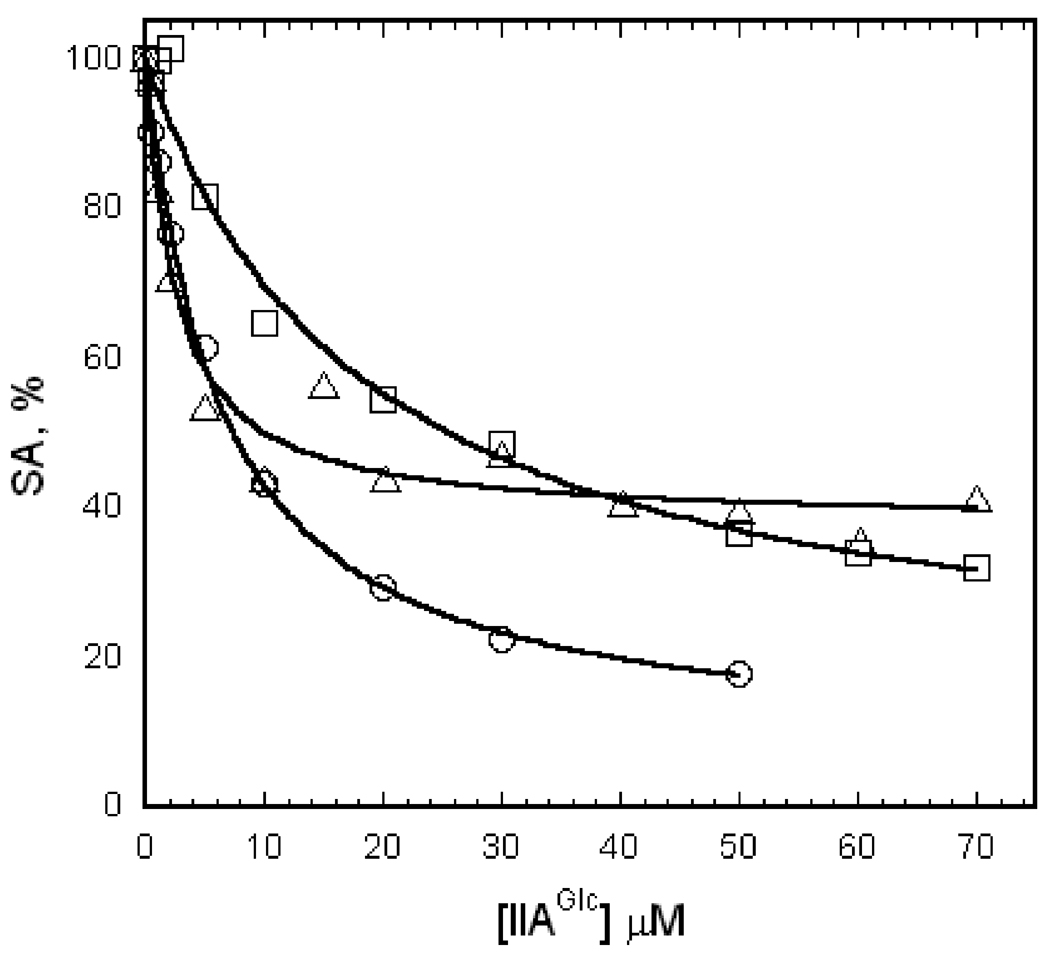
Oligomeric interactions within EGK are perturbed by the amino acid substitutions A65T and R369A. Effects of these perturbations on IIAGlc inhibition are shown in figure 3. The catalytic activity of EGK, A65T EGK, and R369A EGK decreases as the concentration of IIAGlc is increased. The points show the experimental data and the lines show the fit of those data by equation 1. The data are well-described by the fit in terms of hyperbolic binding of IIAGlc, indicating the absence of homotropic interactions for IIAGlc for all of the enzymes. The parameters K0.5 and W that are obtained from the fits are shown in Table 1. The values for K0.5 and W for EGK agree with those from earlier work [41]. The A65T and R369A amino acid substitutions change the apparent affinity for IIAGlc binding in the saturating presence of substrates as shown by the values for K0.5. The value for K0.5 is increased by the A65T substitution and decreased by the R369A substitution. Both substitutions increase W, showing that the ability of IIAGlc to inhibit the enzyme is reduced; the increase due to the A65T substitution is smaller than that from the R369A substitution.
Figure 3.
IIAGlc inhibition of EGK, A65T EGK, and R369A EGK. Specific activities were determined at 2.5 mM ATP and IIAGlc concentrations as shown with the following enzyme concentrations (nM subunits): EGK and A65T EGK, 9; R369A EGK, 72. The points show the specific activities normalized as percentages relative to the specific activity at 0 IIAGlc (EGK, 43 U/mg; A65T EGK, 63 U/mg; R369A EGK, 1.4 U/mg) and the lines show the fits to equation 1 that give the parameters in Table 1. Legend: EGK, circles; A65T EGK, squares; R369A EGK, triangles.
Table 1.
Functional and Molecular Parameters for EGK A65T and R369A Variants1
| Enzyme | EGK | R369A EGK | A65T EGK |
|---|---|---|---|
| IIAGlc inhibition | |||
| K0.5, µM | 6.3 (5.3, 7.4) | 2.5 (1.3, 3.8) | 19 (10, 28) |
| W | 0.07 (0.03, 0.12) | 0.38 (0.32, 0.43) | 0.13 (0, 0.28) |
| MgATP-IIAGlc allosteric coupling |
|||
| Vo, mM s−1 | 19.3 (18.8, 19.8) | 1.9 (1.8, 2) | 22.8 (22.1, 23) |
| KATPo, µM | 12 (11.6, 14) | 230 (175, 280) | 14 (13,16) |
| KIIo, µM | 7 (5, 10) | 2 (0.7,3.4) | 28 (14, 41) |
| KII∞, µM | 4.6 (3.3, 5.9) | 1.8 (0.3, 3.3) | 8 (2, 13) |
| Q | 1.5 (0.9, 2.2) | 1.1 (0.6, 1.6) | 3.6 (1.9, 5.3) |
| W | 0.03 (0.01, 0.05) | 0.53 (0.45, 0.6) | 0.18 (0.15, 0.21) |
| Initial-velocity2 | |||
| KATP, µM | 9 (8, 11) | 153 (104, 201) | 15 (11,19) |
| KiATP, µM | 54 (31, 76) | 157 (107, 206) | 34 (17, 51) |
| Kgol, µM | 5 (3, 7) | 40 (33, 46) | 15 (11, 19) |
| Kigol, µM | 30 (18, 42) | 41 (19, 64) | 34 (17, 51) |
| KLgol, µM | 45±6 | 66±18 | 24±5 |
| Substrate Binding Stoichiometry, 3 mol/mol subunit |
|||
| ATP | 0.4±0.3 | 0.5±0.1 | nd |
| glycerol | 1.2±0.1 | 1.0±0.1 | nd |
| FBP inhibition | |||
| K0.5, µM | 630 (540, 720) | 470 (440, 500) | Not inhibited |
| W | 0.02 (0, 0.07) | 0.06 (0.03, 0.08) | |
| nH | 1.6 (1.3, 1.9) | 1.3 (1.2, 1.4) | |
| Sedimentation coefficients |
|||
| S20,w | 11.3±0.1 | 10.5±0.1 | 9.0±0.1 |
| S20,w + FBP | 11.4±0.1 | 11.2±0.1 | 10.1±0.1 |
Parameters were estimated by fits to the respective equations as described in the text with uncertainties given as 95% confidence limits shown in parenthesis or following the ± symbol, except as noted.
Parameters for EGK from [33] and for A65T EGK from [42]. KLgol was obtained from protection from inactivation by NEM with uncertainties given as the standard deviations. nd, not determined.
Ligand binding stoichiometries were determined as described under Materials and Methods. The uncertainties are shown as standard deviations.
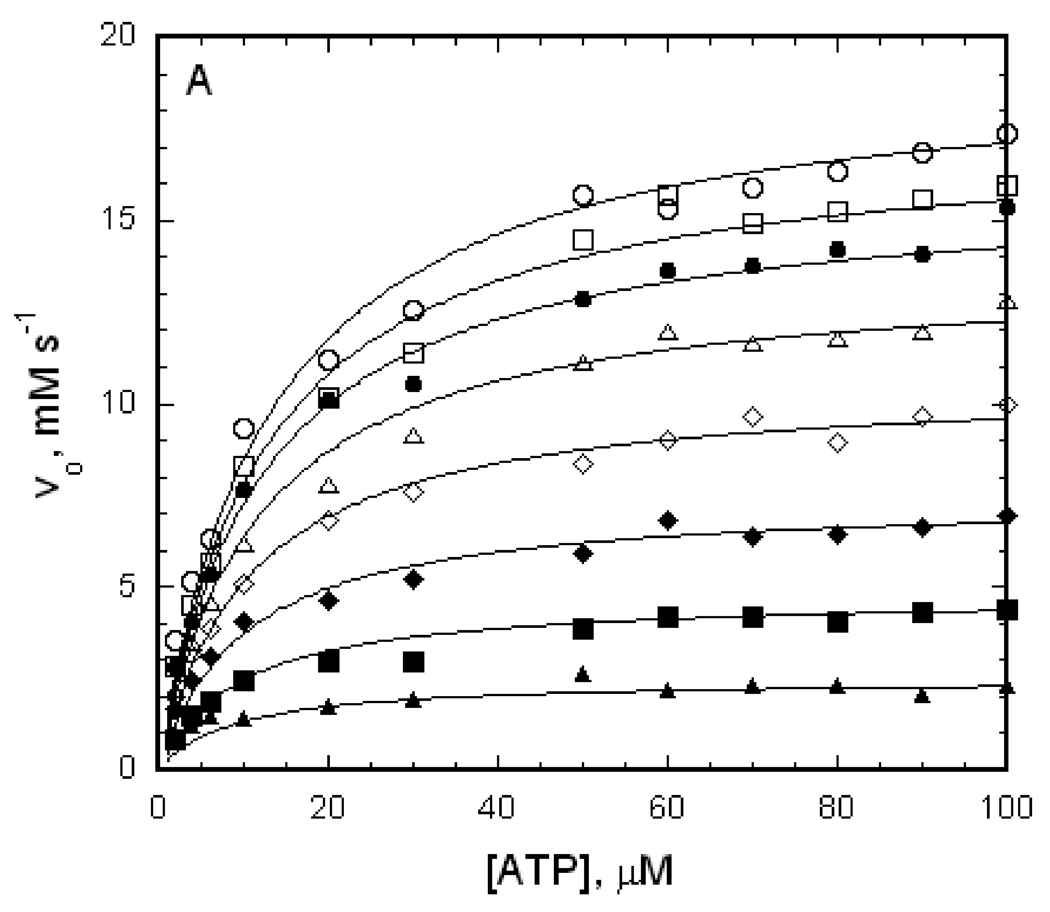
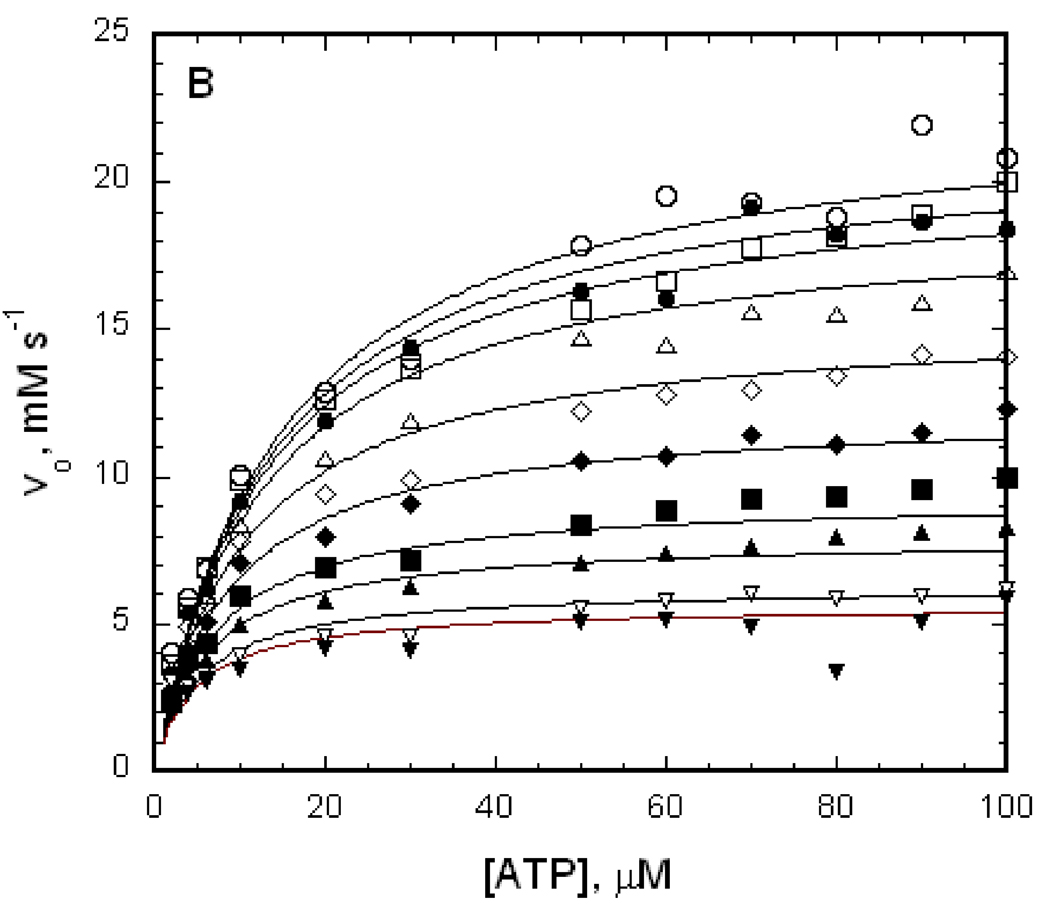
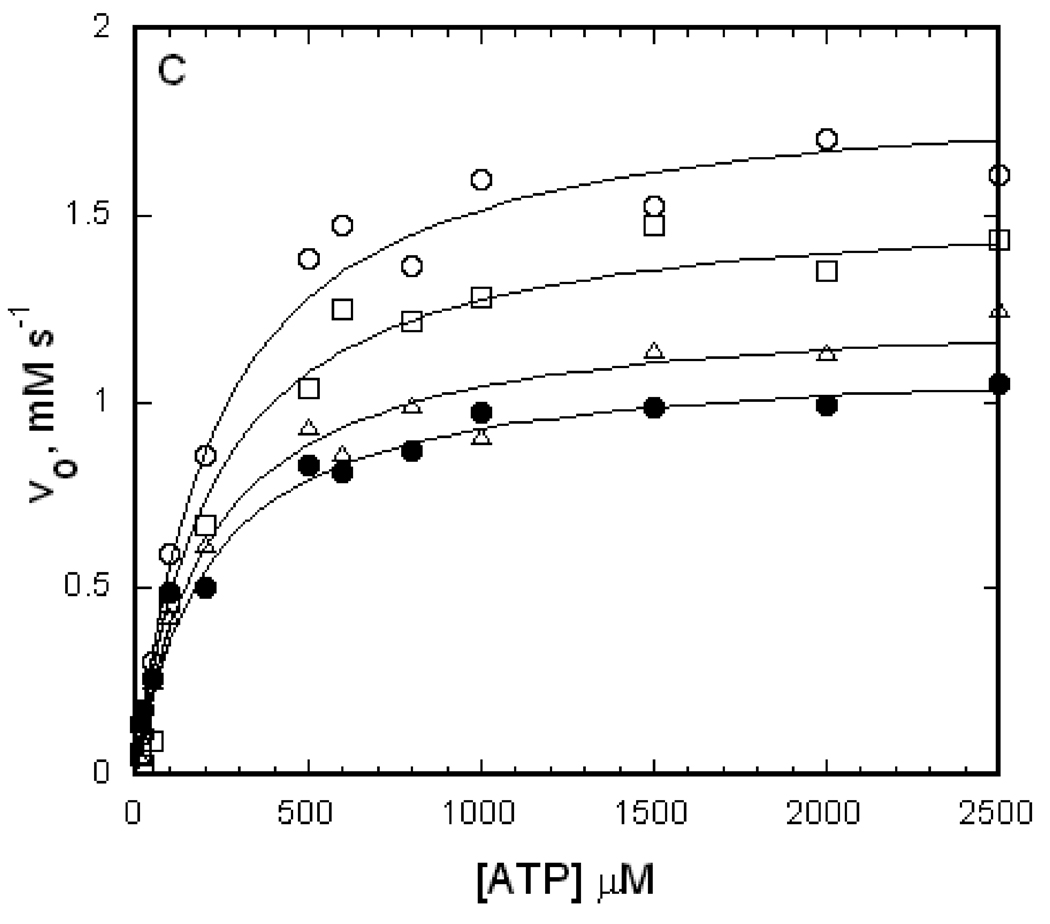
The IIAGlc inhibition that is shown in figure 3 provides a value for the allosteric coupling parameter W but not for the coupling parameter Q. Both of these allosteric coupling parameters are obtained from linked-functions analysis of initial-velocity enzyme kinetics data in the context of the linkage scheme that is shown in figure 2. Initial-velocity kinetics data as a function of MgATP concentration at different fixed concentrations of IIAGlc for EGK, A65T EGK, and R369A EGK are shown in figure 4. For each enzyme, addition of IIAGlc reduces the reaction velocity at all concentrations of the varied substrate MgATP, as expected from the results seen in figure 3.
Figure 4.
Effects of IIAGlc on initial velocities for EGK, A65T EGK, and R369A EGK. The points show initial velocities that are measured at the ATP concentrations shown with enzyme concentrations as in Figure 3. The open circles show the initial velocities in the absence of IIAGlc, and the remaining symbols show the initial velocities when IIAGlc is added to the assay at the concentrations (µM) indicated below, increasing from the upper curve to the lower curve of each figure. The lines show the fits of the data to equation 2 yielding the parameters in Table 1. (A) EGK, IIAGlc: 0.5, 1, 2, 4, 8, 16, 40. (B) A65T EGK, IIAGlc: 0.5, 1, 2, 5, 10, 20, 30, 60, 90. (C) R369A EGK, IIAGlc: 1, 4, 10.
The solid lines in figure 4 show the best fit of the data to equation 2 and the parameters from the fits are presented in Table 1. The good agreement of the fitted lines with the data points in figure 4 and the ranges for the confidence limits for the parameters in Table 1 show that the data are well-described by equation 2. The A65T substitution does not much alter the parameters Vo and KATPo while the R369A substitution reduces Vo and increases KATPo substantially. The domain-bridging interactions of R369 are thus necessary for efficient catalysis and for optimal interactions of MgATP with the EGK-glycerol complex. The allosteric coupling parameters Q and W and the dissociation constant for binding of IIAGlc in the absence of ATP, KIIo, are well-determined for all three enzymes. The allosteric coupling parameters Q for EGK and R369A EGK are near 1, showing weak coupling between MgATP and IIAGlc. The value for Q may be increased slightly by the A65T substitution but the increase is not significant at the 95% confidence level. The allosteric coupling parameter W for EGK is greater than zero, showing that IIAGlc binding results in partial inhibition as expected for allosteric inhibition. The A65T and R369A amino acid substitutions increase W, showing reduced inhibition. The dissociation constant for IIAGlc binding to the enzyme-glycerol complex in the absence of MgATP, KIIo, shows small changes for the variant enzymes; it is decreased by the R369A substitution and increased by the A65T substitution.
Confidence in the parameters that are estimated from the linked-functions analysis is increased by their agreement with independent determinations of coupling parameters, KATPo, and glycerol binding affinity. As shown by the definitions of the allosteric coupling parameters, the dissociation constant for binding of IIAGlc in the saturating presence of MgATP, KII∞, is given by KIIo/Q. The calculated values for KII∞ are shown in Table 1. They correspond to K0.5 that is obtained independently from measurement of IIAGlc inhibition at saturating concentrations of MgATP that is shown in figure 3. The allosteric parameters KII∞ and W that are obtained by using equation 2 agree well with K0.5 and W that are obtained independently from the IIAGlc concentration dependence of enzyme activity by using equation 1. The agreement between parameters that are obtained independently by varying the concentration of MgATP or IIAGlc indicates that the data are internally consistent.
The values for KATPo that are estimated from the linked-functions analysis agree well with those obtained independently from initial-velocity studies in which both substrates are varied, which are shown in Table 1. The values that are shown for EGK and A65T EGK were determined previously by using different enzyme preparations, reagents, and instrumentation [38, 42]. The Michaelis constants for each substrate are smaller than the respective dissociation constants for the EGK and A65T EGK enzymes but both constants are the same for the R369A EGK enzyme.
The affinity for glycerol binding was determined independently from chemical modification experiments using NEM. EGK is inactivated by NEM, and dissociation constants for substrate binding, KL, can be determined from the substrate concentration dependence of the pseudo first-order rate constant [43]. The R369A EGK and A65T EGK enzymes show similar inactivation and protection by substrates, allowing independent determination of the dissociation constant KL,gol for glycerol binding to these enzymes. The values for KL,gol that were determined for all three enzymes are shown in Table 1. The value shown for EGK agrees well with previous results, and the value of this independently determined dissociation constant for each enzyme agrees well with the corresponding parameter, Kigol, that is estimated from initial-velocity studies. The R369A substitution does not significantly change the affinity for glycerol and the A65T substitution increases the affinity slightly.
Effects of the substitutions on apparent non-equivalent catalytic sites
For EGK, the dependence of the initial reaction velocity on the concentration of MgATP shows complex behavior [38]. Over the range of MgATP concentrations from 0–5 mM, two apparent classes of catalytic sites with Michaelis constants for MgATP of about 5–10 µM and 2 mM are observed, as well as apparent substrate inhibition with a Ki greater than 5 mM. The low apparent affinities for the second MgATP and inhibitory sites make reliable parameter estimation problematical. However, as shown above for EGK and the A65T EGK enzymes, the initial-velocity data show Michaelis-Menten behavior for MgATP concentrations below 100 µM and catalytic parameters can be reliably determined. Binding of ATP to EGK shows half-of-the-sites binding stoichiometry [38]. The complex initial-velocity kinetics behavior and ATP binding stoichiometry are consistent with non-equivalent catalytic sites, and evidence for non-equivalence is seen in the crystal structures of the S58W [24] and G230D [44] enzymes. In contrast to EGK, the initial velocity for the R369A EGK enzyme displays hyperbolic dependence on MgATP concentrations up to 2.5 mM (figure 4C). This result may indicate that R369 has a role in establishing the non-equivalent sites or the substitution increases the Michaelis constant for the apparent second site.
To evaluate these possibilities, the binding stoichiometries for ATP and glycerol for EGK and the R369A EGK enzyme were determined as described under Materials and Methods and the results are shown in Table 1. Glycerol binds with a stoichiometry of 1 mol/mol subunit while ATP shows half-of-the-sites stoichiometry of 0.5 mol/mol subunit for both enzymes. The R369A amino acid substitution thus does not alter substrate binding stoichiometry. This result indicates that the R369A substitution increases the Michaelis constant for the apparent second MgATP site so it is not populated at concentrations that are used in the assay and interactions with the R369 sidechain are not required for establishing the non-equivalent catalytic sites.
Effects of the substitutions on FBP allosteric inhibition and tetramer formation
Parameters for allosteric inhibition of the three enzymes by FBP are shown in Table 1. FBP inhibition of EGK is strongly cooperative and is incomplete (W>0) as expected for allosteric effects. The A65T substitution abolishes allosteric inhibition by FBP under initial-velocity assay conditions, in agreement with earlier work [42]. The R369A amino acid substitution has small effects on FBP allosteric inhibition. The value for K0.5 is reduced slightly, while the values for W and the Hill coefficient are increased slightly, although these increases are not significant at the 95% confidence level. The apparent lack of effect of the R369A substitution on FBP inhibition may indicate compensation by differences of oligomeric state resulting from differences of enzyme concentrations in the assays for EGK (9 nM (subunits)) and R369A EGK (72 nM (subunits)), which are necessary due to the large reduction of Vo for R369A EGK. Alternatively, the inhibition may be robust to the substitution because clamping of the tetramer by binding of FBP overcomes the effects of the substitution.
The FBP inhibition that is observed for the R369A EGK enzyme is consistent with tetramer formation under initial velocity assay conditions while the lack of FBP inhibition for the A65T EGK enzyme indicates that tetramer formation under initial velocity assay conditions is negligible. Sedimentation velocity analytical ultracentrifugation was used to assess the effects of the amino acid substitutions on the oligomeric states of the enzymes. The sedimentation coefficients S20,w were determined at concentrations of about 5 µM (subunits) (Table 1). The sedimentation coefficient for EGK is about 11.3 S, which agrees with earlier work [45] and with the value of 11.5 S that is calculated from the tetramer structure by using the computer program HYDROPRO [46]. Addition of 5 mM FBP does not change the sedimentation coefficient, indicating that the oligomeric state of EGK is predominantly tetrameric at this protein concentration in the absence of FBP. The sedimentation coefficient for A65T EGK is reduced substantially, as expected from earlier gel permeation chromatography results showing that the substitution reduces tetramer formation [42]. The A65T substitution does not eliminate tetramer formation at this protein concentration; the observed sedimentation coefficient of 9 S is larger than the value of 6.6 S that is predicted for the dimer by using the computer program HYDROPRO. Addition of 5 mM FBP increases the sedimentation coefficient but not to that of the tetramer. The A65T EGK enzyme forms tetramers in the absence of FBP at the higher protein concentrations in the crystal [21]. The R369A amino acid substitution reduces tetramer formation as shown by the sedimentation coefficient of 10.5 S. Addition of 5 mM FBP shifts the oligomeric state to the tetramer, as shown by the sedimentation coefficient of 11.2 S. The R369A amino acid substitution thus reduces tetramer formation but not to the extent that is observed for the A65T substitution, and addition of FBP is able to restore tetramer formation for the R369A EGK enzyme.
Identification of the EGK functional dimer
The dimer-tetramer dissociation constant for EGK is about 60 nM (subunits) [40], and the ultracentrifugation results show that the dissociation constants for A65T EGK and R369A EGK are larger. At the low protein concentrations in the initial-velocity assays, the dimer is the dominant species for these enzymes. Although dissociation of EGK tetramers to dimers is well-established, the identity of the functional dimer is not. Experimental observations for homotetrameric proteins show that tetramer assembly-dissociation occurs along only one of the two possible interfaces with formation of only one of the two possible homodimer species [47]. As seen in figure 1, the EGK tetramer may dissociate along the vertical interface that contains the FBP-binding sites or along the horizontal interface that contains the mini domain-swap loops. The first case yields what is termed the OY functional dimer and the second case yields the OX functional dimer. The mode of action of the mini domain-swap loop in IIAGlc inhibition is dependent on the identity of the functional dimer. Dissociation to OY dimers does not remove the mini domain-swap loops from the clefts. Dissociation to OX dimers results in the complete removal of the loop of one subunit from the cleft of the other and suggests that IIAGlc-driven tetramer formation is necessary for inhibition.
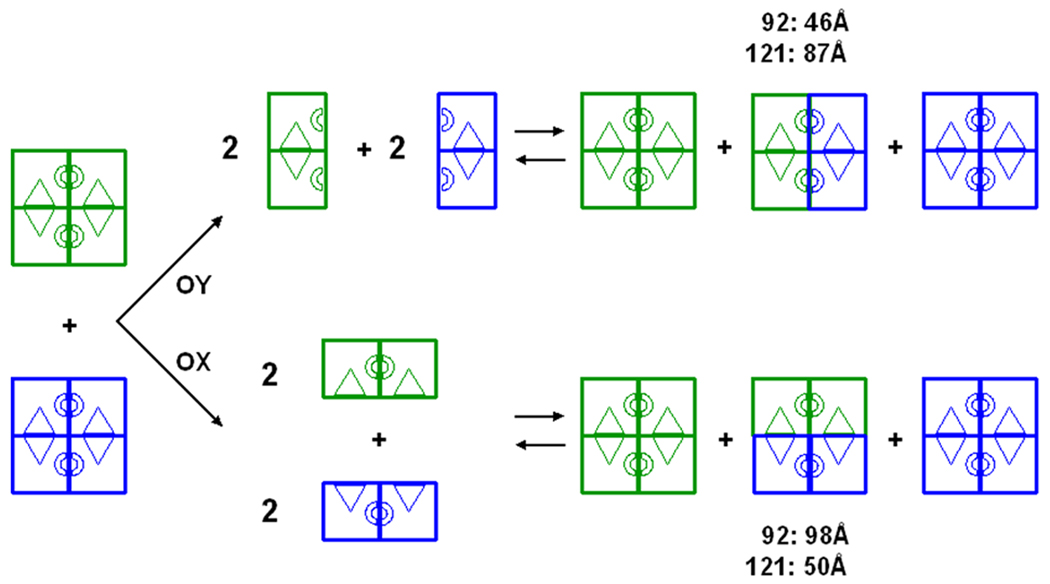
The functional dimer for EGK is identified here by using FRET between extrinsic fluorophores that are covalently conjugated to non-native surface cysteine residues, an approach similar to that used for studies of GroEL-GroES assembly [48]. The basis for the experiment is shown schematically in figure 5. Upon mixing of samples that are separately labeled with fluorescence donor (dansyl) or acceptor (fluorescein), tetramer disproportionation is expected to produce a population that includes hybrid tetramers with donor and acceptor on different dimers of the same molecule. When the distance between the donor and acceptor is near the Förster distance for the dansyl-fluorescein pair (46–56 Å [49]), FRET should be observed. The amino acid residues E92 and E121 were selected as sites for the non-native cysteine substitutions, and the distances between the sites on different subunits are given in the legend for figure 1. The distance between the E92C sites in the O and X subunits is near the Förster distance and the distance between these sites in the O and Y subunits is much greater. The converse is true for the E121C sites. Figure 5 shows that FRET is predicted for the E92C variant, but not for the E121C variant, for dissociation to the OY functional dimer and conversely for dissociation to the OX functional dimer.
Figure 5.
Identification of the functional dimer for EGK by FRET. Disproportionation reactions for tetramers that are labeled with fluorescence donor (blue) or acceptor (green) are shown schematically. Upon mixing these tetramers, disproportionation that proceeds via dissociation to give either OY dimers or OX dimers is shown by the upper and lower pathway, respectively. Reassociation of labeled dimers in each case yields the mixed tetramer populations of donor-only, donor+acceptor, and acceptor-only on the right-hand side, which are expected to be present in the ratio 1:2:1. For the donor+acceptor species, the distances (Å) between the donor and acceptor for the E92C (92) and E121C (121) EGK variants are shown for each pathway.
The E92C EGK and E121C EGK enzymes were constructed and purified as described under Materials and Methods. The substitutions have little effect on catalytic and allosteric properties, which are shown in Table 2. Specific labeling of the non-native cysteine residues was shown by using OG-modified enzyme. The enzymes were incubated with IAOG as described under Materials and Methods; under these conditions, the stoichiometry of OG conjugation was 0.67 mol OG/mol E92C subunit and 0.53 mol OG/mol E121C subunit. OG-labeled tryptic peptides were isolated and their masses were determined by using MALDI-TOF, with the results that are shown in Table 2. The E121C EGK gives a single OG-labeled peptide with the mass that is predicted for the modified non-native cysteine-containing peptide. The E92C EGK gives two OG-labeled peptides. One of these peptides has the mass that is predicted for the expected peptide. The second peptide has the mass that is predicted for the peptide that results from missed cleavage of the Lys95-Pro96 bond. These results show that the non-native cysteine residues are specifically labeled by the extrinsic fluorophore.
Table 2.
Functional and Molecular Properties for FRET Variants1
| Parameter | EGK E92C | EGK E121C |
|---|---|---|
| Initial-velocity | ||
| Vo, mM s−1 | 15±1 | 20±1 |
| KATPo, µM | 12±3 | 10±2 |
| IIAGlc inhibition | ||
| K0.5, µM | 3±0.5 | 6±0.6 |
| W | 0.09±0.02 | 0.09±0.02 |
| FBP inhibition | ||
| K0.5, µM | 390±15 | 640±50 |
| W | 0.01±0.01 | 0.05±0.03 |
| nH | 1.4±0.1 | 1.7±0.1 |
| S20,w | ||
| Native | 11.2±0.1 | 11.1±0.1 |
| Fluorescein-labeled | 11.1±0.1 | 11.0±0.1 |
| Dansyl-labeled | 11.1±0.1 | 11.0±0.1 |
| Peptide positions | 92–95 92–106 | 118–125 |
| Peptide mass, predicted | 831.2 2232.9 | 1377.5 |
| Peptide mass, observed | 831.3 2232.9 | 1377.4 |
Parameters were estimated from fits of functional data to the respective equations as described under Materials and Methods.
For FRET studies, the E92C EGK and E121C EGK enzymes were labeled with fluorescence donor or acceptor as described under Materials and Methods by using IAEDANS or IAF. Under these conditions, the stoichiometry of fluorophore conjugation is 0.75±0.01 mol dansyl/mol subunit or 0.46±0.01 mol fluorescein/mol subunit for each enzyme. Separate samples of each enzyme were labeled with donor or acceptor and the labeled enzymes were used to prepare three samples for measurement of spectra: donor+acceptor (D+A), donor-only (D), acceptor-only (A). The D+A sample was prepared by mixing equimolar amounts of donor- and acceptor-labeled enzymes to give a total enzyme concentration of 1 µM (subunits). For the separate D and A samples, an equimolar amount of unlabeled enzyme was added so that the total concentrations of protein and the respective label were the same as in the D+A sample.
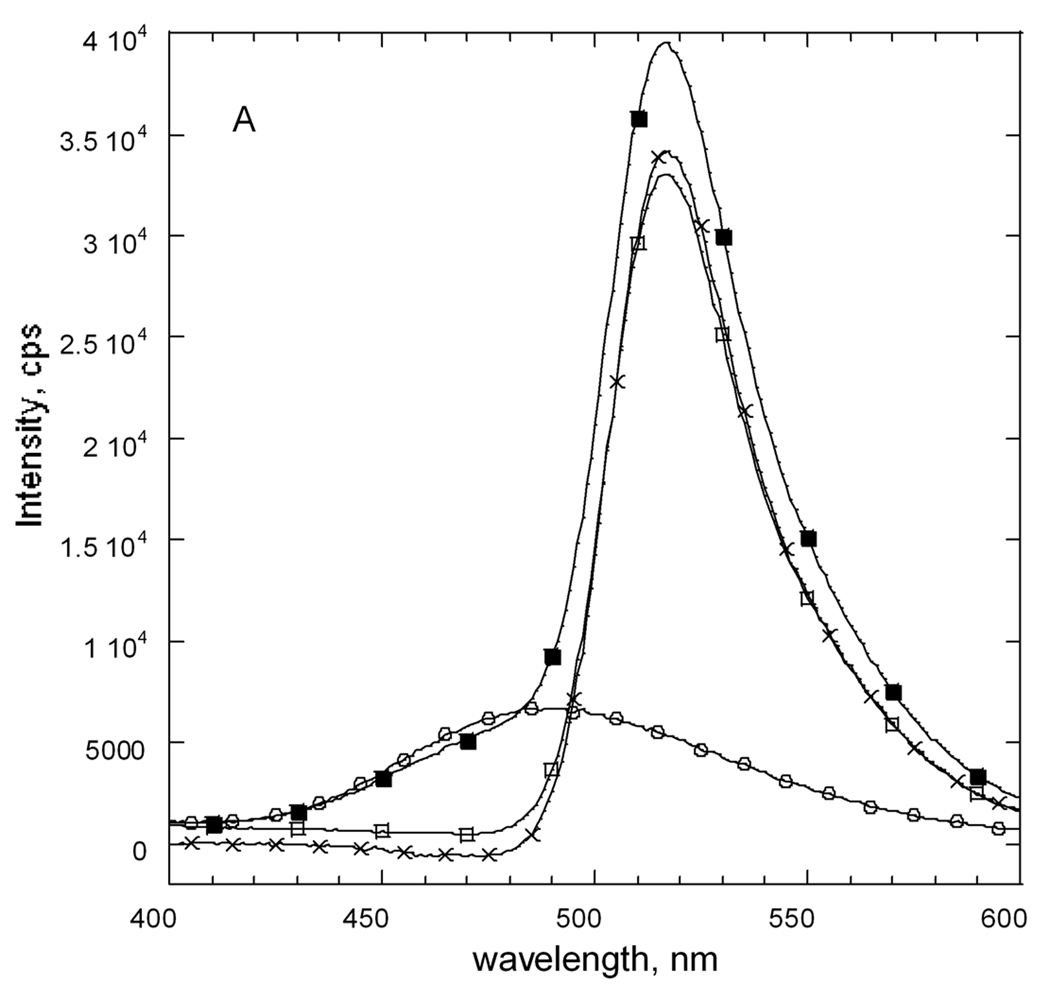
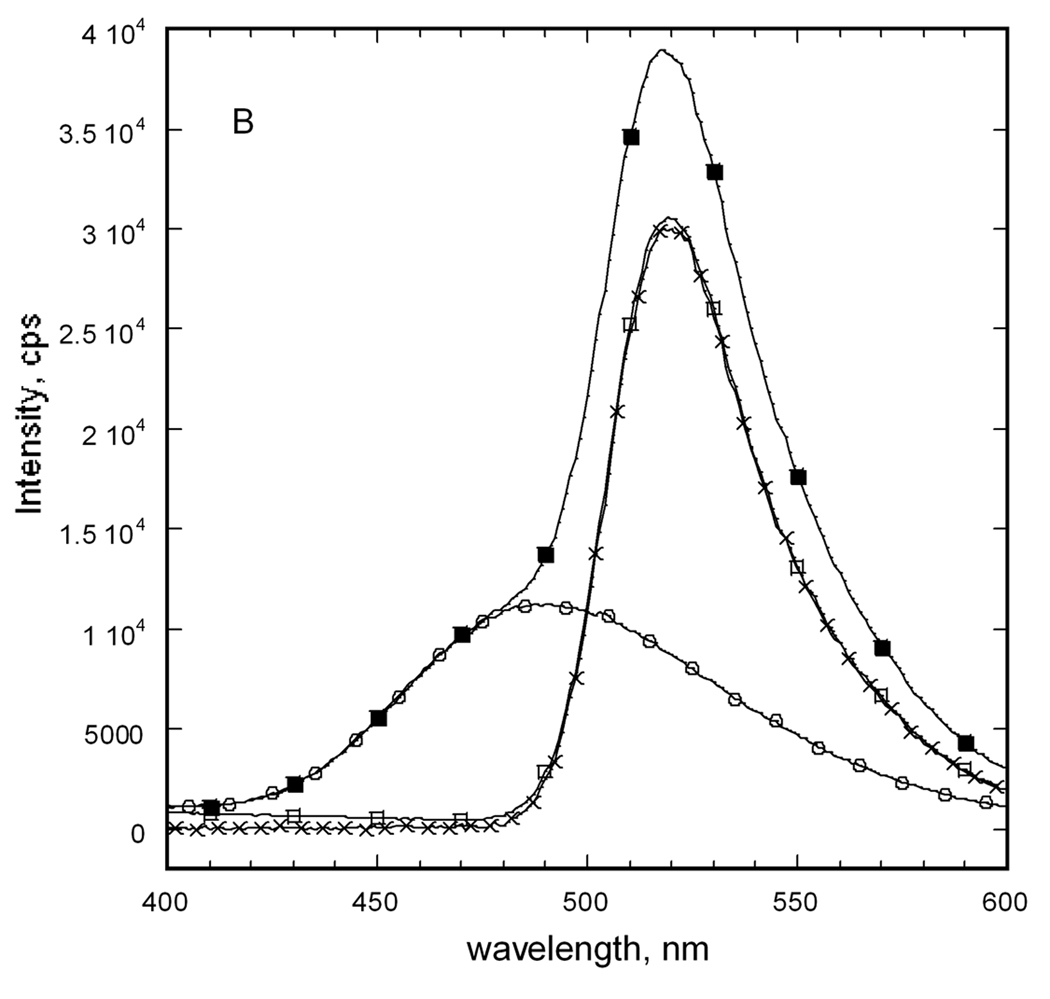
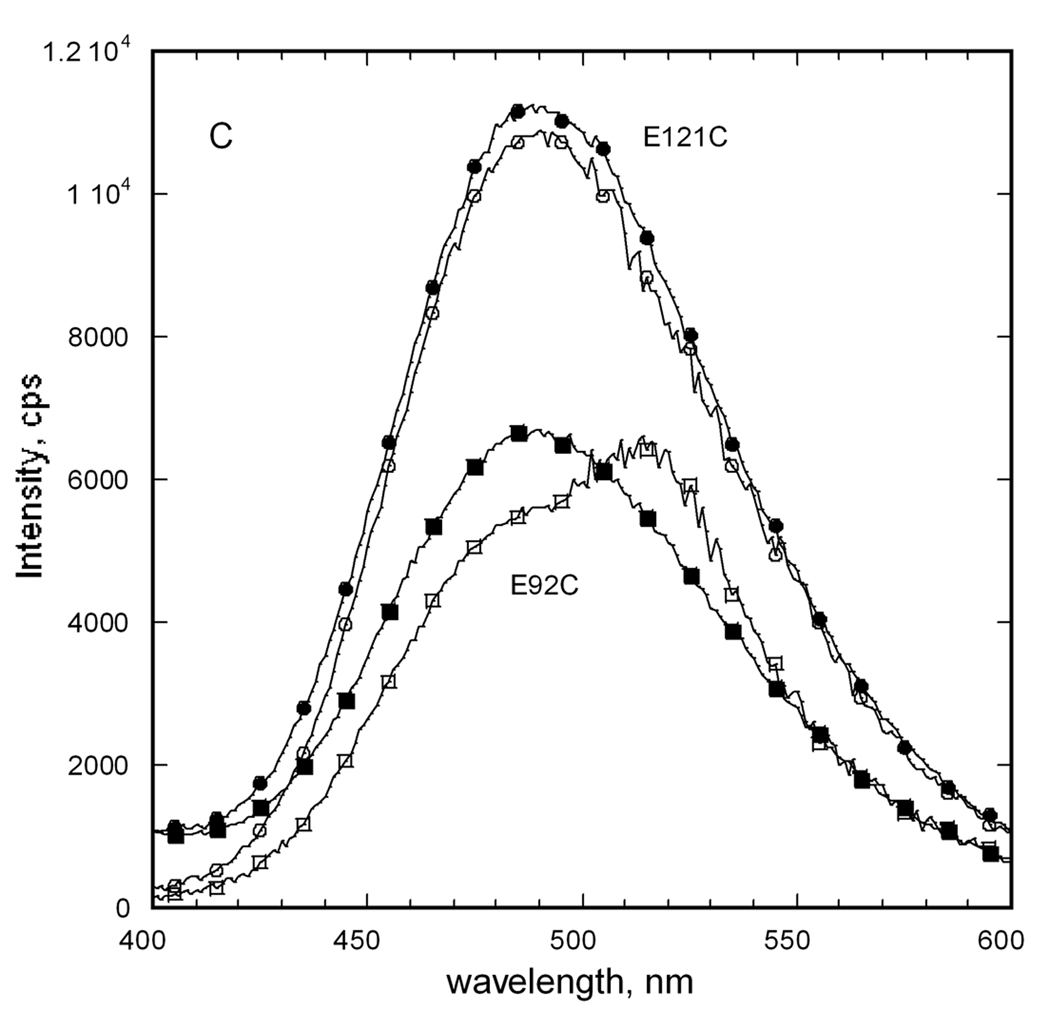
Figure 6 shows emission spectra that were obtained for the fluorescently-labeled E92C and E121C variant enzymes. For each enzyme, the wavelength of maximum emission for the D (~480 nm) or A (~520 nm) sample agrees well with those reported for GroEL-GroES [48]. Although the stoichiometry for labeling by donor or acceptor is the same for each enzyme, the emission intensity for donor or acceptor is not the same. The donor emission is increased 1.6-fold for the E121C EGK versus the E92C EGK and the acceptor emission for E92C EGK is 1.1 times that for E121C EGK. The fluorophore environments of the conjugation sites are thus not the same.
Figure 6.
Fluorescence emission spectra for E92C and E121C EGK labeled with extrinsic fluorophores. Separate samples of each enzyme were labeled with dansyl as fluorescence donor, D, or fluorescein as fluorescence acceptor, A, as described in the text. The labeled proteins were mixed with equimolar concentrations of unlabeled protein or the other labeled protein to a total protein concentration of 1 µM (subunits). Emission spectra were recorded with an excitation wavelength of 336 nm. (A) E92C EGK. (B) E121C EGK. Legend: D, circles; A, open squares; D+A, filled squares; acceptor difference spectrum ((D+A) − D), X. (C) Donor difference spectra. Filled symbols show spectrum for D and open symbols show the donor difference spectrum ((D+A) − A). E92C, squares; E121C, circles.
The spectrum that is obtained for the D+A sample for each enzyme shows the presence of each fluorophore. For the E121C enzyme, the emission spectrum for the D+A sample agrees well with the sum of the individual spectra. This result is seen from comparison of the acceptor difference spectrum ((D+A) − D) in figure 6B or the donor difference spectrum ((D+A) − A) in figure 6C with the spectrum for the A or D sample, respectively. The emission intensities of both difference spectra are reduced about 400 cps relative the respective spectrum for A or D. This small change amounts to a 4% or 1% decrease in emission intensity for the donor or acceptor, respectively, in the D+A sample versus the D or A sample. Although the reduced donor emission is consistent with FRET, the reduced acceptor emission is not and indicates that FRET is not observed for the E121C EGK. This conclusion is supported by the results that are obtained for the E92C EGK.
For the E92C enzyme, the D+A spectrum does not agree with the sum of the individual spectra, showing reduced donor intensity and increased acceptor intensity that is consistent with FRET. Reduced donor intensity for the wavelength range 450–485 nm is seen in figure 6A in the spectrum of the D+A sample relative to the spectrum for D. The acceptor difference spectrum in figure 6A shows this reduction as negative intensities. The donor difference spectrum in figure 6C for E92C EGK shows a decrease in emission at 490 nm of 1100 cps, a 25% reduction of donor emission. It also shows increased intensity at 520 nm of 1200 cps (23%). The acceptor difference spectrum shows the same increased emission at about 520 nm of about 1200 cps, a 4% increase. The observation of tetramer-disproportionation dependent FRET for the E92C EGK but not for the E121C EGK establishes OY as the functional dimer.
The changes of emission intensities are similar to those reported for the FRET seen for ATP-dependent assembly of GroEL-GroES [48]: 10% reduction of donor emission and 6% increase of acceptor emission. For GroEL-GroES and the experiments that are presented here, less-than-stoichiometric labeling with fluorophores contributes to the small intensity changes for FRET. The scheme in figure 5 depicts the case for stoichiometric labeling with each fluorophore. For sub-stoichiometric labeling, additional hybrid tetramers that lack the donor or acceptor on the site that is within the Förster distance will be formed. For EGK, two additional factors contribute to the small intensities: (1) The D+A hybrid tetramers represent only one-half of the total tetramer population because of the binomial distribution of tetramers that is expected to be formed by the disproportionation reaction. (2) If the dimer-tetramer dissociation constant for these enzymes is the same as that of EGK, only 80% of the enzyme is present as tetramer at the protein concentration of these experiments. Although these issues would substantially complicate attempts to measure distances between the fluorophores from the efficiencies of FRET, they do not complicate identification of the functional dimer on the basis of whether FRET is observed.
Discussion
Loss of side chain interactions from the R369A substitution reduces allosteric inhibition by IIAGlc but does not affect that by FBP. Although the substitution increases the affinity for binding of IIAGlc, it reduces the ability of IIAGlc to inhibit EGK at saturating substrate concentrations as shown by the increased allosteric coupling parameter W for the R369A EGK relative to EGK. The substitution also reduces Vmax and affinity for MgATP, showing that it perturbs the catalytic cleft conformational change and IIAGlc inhibition is related to the cleft closure. Despite its allosteric site being located in only domain II about 30Å from the catalytic site, inhibition by IIAGlc requires interactions with both domains that are mediated by at least one of the amino acid residues in the mini domain-swap loop. The loop from one subunit is thus part of an allosteric network for IIAGlc inhibition of the other subunit and communicates binding of IIAGlc at its distal site on domain II across the catalytic cleft to domain I. The basis for communication from the IIAGlc-binding site through domain II to the loop remains to be established. The FRET experiments establish OY as the functional dimer, so the loop remains associated with the catalytic cleft of each subunit upon tetramer dissociation. The loop from one subunit interacts with both domains of the other subunit in a manner that is reminiscent of heterotropic allosteric effectors of monomeric superfamily members. This surrogate heterotropic allosteric effector role for the loop supports the importance of interactions with both domains for modulation of the catalytic properties of superfamily members and shows that oligomeric interactions may provide alternatives to direct steric modes of effector action.
The R369A substitution has very little effect on allosteric inhibition by FBP. This result indicates that either R369 is not part of the FBP allosteric network or that network is robust to this substitution. A degree of independence between IIAGlc and FBP allosteric controls is expected on the basis of the complete separation of their binding sites. Amino acid substitutions that alter allosteric control by one ligand with little effect on that of the other have been identified [50]. The closely-related E. casseliflavus GK is activated by phosphorylation at a site that corresponds to the FBP binding site of EGK. A communications network for this activation is postulated from crystal structures [51], and R369 is not an element of this network. However, because R369 is located at the catalytic site cleft and the R369A substitution has a substantial effect on catalysis, it seems unlikely that this locus is not part of an FBP allosteric network. This consideration supports robustness as the basis for the lack of effect on FBP inhibition. The structure of the EGK-FBP complex shows that two molecules of FBP bind to the tetramer, one at each pole [20]. This mode of binding could drive long range clamping interactions that compensate substantially for the lost R369 interactions and account for the robustness of the FBP allosteric network. This clamping mode could act like the squeeze chute that is used to restrain livestock. The coupling free energy between binding of FBP and tetramer formation is −5 kcal/mol [40]. This apparent long-range steric interaction mode of action may be analogous to that of the latent state of Ca2+/calmodulin-dependent protein kinase II, for which the oligomeric structure is two stacked dodecameric rings of subunits [52]. This kinase appears to be auto-inhibited by oligomeric interactions that involve contacts between neighboring N-lobes and between helical extensions from the C-lobes that constrain the relative motions of the lobes within each subunit. Analogous oligomeric interactions within the EGK tetramer appear to have key roles in allosteric networks that allow FBP binding to a single domain to inhibit catalysis.
For both EGK and R369A EGK, IIAGlc inhibition arises entirely from effects on Vmax. The values of the allosteric coupling parameter are between 1 and 2, showing very weak coupling between binding of MgATP and IIAGlc. The small coupling that is observed reflects cooperative interactions, which are associated with activation in classical K-type allosteric enzymes [53–57]. An important practical consequence of this V-type allosteric control for IIAGlc is that comparison of only the two complexes that are formed in the saturating presence of ATP and glycerol in the absence or presence of saturating IIAGlc should reveal structural changes that are associated with inhibition. Comparison of these structures by using X-ray crystallography has not revealed these changes, probably because of the effects of crystal packing forces. However, solution methods such as those using extrinsic fluorophores may be useful for such studies.
The lack of effect of the R369A substitution on glycerol binding affinity has important ramifications for the catalytic site conformational change. The interactions of R369 do not have roles in glycerol binding but reduce Vmax and affinity for MgATP substantially. These results indicate that the catalytic site closure occurs in two stages with the second, R369-dependent stage associated with MgATP binding and catalysis. This conclusion is consistent with different stages of closure observed in crystal structures of the G230D EGK [44], which are believed to indicate that glycerol binding alone is not sufficient to drive the closure that is required for catalysis.
Although the R369A substitution decreases the apparent affinity for MgATP and increases the apparent affinity for IIAGlc, it does not alter the allosteric coupling between the binding of these two ligands. This conclusion is shown by the same allosteric coupling parameter Q for both EGK and R369A EGK. The A65T substitution does not change the apparent affinity for MgATP and reduces the apparent affinity for IIAGlc, while the allosteric coupling between MgATP and IIAGlc is perhaps increased. These results demonstrate again the absence of correlations between ligand binding affinity and allosteric coupling, which is seen also for the effects of amino acid substitutions in the conserved ATPase core of EGK [31] and for bacterial phosphofructokinases [56, 58]. The lack of such correlations is expected within the context of the linkage scheme in figure 2, which shows no requirement for a specified relation between ligand binding affinity and allosteric coupling.
The FRET experiments establish OY as the functional dimer for EGK, and this result is consistent with earlier observations. On the basis of the relative solvent inaccessible surface areas of the subunit-subunit interfaces, the OY dimer was postulated to be the functional dimer for EGK [1]. The sites of the S58W and A65T amino acid substitutions are located in the α-helix whose coiled-coil interaction forms much of the OX and YZ interfaces (figure 1), and these substitutions reduce tetramer formation in solution and abolish FBP inhibition [21, 24, 42]. Glycerol kinases from T. kodakaraensis, and P. falciparum, as well as xylulokinase from E. coli, are OY dimers in the crystal structures [27–29]. However, on the basis of its crystal structure, dissociation of the tetramer of the glycerol kinase from E. casseliflavius is postulated to give the OX dimer [26]. This enzyme from a Firmicutes organism is activated by phosphorylation by the PTS phosphocarrier protein HPr, and the OX interface has key roles in the communications network by which the structural changes driven by phosphorylation are postulated to reach the catalytic site [51]. Hence, although its structure is very similar to that of EGK, tetramer dissociation properties of this glycerol kinase may be different because of its different functional properties.
Key roles in catalysis for interactions that are disrupted by the R369A substitution are consistent with results seen for other catalytic cleft interactions. Aspartate 10 is a highly-conserved active site amino acid in the superfamily whose role in catalysis is binding of the Mg(II) ion of MgATP. It is located in domain I while the MgATP binding site is located in domain II. Thus, the interaction between aspartate 10 and MgATP also bridges the domains. The D10N substitution reduces catalysis substantially and reduces IIAGlc inhibition [59]. An interdomain salt bridge network of E83, R188, and E303 is conserved in bacterial glycerol kinases and the E83A substitution substantially reduces catalysis for a thermophilic enzyme [60].
In contrast to the results seen for the R369A substitution, the effects of the A65T substitution show that this site is essential for FBP inhibition. The A65T substitution was known to reduce tetramer formation and abolish FBP inhibition [42]. Those studies used Zn(II) to increase IIAGlc binding affinity and showed that the A65T substitution increased the apparent dissociation constant for IIAGlc binding by about three-fold with little effect on the extent of inhibition. A similar effect on IIAGlc binding affinity is obtained here without Zn(II) along with a significant reduction of IIAGlc inhibition. These results indicate the A65T substitution perturbs elements of a IIAGlc allosteric network. In addition to the effects on IIAGlc inhibition in the saturating presence of MgATP, the perturbations of this network may increase the allosteric coupling between binding of MgATP and IIAGlc slightly as seen by the small increase for Q. Because both EGK and the A65T EGK are predominantly dimeric at the enzyme concentrations that are used in the initial-velocity enzyme kinetics assays, it is unlikely that the effects of the A65T substitution on IIAGlc inhibition arise from differences in oligomeric state per se. It is rather more likely that these effects result from conformational changes within domain I due to the substitution. This conclusion is supported by the differences of catalytic parameters for the A65T EGK relative to EGK.
For both the sugar kinase/actin/hsp70 superfamily and the protein kinase family, the catalytic site is located in a cleft that is formed between two protein domains and relative motions of the domains control catalysis. For protein kinases, a variety of allosteric control modes that are based on interactions with the conserved kinase core is seen. These modes include heterotropic allosteric effectors that interact with both domains for PKA (RI, inhibition) [61], CDK2 (cyclin, activation) [62], and Fus3 (Ste3, activation) [63]; homo-oligomeric interactions that involve both domains for EGFR (asymmetric homodimer: activation) [63]; intrachain interactions with both domains for PKA (activation) [64], Src family kinases (SH2-SH3, autoinhibition) [65], and CaMKI (C-terminal extension, autoinhibition) [66]; and intersubunit interactions of the N-lobes and of C-terminal extensions in dimers within the dodecameric CaMKII (autoinhibition) [63]. Allosteric interactions with a single domain of the kinase core are seen for TAK1-TAB1 (C-lobe, activation) [63], PKR (homodimer, N-lobe, activation) [63], and Csk-SH3 domain (N-lobe, activation) [65, 67]. These observations indicate that differences in conformations or motions that are associated with catalysis are elegantly exploited to enable its control. The variety of allosteric controls that are exerted on a conserved catalytic core structure that is seen for the protein kinases appears to occur also in the sugar kinase/actin/hsp70 superfamily, although many fewer variations are yet known.
Acknowledgments
This work was supported by NIH Grant GM068768 and by Texas AgriLife Research (formerly Texas Agricultural Experiment Station). The author thanks Alexander Holcombe, Kelsey Miller, and Pamela S. Miller for expert technical assistance; Dr. S. James Remington for providing the expression plasmid for R369A EGK; the Protein Chemistry Laboratory of Texas A&M University for peptide identification mass spectrometry services; the Gene Technologies Laboratory of Texas A&M University for DNA sequencing services; and Dr. Borries Demeler of the University of Texas Health Science Center-San Antonio for helpful discussions about analytical ultracentrifugation.
Footnotes
Publisher's Disclaimer: This is a PDF file of an unedited manuscript that has been accepted for publication. As a service to our customers we are providing this early version of the manuscript. The manuscript will undergo copyediting, typesetting, and review of the resulting proof before it is published in its final citable form. Please note that during the production process errors may be discovered which could affect the content, and all legal disclaimers that apply to the journal pertain.
Abbreviations used: IIAGlc, the glucose-specific phosphocarrier protein of the phosphoenolpyruvate:glycose phosphotransferase system (TC 4.A.1 (http://www.tcdb.org/)), also known as IIIglc and Crr; EGK, Escherichia coli glycerol kinase (EC 2.7.1.30; ATP:glycerol 3-phosphotransferase); A65T EGK, EGK with the A65T amino acid substitution; R369A EGK, EGK with the R369A amino acid substitution; FBP, fructose-1,6-bisphosphate; FRET, Förster resonance energy transfer; hsp70, heat shock protein 70; IAEDANS, (5-((((2-iodoacetyl)amino)ethyl)amino)naphthalene-1-sulfonic acid); IAF, 6-iodoacetamido fluorescein; IAOG, iodoacetamido OG; NEM, N-ethylmaleimide; OG, Oregon Green 488 (2’, 7’-difluorofluorescein).
Bibliography
- 1.Hurley JH, Faber HR, Worthylake D, Meadow ND, Roseman S, Pettigrew DW, Remington SJ. Science. 1993;259:673–677. [PubMed] [Google Scholar]
- 2.Hurley JH. Annu. Rev. Biophys. Biomol. Struct. 1996;25:137–162. doi: 10.1146/annurev.bb.25.060196.001033. [DOI] [PubMed] [Google Scholar]
- 3.Bennett WS, Steitz TA. J. Mol. Biol. 1980;140:211–230. doi: 10.1016/0022-2836(80)90103-5. [DOI] [PubMed] [Google Scholar]
- 4.Gerstein M, Lesk AM, Chothia C. Biochemistry. 1994;33:6739–6749. doi: 10.1021/bi00188a001. [DOI] [PubMed] [Google Scholar]
- 5.Lin ECC. In: Escherichia coliand Salmonella. Cellular and molecular biology. Neidhardt FC, editor. Washington, D.C.: ASM Press; 1996. pp. 307–342. [Google Scholar]
- 6.Brocklehurst KJ, Payne VA, Davies RA, Carroll D, Vertigan HL, Wightman HJ, Aiston S, Waddell ID, Leighton B, Coghlan MP, Agius L. Diabetes. 2004;53:535–541. doi: 10.2337/diabetes.53.3.535. [DOI] [PubMed] [Google Scholar]
- 7.Dominguez R. TIBS. 2004;29:572–578. doi: 10.1016/j.tibs.2004.09.004. [DOI] [PubMed] [Google Scholar]
- 8.Bukau B, Weissman J, Horwich A. Cell. 2006;125:443–451. doi: 10.1016/j.cell.2006.04.014. [DOI] [PubMed] [Google Scholar]
- 9.Kamata K, Mitsuya M, Nishimura T, Eiki J-i, Nagata Y. Structure. 2004;12:429–438. doi: 10.1016/j.str.2004.02.005. [DOI] [PubMed] [Google Scholar]
- 10.Liu Q, Hendrickson WA. Cell. 2007;131:106–120. doi: 10.1016/j.cell.2007.08.039. [DOI] [PMC free article] [PubMed] [Google Scholar]
- 11.Harrison CJ, Hayer-Hartl M, Di Liberto M, Hartl F-U, Kuriyan J. Science. 1997;276:431–435. doi: 10.1126/science.276.5311.431. [DOI] [PubMed] [Google Scholar]
- 12.Sondermann H, Scheufler C, Schneider C, Hohfled J, Hartl F-U, Moarefi I. Science. 2001;291:1553–1557. doi: 10.1126/science.1057268. [DOI] [PubMed] [Google Scholar]
- 13.Rosseau F, Schymkowitz J. Curr. Opin. Struct. Biol. 2005;15:23–30. doi: 10.1016/j.sbi.2005.01.007. [DOI] [PubMed] [Google Scholar]
- 14.Daily MD, Upadhyaya TJ, Gray JJ. Proteins. 2008;71:455–466. doi: 10.1002/prot.21800. [DOI] [PMC free article] [PubMed] [Google Scholar]
- 15.Liu T, Whitten S, Hilser VJ. Proc. Natl. Acad. Sci. USA. 2007;104:4347–4352. doi: 10.1073/pnas.0607132104. [DOI] [PMC free article] [PubMed] [Google Scholar]
- 16.Clarkson MW, Gilmore SA, Edgell MH, Lee AL. Biochemistry. 2006;45:7693–7699. doi: 10.1021/bi060652l. [DOI] [PMC free article] [PubMed] [Google Scholar]
- 17.Goodey N, Benkovic SJ. Nature Chem Biol. 2008;4:474–482. doi: 10.1038/nchembio.98. [DOI] [PubMed] [Google Scholar]
- 18.Suel G, Lockless S, Wall M, Ranganathan R. Nature Struct. Biol. 2003;10:59–69. doi: 10.1038/nsb881. [DOI] [PubMed] [Google Scholar]
- 19.Ackers GK, Smith FR. Annu. Rev. Biochem. 1985;54:597–629. doi: 10.1146/annurev.bi.54.070185.003121. [DOI] [PubMed] [Google Scholar]
- 20.Ormo M, Bystrom CE, Remington SJ. Biochemistry. 1998;37:16565–16572. doi: 10.1021/bi981616s. [DOI] [PubMed] [Google Scholar]
- 21.Feese MD, Faber HR, Bystrom CE, Pettigrew DW, Remington SJ. Structure. 1998;6:1407–1418. doi: 10.1016/s0969-2126(98)00140-3. [DOI] [PubMed] [Google Scholar]
- 22.de Riel JK, Paulus H. Biochemistry. 1978;17:5141–5146. doi: 10.1021/bi00617a011. [DOI] [PubMed] [Google Scholar]
- 23.de Riel JK, Paulus H. Biochemistry. 1978;17:5134–5140. doi: 10.1021/bi00617a010. [DOI] [PubMed] [Google Scholar]
- 24.Bystrom CE, Pettigrew DW, Branchaud BP, O'Brien P, Remington SJ. Biochemistry. 1999;38:3508–3518. doi: 10.1021/bi982460z. [DOI] [PubMed] [Google Scholar]
- 25.Gronenborn A. Curr. Opin. Struct. Biol. 2009;19:39–49. doi: 10.1016/j.sbi.2008.12.002. [DOI] [PMC free article] [PubMed] [Google Scholar]
- 26.Yeh JI, Charrier V, Paulo J, Hou L, Darbon E, Claiborne A, Hol WGJ, Deutscher J. Biochemistry. 2004;43:362–373. doi: 10.1021/bi034258o. [DOI] [PubMed] [Google Scholar]
- 27.Koga Y, Katsumi R, You D-J, Matsumura H, Takano K, Kanaya S. FEBS J. 2008;275:2632–2643. doi: 10.1111/j.1742-4658.2008.06410.x. [DOI] [PubMed] [Google Scholar]
- 28.Schnick S, Polley S, Fivelman Q, Ranford-Cartwright L, Wilkinson S, Brannigan J, Wilkinson A, Baker D. Mol. Microbiol. 2009;71:533–545. doi: 10.1111/j.1365-2958.2008.06544.x. [DOI] [PMC free article] [PubMed] [Google Scholar]
- 29.Di Luccio E, Petschacher B, Voegtli J, Chou H-T, Stahlberg H, Nidetzky B, Wilson DK. J. Mol. Biol. 2007;365:783–798. doi: 10.1016/j.jmb.2006.10.068. [DOI] [PMC free article] [PubMed] [Google Scholar]
- 30.Pelton JG, Torchia DA, Meadow ND, Wong C-Y, Roseman S. Biochemistry. 1991;30:10043–10057. doi: 10.1021/bi00105a032. [DOI] [PubMed] [Google Scholar]
- 31.Pettigrew DW. Arch. Biochem. Biophys. 2009;481:151–156. doi: 10.1016/j.abb.2008.11.020. [DOI] [PMC free article] [PubMed] [Google Scholar]
- 32.Worthylake D, Meadow N, Roseman S, Liao D-I, Herzberg O, Remington SJ. Proc. Natl. Acad. Sci. USA. 1991;88:10382–10386. doi: 10.1073/pnas.88.23.10382. [DOI] [PMC free article] [PubMed] [Google Scholar]
- 33.Pettigrew DW, Meadow ND, Roseman S, Remington SJ. Biochemistry. 1998;37:4875–4883. doi: 10.1021/bi971634u. [DOI] [PubMed] [Google Scholar]
- 34.Yu P, Lasagna M, Pawlyk A, Reinhart GD, Pettigrew DW. Biochemistry. 2007;46:12355–12365. doi: 10.1021/bi7010948. [DOI] [PubMed] [Google Scholar]
- 35.Frieden C. J. Biol. Chem. 1964;239:3522–3531. [PubMed] [Google Scholar]
- 36.Reinhart GD. In: Energetics of Biological Macromolecules, Part E. Holt JoM, J ML, Ackers Gary K., editors. Academic Press; 2004. pp. 187–203. [Google Scholar]
- 37.Reinhart GD. Arch. Biochem. Biophys. 1983;224:389–401. doi: 10.1016/0003-9861(83)90225-4. [DOI] [PubMed] [Google Scholar]
- 38.Pettigrew DW, Yu G-J, Liu Y. Biochemistry. 1990;29:8620–8627. doi: 10.1021/bi00489a018. [DOI] [PubMed] [Google Scholar]
- 39.Philo J. Biophys. J. 1997;72:435–444. doi: 10.1016/S0006-3495(97)78684-3. [DOI] [PMC free article] [PubMed] [Google Scholar]
- 40.Yu P, Pettigrew DW. Biochemistry. 2003;42:4243–4252. doi: 10.1021/bi027142l. [DOI] [PubMed] [Google Scholar]
- 41.Holtman CK, Pawlyk AC, Meadow ND, Roseman SR, Pettigrew DW. Biochemistry. 2001;40:14302–14308. doi: 10.1021/bi011590w. [DOI] [PubMed] [Google Scholar]
- 42.Liu WZ, Faber R, Feese M, Remington SJ, Pettigrew DW. Biochemistry. 1994;33:10120–10126. doi: 10.1021/bi00199a040. [DOI] [PubMed] [Google Scholar]
- 43.Pettigrew DW. Biochemistry. 1986;25:4711–4718. doi: 10.1021/bi00364a039. [DOI] [PubMed] [Google Scholar]
- 44.Anderson MJ, DeLaBarre B, Raghunathan A, Palsson BO, Brunger AT, Quake SR. Biochemistry. 2007;46:5722–5731. doi: 10.1021/bi700096p. [DOI] [PubMed] [Google Scholar]
- 45.Pawlyk AC, Pettigrew DW. Proc. Natl. Acad. Sci. USA. 2002;99:11115–11120. doi: 10.1073/pnas.132393599. [DOI] [PMC free article] [PubMed] [Google Scholar]
- 46.Garcia de la Torre J, Huertas ML, Carrasco B. Biophys. J. 2000;78:719–730. doi: 10.1016/S0006-3495(00)76630-6. [DOI] [PMC free article] [PubMed] [Google Scholar]
- 47.Powers ET, Powers DL. Biophys. J. 2003;85:3587–3599. doi: 10.1016/S0006-3495(03)74777-8. [DOI] [PMC free article] [PubMed] [Google Scholar]
- 48.Rye HS. Methods. 2001;24:278–288. doi: 10.1006/meth.2001.1188. [DOI] [PMC free article] [PubMed] [Google Scholar]
- 49.Lakowicz JR. Principles of fluorescence spectroscopy. 3rd ed. New York: Springer; 2006. [Google Scholar]
- 50.Holtman CK, Pawlyk AC, Meadow ND, Pettigrew DW. J. Bacteriol. 2001;183:3336–3344. doi: 10.1128/JB.183.11.3336-3344.2001. [DOI] [PMC free article] [PubMed] [Google Scholar]
- 51.Yeh JI, Kettering R, Saxl R, Bourand A, Darbon E, Joly N, Briozzo P, Deutscher J. Biochemistry. 2009;48:346–356. doi: 10.1021/bi8009407. [DOI] [PMC free article] [PubMed] [Google Scholar]
- 52.Rosenberg O, Deindl S, Sung R-J, Nairn A, Kuriyan J. Cell. 2005;123:849–860. doi: 10.1016/j.cell.2005.10.029. [DOI] [PubMed] [Google Scholar]
- 53.Mesecar AD, Nowak T. Biochemistry. 1997;36:6792–6802. doi: 10.1021/bi962869t. [DOI] [PubMed] [Google Scholar]
- 54.Johnson JL, Reinhart GD. Biochemistry. 1992;31:11510–11518. doi: 10.1021/bi00161a032. [DOI] [PubMed] [Google Scholar]
- 55.Symcox MM, Reinhart GD. Analytical Biochem. 1992;206:394–399. doi: 10.1016/0003-2697(92)90384-j. [DOI] [PubMed] [Google Scholar]
- 56.Tlapak-Simmons VL, Reinhart GD. Arch. Biochem. Biophys. 1994;308:226–230. doi: 10.1006/abbi.1994.1032. [DOI] [PubMed] [Google Scholar]
- 57.Braxton BL, Tlapak-Simmons VL, Reinhart GD. J. Biol. Chem. 1994;269:47–50. [PubMed] [Google Scholar]
- 58.Fenton AW, Paricharttanakul NM, Reinhart GD. Biochemistry. 2003;42:6453–6459. doi: 10.1021/bi034273t. [DOI] [PubMed] [Google Scholar]
- 59.Pettigrew DW, Smith GB, Thomas KP, Dodds DC. Arch. Biochem. Biophys. 1998;349:236–245. doi: 10.1006/abbi.1997.0444. [DOI] [PubMed] [Google Scholar]
- 60.Huang HS, Ito K, Kabashima T, Yoshimoto T. J. Biochem. 2000;128:207–211. doi: 10.1093/oxfordjournals.jbchem.a022743. [DOI] [PubMed] [Google Scholar]
- 61.Kim C, Cheng C, Saldahna S, Taylor SS. Cell. 2007;130:1032–1043. doi: 10.1016/j.cell.2007.07.018. [DOI] [PubMed] [Google Scholar]
- 62.Jeffrey PD, Russo A, Polyak K, Gibbs E, Hurwitz J, Massague J, Pavletich N. Nature. 1995;376:313–320. doi: 10.1038/376313a0. [DOI] [PubMed] [Google Scholar]
- 63.Pellicena P, Kuriyan J. Curr. Opin. Struct. Biol. 2006;16:702–709. doi: 10.1016/j.sbi.2006.10.007. [DOI] [PubMed] [Google Scholar]
- 64.Knighton DR, Zheng J, Eyck LFT, Ashford VA, Xuong N-H, Taylor SS, Sowadski JM. Science. 1991;253:407–414. doi: 10.1126/science.1862342. [DOI] [PubMed] [Google Scholar]
- 65.Wong L, Jennings PA, Adams JA. Acc. Chem. Res. 2004;37:304–311. doi: 10.1021/ar020128g. [DOI] [PubMed] [Google Scholar]
- 66.Goldberg J, Nairn A, Kuriyan J. Cell. 1996;84:875–887. doi: 10.1016/s0092-8674(00)81066-1. [DOI] [PubMed] [Google Scholar]
- 67.Shi Z, Resing KA, Ahn NG. Curr. Opin. Struct. Biol. 2006;16:686–692. doi: 10.1016/j.sbi.2006.10.011. [DOI] [PubMed] [Google Scholar]
- 68.Feese M, Pettigrew DW, Meadow ND, Roseman S, Remington SJ. Proc. Natl. Acad. Sci. USA. 1994;91:3544–3548. doi: 10.1073/pnas.91.9.3544. [DOI] [PMC free article] [PubMed] [Google Scholar]
- 69.Guex N, Peitsch MC. Electrophoresis. 1997;18:2714–2723. doi: 10.1002/elps.1150181505. [DOI] [PubMed] [Google Scholar]


