Abstract
Aims
To image the distribution of drug molecules attached to single-wall carbon nanotubes (SWNTs).
Materials & methods
Herein we report the use of scanning transmission electron microscopy (STEM) for atomic scale visualization and quantitation of single platinum-based drug molecules attached to SWNTs designed for targeted drug delivery. Fourier transform infrared spectroscopy and energy-dispersive x-ray spectroscopy were used for characterization of the SWNT drug conjugates.
Results
Z-contrast STEM imaging enabled visualization of the first-line anticancer drug cisplatin on the nanotubes at single molecule level. The identity and presence of cisplatin on the nanotubes was confirmed using energy-dispersive x-ray spectroscopy and Fourier transform infrared spectroscopy. STEM tomography was also used to provide additional insights concerning the nanotube conjugates. Finally, our observations provide a rationale for exploring the use of SWNT bioconjugates to selectively target and kill squamous cancer cells.
Conclusion
Z-contrast STEM imaging provides a means for direct visualization of heavy metal containing molecules (i.e., cisplatin) attached to surfaces of carbon SWNTs along with distribution and quantitation.
Keywords: cisplatin, drug delivery, EGF, squamous cell carcinoma, scanning transmission electron microscopic tomography, scanning transmission electron microscopy, single-wall carbon nanotube
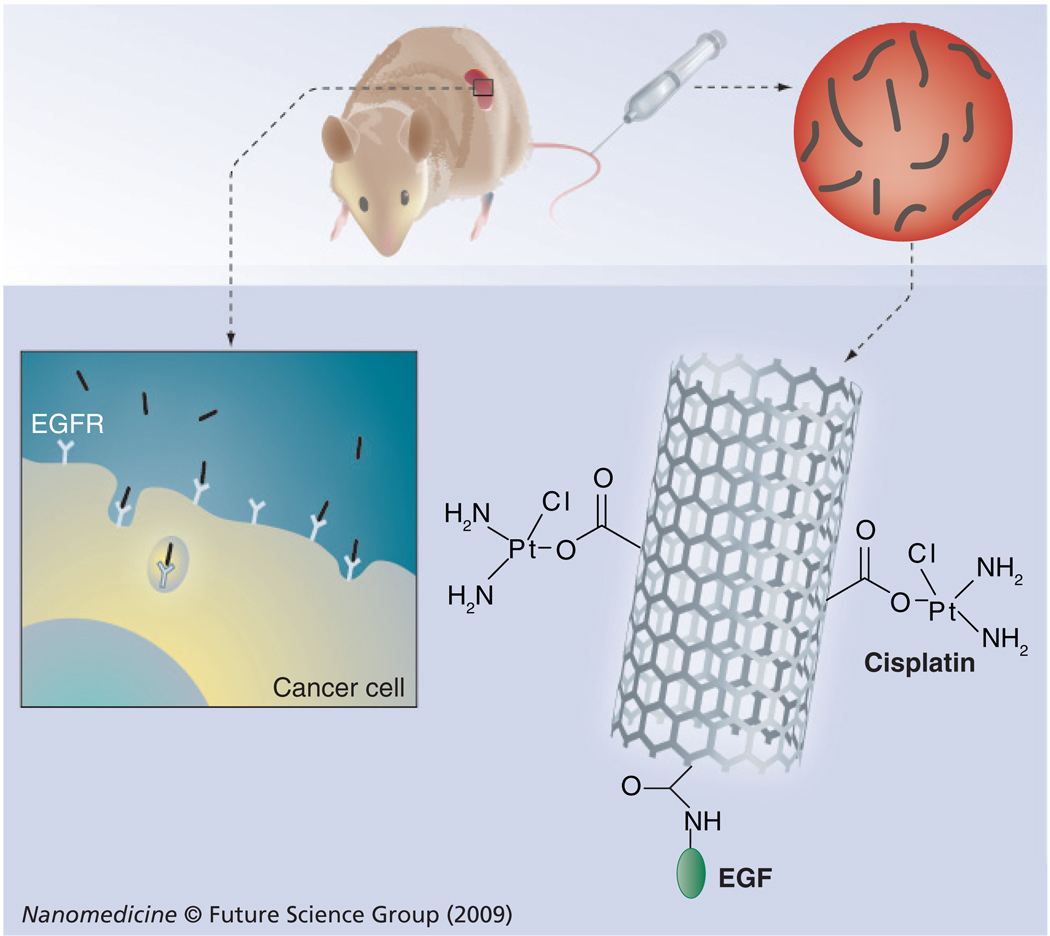
Carbon nanotubes with attached drugs and directing ligands have excellent potential for targeted drug delivery (Figure 1) [1]. Single-wall carbon nanotubes (SWNTs) with very high specific surface areas can be easily derivatized with bio-molecules either through chemical attachment, adsorption or encapsulation [2]. Such bioconjugates on SWNTs have the ability to deliver bioactive molecules across cell membranes and even into cell nuclei [3–6]. We have employed SWNTs bioconjugated with targeting ligand EGF, the drug cisplatin, and quantum dots to specifically target and image tumors in cell cultures and mice [7]. Careful characterization of nanoparticle bioconjugates is essential for the future progress of this approach [8–10]. In particular, nanotube size distributions and the number of biomolecules per nanotube length are important parameters, especially for drug delivery.
Figure 1. Nanotube-based delivery system for active targeting and killing of cancer cells.
Nanotubes bioconjugated with EGF target the cell-surface receptor (EGFR) and are internalized through receptor-mediated endocytosis. Killing of cancer cells is also accomplished by conjugating nanotubes with an anticancer drug, such as cisplatin [7].
EGFR: EGF receptor.
Platinum-based drugs are widely used in chemotherapy [11]. The first discovered member of this family, cisplatin (cis-diammineplatinum [II] dichloride), is effective against a variety of cancers [12]. The primary mode of cisplatin action is the formation of covalent intrastrand and, to a lesser extent, interstrand cross-links. These adducts modify the DNA structure, thereby inhibiting key cellular processes (e.g., transcription, replication and repair), leading to death of dividing tumor cells. In a recent report, a Pt (IV) prodrug was attached noncovalently to carbon nanotubes and cytotoxicity to testicular carcinoma cell cultures was demonstrated [13]. In addition, cisplatin was encapsulated within carbon nanohorns and was slowly released to kill lung cancer cells in vitro [14].
Techniques based on electron microscopy are very attractive for the quantitative analysis of nanoparticle systems used in drug-delivery and biomedical imaging applications [15–17]. For example, Lengyel et al. used cryoelectron tomography to assess size and compositional variations of liposomal Doxil®, a US FDA-approved nano-medicine [15]. In another study, Sousa et al. used a hybrid approach based on scanning transmission electron microscopy (STEM) and energy-filtered transmission electron microscopy to determine quantitatively the total molecular weight distributions and amounts of Gd atoms within different populations of dendrimer nanoparticles [16], which have been considered for applications in nanomedicine [18].
Z-contrast STEM can be a powerful technique for imaging SWNTs with covalently attached organic molecules that contain single atoms of medium-to-high atomic number [19]. In the STEM technique, a focused electron probe of subnanometer diameter rasters across a specimen, and at each pixel of the raster an annular dark-field (ADF) detector collects electrons that have been scattered to high angles. As first shown by Crewe and coworkers [20], image intensity in Z-contrast STEM scales approximately with the square of the atomic number, and thus high contrast can be observed for heavy atoms such as Pt on substrates made of light atoms such as carbon. In addition to atomic-scale imaging, it is also possible with STEM to quantify image intensities [21–25] and determine the number of heavy metal-based drugs or contrast agents that are associated with nanotubes or other low-Z nanocarriers used in nanomedicine.
Although imaging individual heavy atoms with Z-contrast STEM has found many applications in materials science [26–30], there has not been a widespread use of this technique in biological and biomedical applications. Herein we report the use of Z-contrast STEM for the first atomic-scale visualization and quantification of Pt-based drug molecules attached to SWNTs.
Experimental methods
SWNT bioconjugate synthesis
High-pressure CO-synthesized SWNTs from Carbon Nanotechnologies Inc. (Houston, USA) were first oxidized by sonication in 3:1 HNO3–H2SO4 for 4 h at 70 °C to generate carboxylic functional groups, then filtered, washed with water and dried [31]. The SWNTs with diameters of approximately 1.4 nm and 40–400 nm in length were dispersed in methanol at a concentration of 0.5 mg ml−1 for further reaction with the Pt drug. The SWNTs were then reacted as described previously with 3 mg ml−1 cisplatin (Sigma-Aldrich) dispersed in dimethyl sulfoxide at room temperature for 1 h [7]. The resulting SWNT–cisplatin bioconjugate was centrifuged, washed extensively with detergent solution to remove adsorbed cisplatin molecules to the surface of the SWNTs and filtered to remove unbound cisplatin.
STEM methods
Specimens for electron microscopy were prepared by dispersing functionalized SWNTs treated with cisplatin or control nanotubes in ethanol and placing 3 µl droplets of the dispersion onto gold lacey-carbon support grids (EMS, Hatfield, USA). STEM images were recorded using an FEI Tecnai TF30 electron microscope (FEI, Hillsboro, USA) using a field emission source and operating at an acceleration voltage of 300 kV. Z-contrast dark-field STEM images of the SWNTs were obtained using a Fischione ADF STEM detector (Fischione, Export, USA). The inner-collection semi-angle of the STEM detector was 40 mrad. Images were acquired with a probe diameter of approximately 0.3 nm and pixel size of 0.027 nm, and they were postprocessed with a low-pass Gaussian filter of 0.13 nm full-width at half-maximum to reduce high-frequency noise. The incident electron dose was approximately 5.6 × 10⁶ e nm−2.
To estimate the amount of cisplatin drug attached to the nanotubes, we integrated intensities of bright spots due to Pt atoms in the STEM images and calibrated these intensities using 1.4-nm-sized gold clusters (Nanogold) that are known to contain around 67 Au atoms (Nanoprobes, Yaphank, USA) [32]. As an alternative to using Nanogold as a calibration standard, it is also possible to convert the intensities of the bright spots in STEM images of cisplatin nano-tube bundles directly into numbers of Pt atoms. To illustrate this possibility, we used the following equation to determine the number of gold atoms within several individual Nanogold clusters and confirm that the average result would be close to 67 atoms.
Where, β is the collection semi-angle subtended by the ADF detector; S(β) is the measured net number of scattered electrons from Nanogold clusters; σ(β)Au is the integrated elastic-scattering cross-section of gold atoms for a collection semi-angle β; Iincis the number of incident electrons per image pixel. The summation in the above equation is done over the number of pixels N encompassing a single Nanogold cluster, and A is the pixel area. The calculation of σ(β)Au was done using a similar procedure as described previously [25]. Conversion of image counts into number of electrons (S(β)) was done by taking into account the nonuniform conversion efficiency of the ADF STEM detector [25].
Z-contrast ADF STEM tomographic-tilt series of cisplatin–nanotube bioconjugates were acquired from −60 to 60° in steps of 3°, a pixel size of 0.15 nm and with an ADF detector inner semi-angle of 40 mrad. 3D reconstruction of the tilt series was performed in IMOD (University of Colorado, USA) using the weighted back-projection algorithm of the IMOD package [33]. The 3D model was generated in Amira® (Visage Imaging, Germany) by guided segmentation.
Spectroscopy methods
Specimens for energy-dispersive x-ray (EDX) spectroscopy were prepared as above but using copper lacey-carbon as support grids. EDX spectra were recorded with a Tracor Northern Micro ZHV ultrathin window detector fitted to a VG HB501 STEM operating at 100 kV acceleration voltage, using a 4Pi acquisition system and the NIST Desktop Spectrum Analyzer software.
Fourier transform infrared spectroscopy of SWNT–cisplatin conjugates along with control SWNTs and cisplatin alone was carried out using KBr pellets of each. The wave-numbers of the transmittance of each sample were recorded using a JASCO FT/IR-480 plus spectrophotometer.
Apoptosis assay
Head and neck cancer cells (HN13) were cultured in a 96-well plate and treated with the SWNT bioconjugates and cisplatin alone. The wells treated with cisplatin (1 µM) alone and nanotube bioconjugates were washed off 10 min post-treatment according to our previously described procedure [7]. The wells treated with a high dose of cisplatin (10 µM) alone were left unwashed to examine the extent of damage to the cancer cells, thus serving as a positive control. The cells were incubated for an additional 12 h (overnight) and then assessed for caspase activity. The EnzoLyte™ Rh110 Capase-3/7 Assay Kit from AnaSpec (CA, USA) was employed for these studies. This assay makes use of (Z-DEVD)2-Rh110 indicator for assaying caspase-3/7 activities, which upon caspase-3/7 cleavage, generates the rhodamine 110 fluorophore that has bright green fluorescence. This resulting fluorescence was detected at excitation/emission wavelengths of 496 nm/520 nm using a 96-well plate reader and the data were expressed as a percentage of caspase activity relative to untreated cells.
Results & discussion
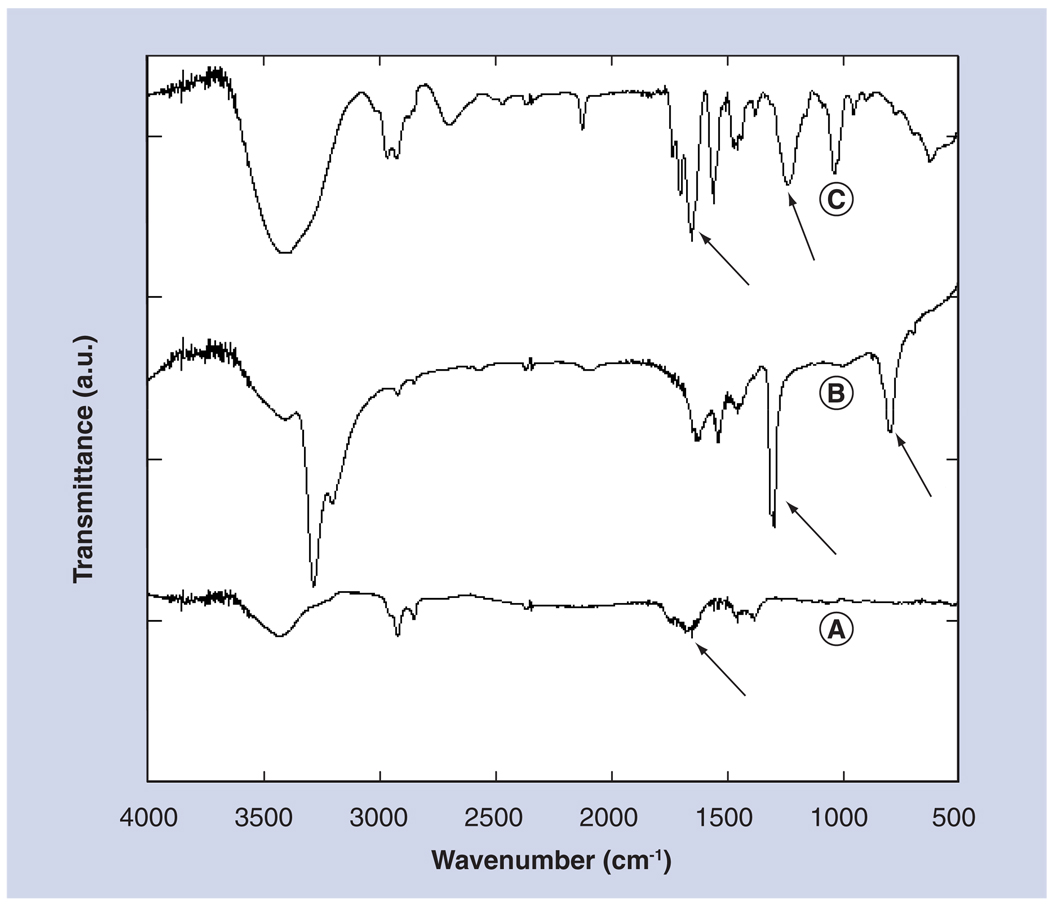
Vibrational spectroscopy
Fourier transform infrared spectroscopy was used to confirm the covalent binding of cisplatin molecules to carboxylic functional groups at the surface of oxidized SWNTs (Figure 2). Indeed, the changes in spectral features in Figure 2C compared with nanotube and free cisplatin spectra in Figures 2A & 2B suggest the identity and covalent linkage of cisplatin to the oxidized SWNTs [34]. The SWNT–COOH groups have bands in the 1700–1500 cm−1 range indicated by arrows, whereas for cisplatin–SWNT, the peaks are shifted to slightly higher frequencies, suggesting coupling of Pt to COO− [35]. A band appearing near 1350 cm−1 (indicated by arrow) corresponds to Pt–N–H bending and appears to shift to lower frequency in cisplatin–SWNT. The cisplatin band at approximately 700 cm−1 can be assigned to Pt–N, while this band may shift to higher frequency in cisplatin–SWNT and a new band appears at approximately 600 cm−1 that can be associated with Pt–O [35]. While the assignments for several of the cisplatin–SWNT require further validation, the IR-spectral differences are clearly consistent with covalent linkage of cisplatin to the oxidized SWNTs. Also, the fact that cisplatin is not removed by washing with detergent solutions, which are well known to displace adsorbed molecules, reinforces the nature of the covalent attachment of cisplatin to the nanotubes.
Figure 2. FTIR spectra of (A) oxidized single-wall carbon nanotubes, (B) cisplatin molecules and (C) single-wall carbon nanotube–cisplatin conjugates.
Spectral features between 500 and 1600 cm−1 in (C) indicate covalent binding of cisplatin to single-wall carbon nanotubes. Peak at 1700–1500 cm−1 indicates coupling between the carboxylic groups on the nanotubes and the Pt atom of cisplatin. Arrows point towards specific bands (see text for details).
STEM
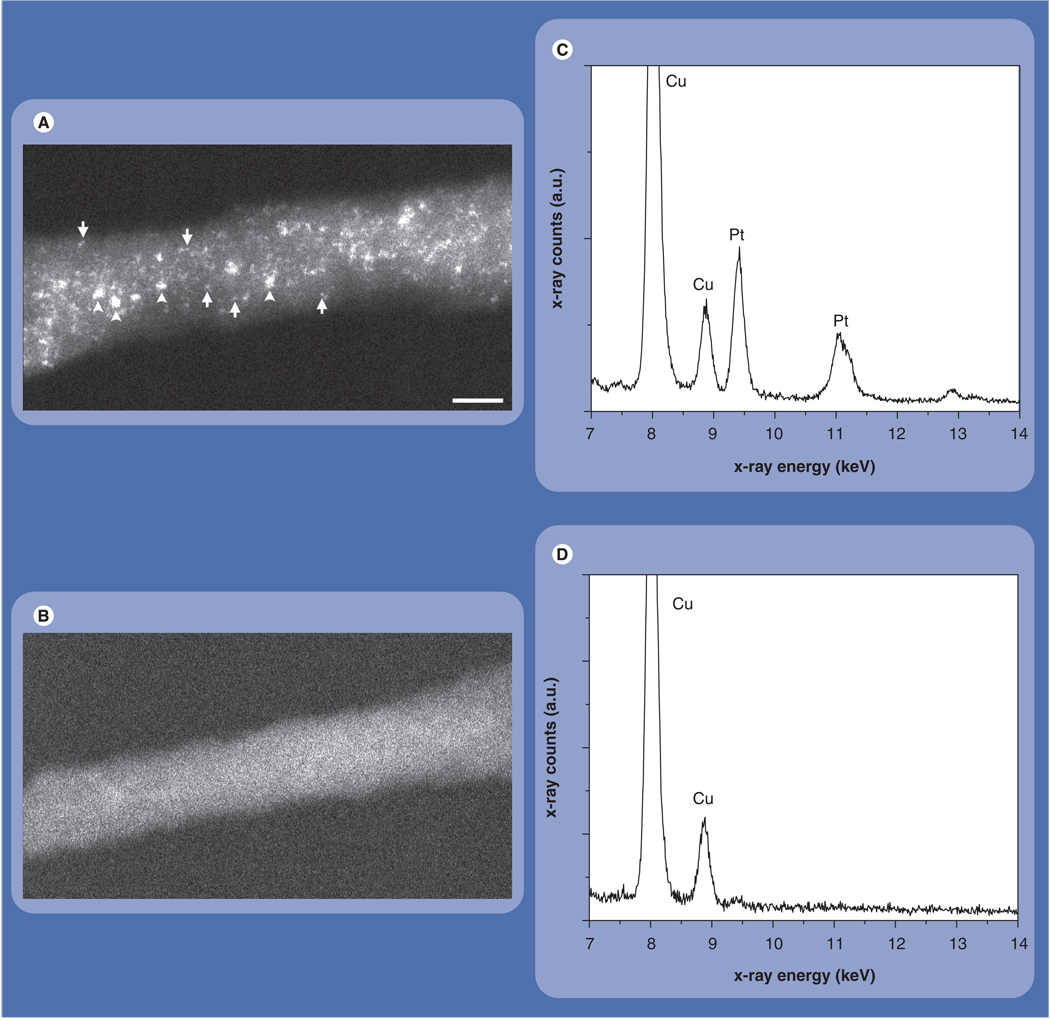
Next, the SWNT–cisplatin bioconjugates were characterized using Z-contrast STEM. The STEM image in Figure 3A shows a 12-nm wide bundle formed by several individual SWNTs, each of approximately 1–1.4 nm in diameter [36]. Figure 3A also reveals intense bright dots throughout the bundle, providing direct evidence for the presence of attached cisplatin molecules. Z-contrast images of control SWNTs with no cisplatin attached did not show any small bright dots (Figure 3B). The presence of cisplatin on the SWNTs was also confirmed by EDX spectroscopy (Figures 3C & 3D). Use of Cu TEM specimen grids gave rise to the Cu lines present in the spectra.
Figure 3. Characterization of nanotube–cisplatin bioconjugates.
(A) Z-contrast scanning transmission electron microscope image of a single-wall carbon nanotube (SWNT) bundle reacted with cisplatin. Small bright spots correspond to individual Pt atoms (arrows), whereas large spots correspond to clusters of atoms (arrowheads). (B) Z-contrast scanning transmission electron microscope image of an untreated SWNT bundle showing no bright spots. (C) The group of Pt lines in the energy-dispersive x-ray spectrum confirms the presence of cisplatin on the SWNTs. (D) Energy-dispersive x-ray spectrum of control region of sample without cisplatin shows no Pt lines. Scale bar is 5 nm.
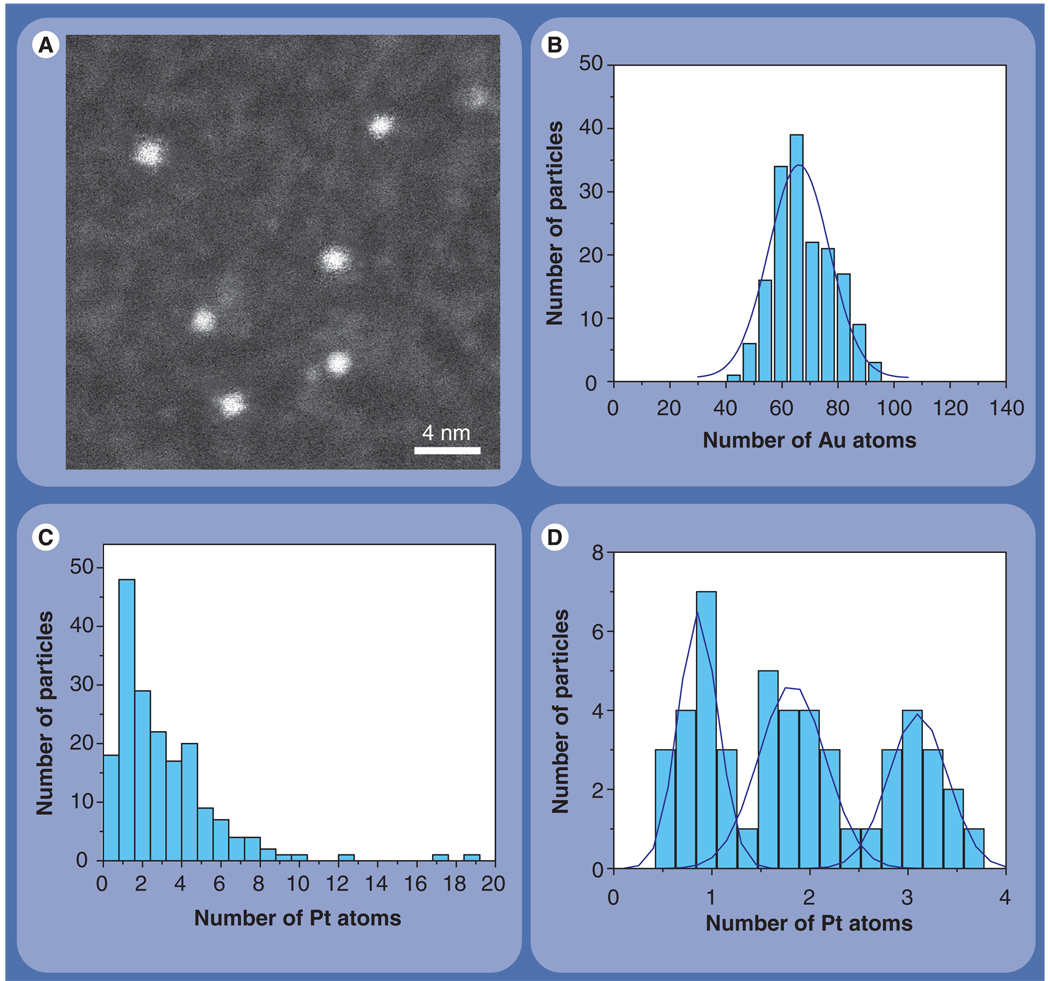
Numbers of Pt atoms associated with individual bright spots such as those in Figure 3A were determined by calibrating their intensities using images of 1.4 nm gold nanoparticle clusters that contain approximately 67 Au atoms (Figure 4A). This calibration can be justified since Au and Pt have nearly the same elastic-scattering cross-sections. Numbers of Pt atoms associated with all spots in Figure 3A are represented as a histogram of integrated spot intensity calibrated in terms of the number of Pt atoms (Figure 4C). The histogram reveals that bright spots in Figure 3A contain anywhere from one to 20 atoms. We also determined numbers of Pt atoms associated exclusively with small (around 0.5 nm × 0.5 nm) spots situated towards the edge of cisplatin–nanotube bundles. The result is displayed as a histogram in Figure 4D, where three peaks are evident and identified with discrete integer numbers of Pt atoms. Despite noise in the measurements, the quantized nature of the histogram validates the accuracy of the quantification scheme.
Figure 4. Quantitation of cisplatin in single-wall carbon nanotube bundles.
(A) Z-contrast scanning transmission electron microscope image of Nanogold clusters containing around 67 Au atoms within a diameter of 1.4 nm. These clusters can be used as a calibration standard to measure the number of Pt atoms associated with nanotube bundles. (B) Histogram displaying the number of Au atoms within individual Nanogold particles. The histogram was calculated using scanning transmission electron microscopy image intensities from Nanogold according to equation 1. The average number of Au atoms (68 ± 11) agrees well with the expected value of 67. (C) Histogram of number of Pt atoms associated with all bright spots in Figure 3a. (D) Histogram of number of Pt atoms from integrated intensities of small spots situated towards the edge of cisplatin-nanotube bundles (e.g., see arrows in Figure 3A). The peaks at 1, 2 and 3 on the x-axis correspond to clusters containing 1, 2 and 3 Pt atoms. Scale bar is 4 nm.
From these quantitative measurements, we can identify many single cisplatin molecules attached to the SWNT bundles, some of which are indicated by arrows in Figure 3A. In the STEM images, individual Pt atoms appear with a full-width at half-maximum of 3 Å due to the finite size of the STEM probe. A few bigger clusters, 1–2 nm in size and containing 10–20 Pt atoms, which were also associated with the nanotube bundles, are indicated by arrowheads in Figure 3A. From the histogram in Figure 4C, we estimate that approximately 65% of all cisplatin is within clusters of up to five molecules, whereas the remaining cisplatin is within clusters containing from five to 20 Pt atoms. We also determined the number of individual SWNTs that formed any given bundle by using tobacco mosaic virus as a mass calibration standard in the STEM [21–22]. Knowing the total number of Pt atoms associated with a given nanotube bundle as well as the number of individual nanotubes within the bundle enables us to estimate the number of cisplatin molecules per unit length of SWNT. Using this rationale, we estimate that there is on average one Pt atom per 10 nm length of SWNT, which is equivalent to one Pt atom for every 1000 atoms of carbon. This gives an estimate of around 1 µM cisplatin in the bioconjugate dispersion, compared with the concentration of 1.3 µM from difference UV–Vis absorption spectroscopy [7].
As described previously, the use of Nanogold as a standard allowed us to calibrate intensities of bright spots in STEM images of nanotube–cisplatin bioconjugates into numbers of Pt atoms. We underline, however, that use of Nanogold as a calibration standard is not strictly necessary, since signal intensities from STEM images can be directly quantified [22,23,25]. To illustrate this possibility, we used the equation given earlier to determine the number of gold atoms within Nanogold clusters. The result is displayed in Figure 4B, which shows that the number of gold atoms measured from images of Nanogold particles (68 ± 11) agrees very well with the known value of 67. The fact that STEM images can be converted directly into absolute numbers of atoms should be especially attractive in the quantification of biomedical nanoparticles containing other atoms such as iron, iodine or gadolinium, for which calibration standards are difficult to find.
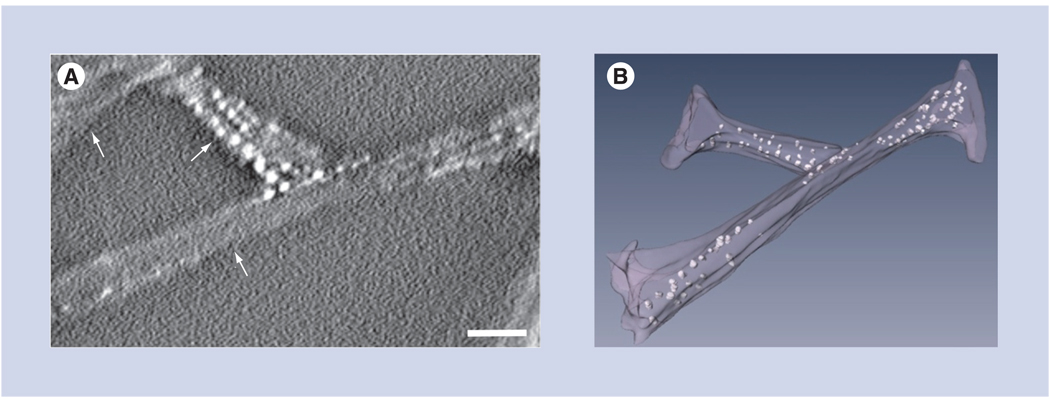
Contrary to typical bulk measurements, high-resolution imaging also allows the uniformity of nanoparticle-drug dispersions to be assessed. This is evidenced here by the visualization of both individual Pt atoms and clusters containing from two to 20 atoms. It is reasonable to consider that formation of the smallest clusters (i.e., two or three Pt atoms) can be explained by the presence of preferentially reactive sites at the surface of the SWNTs. However, this same hypothesis might not explain the formation of bigger clusters containing 10–20 atoms. To get an insight into the possible mechanism by which these bigger clusters are formed, we performed Z-contrast STEM tomography on a set of nanotube bundles to determine the 3D arrangement of large Pt clusters [37]. A slice across an x–y plane of a STEM tomogram (Figure 5A) shows three SWNT bundles and some large Pt clusters (1–2 nm in diameter) associated with one of the bundles. The actual 3D distribution of all Pt clusters can be visualized by surface rendering of the tomogram, which shows that the clusters are situated in the interior of the nanotube bundles (Figure 5B). This suggests a possibility that the Pt clusters may be formed inside cavities of individual SWNTs and/or incorporated between individual nanotubes within the bundle. The large Pt clusters are visible under relatively low incident electron dose in the STEM, ruling out the possibility that they could be formed by coalescence of smaller clusters as a result of electron irradiation. Further characterization of the SWNT–cisplatin bioconjugates is required to determine the 3D distribution of not only large clusters, but also single Pt atoms. This might be achieved by confocal STEM using aberration-corrected transmission electron microscopes [38].
Figure 5. 3D distribution of cisplatin clusters in nanotube bundles.
(A) Slice across an xy plane of Z-contrast scanning transmission electron microscopic tomogram showing three nanotube bundles (arrows) of 8–10 nm diameter. Clusters of Pt atoms that are approximately 1–2 nm in diameter are seen in one of the bundles. (B) 3D rendering of the scanning transmission electron microscopic tomogram showing the nanotube bundles and several large Pt clusters represented as bright dots. The 3D model reveals that the large Pt clusters are situated in the interior of the nanotube bundles. Scale bar is 10 nm.
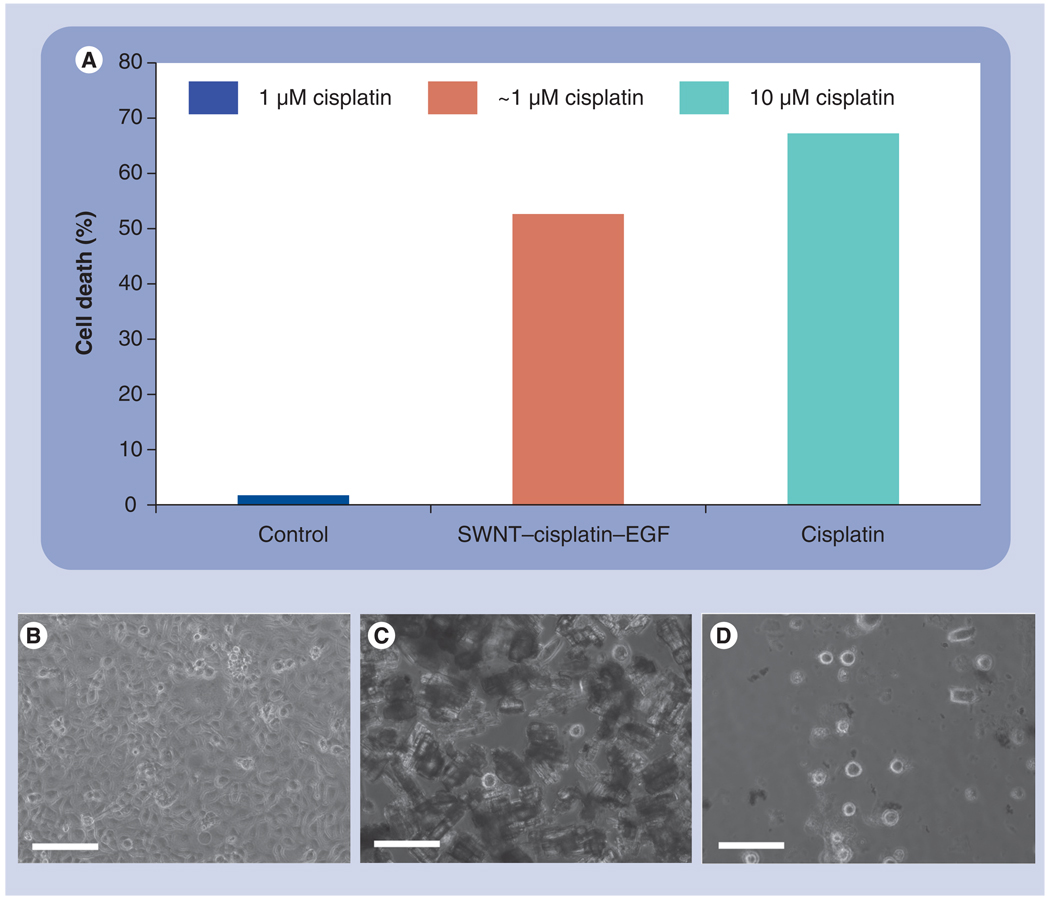
A potential application of SWNT–Pt bioconjugates in nanomedicine is the targeted delivery of anticancer drugs to tumors. This can be particularly important in advanced squamous cell carcinoma of the head and neck (HNSCC), where treatment options of concurrent chemo-radiotherapy for organ preservation is the standard of care. At present, due to the improvement of the locoregional control, chemoradiotherapy with cisplatin or another platinum compound is considered to be one of the standard treatment regimes for patients with locoregionally advanced HNSCC [11]. However, only 50–60% of the patients treated with this combination are cured of cancer, and even those patients who are cured can suffer from acute side effects [11]. Thus, a novel and more effective treatment with a relatively favorable toxicity for HNSCC is clearly needed. In this regard, we have previously shown that SWNT bioconjugates are capable of targeted killing of HNSCC cells in vitro as well as in HNSCC mice cells in vivo [7]. Here, cancer cells overexpressing EGF receptor on their surface were cultured and treated with SWNT bioconjugates, which were prepared by conjugating EGF along with cisplatin onto SWNTs according to a previously described method [7]. The EGF on the SWNTs targets EGF receptors overexpressing on HN13 head and neck cancer cells [39], and promotes the internalization of the entire SWNT–cis-platin–EGF complex. Quantification of the percentage apoptosis of cancer cells in vitro according to a caspase assay revealed that the bioconjugates achieved a similar killing power than that of a conventional cisplatin treatment (Figure 6A) [4]. Cell death was also observed by using a bright-field light microscope as shown in Figure 6B–D. Importantly, the high percentage of cell death for the nanotube-based treatment was achieved with a tenfold lower dosage of cisplatin compared with the conventional treatment (1 µM vs 10 µM), thus potentially avoiding the rate-limiting toxicities associated with the current standard of care available to cancer patients.
Figure 6. Toxicity of SWNT bioconjugates on head and neck cancer cells.
(A) Caspase assay plot showing acute killing (% cell death) of HN13 head and neck cancer cells by SWNT bioconjugates. Cells alone as a control treated with approximately 1 µM cisplatin showed minimal cell death, whereas SWNT–cisplatin–EGF bioconjugates showed 60% cell death even after being washed after 10 min post-treatment. Cell death (%) was determined HN13 relative to untreated cells. Conventional drug treatment (clinical dose) with cisplatin only and no wash showed 70% cell death. The high percentage of cell death for the nanotube-based treatment was achieved with a tenfold lower dosage of cisplatin compared with the conventional treatment (~10 vs 1 µM, respectively). Bright-field light microscopy images showing (B) cultured cancer cells before treatment with nanotube bioconjugates, (C) cells with dark contrast following treatment with nanotubes and (D) detached and floating cells indicating cell death after ~7 h post-treatment. Scale bar = 25 µm.
SWNT: Single-wall carbon nanotube.
Conclusion & future perspective
The results reported above have important implications for quantifying dosage levels of nanoparticle-based drug-delivery systems incorporating heavy metal-based drugs. Z-contrast STEM can be used to image single cisplatin molecules attached to carbon nanotubes for anticancer drug-delivery applications. In addition to atomic-level imaging, the STEM method makes possible the direct quantification of platinum-based drugs and other heavy metal-containing molecules or ions on carbon nanotubes, and perhaps on other low-atomic number nanomaterials as well. STEM tomography was able to provide insights concerning the approximate locations of cisplatin clusters on the nanotube bioconjugates. Such drug mapping on the bioconjugates may have implications concerning drug availability – specifically, are small and large clusters both available for cell killing? These issues are under further investigation in our laboratories.
Carbon nanotubes functionalized with active biomolecules show excellent potential for biological and biomedical applications; for example, as drug-delivery systems. In future, Z-contrast STEM will be an important tool for direct visualization and quantification of organic molecules that are covalently attached to the surface of the nanotubes, either by imaging heavy atoms already present in the molecules (e.g., cisplatin) or those that are added as labels [19]. Using a STEM microscope with aberration-corrected optics [26–30] will further improve the accuracy for imaging individual medium-to-high atomic number elements, so as to provide reliable estimates of drug concentration in nanoparticle–drug dispersions. Ultimately, the effective killing of HNSCC cells using SWNT–EGF–cisplatin complexes provides a rationale for the future exploration of the use of SWNT bioconjugates to selectively target and kill tumoral cells as an anticancer option for aggressive human malignancies.
Executive summary
Carbon nanotubes bioconjugated with the anticancer drug cisplatin and a specific receptor ligand can selectively target and kill squamous cancer cells.
Z-contrast scanning transmission electron microscopy provides a means for direct visualization of heavy metal-containing molecules (such as cisplatin) attached to surfaces of single-wall carbon nanotubes.
Quantitative electron microscopy using scanning transmission electron microscopy can be used to determine the average number of cisplatin molecules associated with single-wall carbon nanotube bundles in order to provide estimates of drug concentration in nanoparticle–drug dispersions.
Acknowledgments
Financial & competing interests disclosure
This research was supported by the Intramural Programs of the National Institute of Dental and Craniofacial Research, the National Institute of Biomedical Imaging and Bioengineering, NIH and in part by PHS grant ES013557 from NIEHS/NIH to University CT. The authors have no other relevant affiliations or financial involvement with any organization or entity with a financial interest in or financial conflict with the subject matter or materials discussed in the manuscript apart from those disclosed.
No writing assistance was utilized in the production of this manuscript.
Bibliography
Papers of special note have been highlighted as:
▪ of interest
▪ ▪ of considerable interest
- 1. Peer D, Karp J, Hong S, Farokhzad O, Margalit R, Langer R. Nanocarriers as an emerging platform for cancer therapy. Nat. Nanotechnol. 2007;2:751–760. doi: 10.1038/nnano.2007.387. ▪ Discusses how biomedical nanocarriers have the potential to revolutionize cancer diagnostics and therapy, and provides examples of different platforms for effective targeted drug delivery.
- 2.Hirsch A. Functionalization of single-walled carbon nanotubes. Angew. Chem. Int. Ed. 2002;41:1853–1859. doi: 10.1002/1521-3773(20020603)41:11<1853::aid-anie1853>3.0.co;2-n. [DOI] [PubMed] [Google Scholar]
- 3.Liu Z, Winters M, Holodniy M, Dai H. siRNA delivery into human T cells and primary cells with carbon-nanotube transporters. Angew. Chem. Int. Ed. 2007;46:2023–2027. doi: 10.1002/anie.200604295. [DOI] [PubMed] [Google Scholar]
- 4.Kam NWS, Liu Z, Dai HJ. Functionalization of carbon nanotubes via cleavable disulfide bonds for efficient intracellular delivery of siRNA and potent gene silencing. Am. Chem. Soc. 2005;127:6021–6026. doi: 10.1021/ja053962k. [DOI] [PubMed] [Google Scholar]
- 5. Bianco A, Kostarelos K, Prato M. Opportunities and challenges of carbon-based nanomaterials for cancer therapy. Expert Opin. Drug Deliv. 2008;5:331–342. doi: 10.1517/17425247.5.3.331. ▪ Highlights potential applications of carbon-based nanomaterials (such as nanotubes, nanohorns and nanodiamonds) in the field of nanomedicine, and provides a discussion of the advantages, drawbacks, benefits and risks associated with the clinical use of these new materials.
- 6.Liu Y, Wu D, Zhang W, et al. Polyethylenimine-grafted multiwalled carbon nanotubes for secure noncovalent immobilization and efficient delivery of DNA. Angew. Chem. Int. Ed. 2005;44:4782–4785. doi: 10.1002/anie.200500042. [DOI] [PubMed] [Google Scholar]
- 7. Bhirde A, Patel V, Gavard J, et al. Targeting killing of cancer cells in vivo and in vitro with EGF-directed carbon nanotube-based drug delivery. ACS Nano. 2009;3:307–316. doi: 10.1021/nn800551s. ▪ Shows that single-wall carbon nanotubes bioconjugated with the anticancer drug cisplatin and a specific receptor ligand can selectively target squamous cancer cells, suggesting the feasibility of future applications of nanotube bioconjugates in cancer-targeted drug delivery.
- 8.Zhang L, Gu F, Chan J, Wang A, Langer R, Farokhzad O. Nanoparticles in medicine: therapeutic applications and developments. Clin. Pharmacol. Ther. 2008;83:761–769. doi: 10.1038/sj.clpt.6100400. [DOI] [PubMed] [Google Scholar]
- 9.Wang A, Gu F, Zhang L, et al. Biofunctionalized targeted nanoparticles for therapeutic applications. Expert Opin. Biol. Ther. 2008;8:1063–1070. doi: 10.1517/14712598.8.8.1063. [DOI] [PMC free article] [PubMed] [Google Scholar]
- 10.Jensen GC, Yu X, Munge B, et al. Characterization of multienzyme–antibody–carbon nanotube bioconjugates for immunosensors. J. Nanosci. Nanotechnol. 2008;8:1–7. doi: 10.1166/jnn.2008.J016. [DOI] [PMC free article] [PubMed] [Google Scholar]
- 11.Kelland L. The resurgence of platinum-based cancer chemotherapy. Nat. Rev. 2007;7:573–584. doi: 10.1038/nrc2167. [DOI] [PubMed] [Google Scholar]
- 12.Go R, Adjei A. Review of the comparative pharmacology and clinical activity of cisplatin and carboplatin. Clin. Oncol. 1999;17:409–422. doi: 10.1200/JCO.1999.17.1.409. [DOI] [PubMed] [Google Scholar]
- 13.Feazell R, Nakayama N, Dai H, Lippard S. Soluble single-walled carbon nanotubes as longboat delivery systems for platinum(IV) anticancer drug design. J. Am. Chem. Soc. 2007;129:8438–8439. doi: 10.1021/ja073231f. [DOI] [PMC free article] [PubMed] [Google Scholar]
- 14.Ajima K, Yudasaka M, Murakami T, Maigne A, Shiba K, Iijima S. Carbon nanohorns as anticancer drug carriers. Mol. Pharm. 2005;2:475–480. doi: 10.1021/mp0500566. [DOI] [PubMed] [Google Scholar]
- 15.Lengyel JS, Milne JLS, Subramanian S. Electron tomography in nanoparticle imaging and analysis. Nanomedicine. 2008;3:125–131. doi: 10.2217/17435889.3.1.125. [DOI] [PMC free article] [PubMed] [Google Scholar]
- 16.Sousa AA, Aronova MA, Wu H, Sarin H, Griffiths GL, Leapman RD. Determining molecular weight distributions and compositions of functionalized dendrimer nanoparticles. Nanomedicine. 2009;4:391–399. doi: 10.2217/nnm.09.14. [DOI] [PMC free article] [PubMed] [Google Scholar]
- 17.Hall JB, Dobrovolskaia MA, Patri AK, McNeil SE. Characterization of nanoparticles for therapeutics. Nanomedicine. 2007;2:789–803. doi: 10.2217/17435889.2.6.789. [DOI] [PubMed] [Google Scholar]
- 18.Svenson S, Tomalia DA. Dendrimers in biomedical applications. Adv. Drug Deliv. Rev. 2005;57:2106–2129. doi: 10.1016/j.addr.2005.09.018. [DOI] [PubMed] [Google Scholar]
- 19. Hong S, Tobias G, Ballesteros B, et al. Atomic scale detection of organic molecules coupled to single-wall carbon nanotubes. J. Am. Chem. Soc. 2007;129:10966–10967. doi: 10.1021/ja069080i. ▪ Shows that individual organic molecules covalently attached to single-wall carbon nanotubes can be detected by transmission electron microscopy when these molecules are tagged with a single atom of high atomic number.
- 20.Crewe AV, Wall J, Langmore J. Visibility of single atoms. Science. 1970;168:1338–1340. doi: 10.1126/science.168.3937.1338. [DOI] [PubMed] [Google Scholar]
- 21.Wall JS, Hainfeld JF. Mass mapping with the scanning-transmission electron-microscope. Ann. Rev. Biophys. Biophys. Chem. 1986;15:355–376. doi: 10.1146/annurev.bb.15.060186.002035. [DOI] [PubMed] [Google Scholar]
- 22.Müller SA, Goldie KN, Burki R, Haring R, Engel A. Factors influencing the precision of quantitative scanning transmission electron microscopy. Ultramicroscopy. 1992;46:317–334. [Google Scholar]
- 23.Sousa AA, Leapman RD. Quantitative STEM mass measurement of biological macromolecules in a 300 kV TEM. J. Microsc. 2007;228:25–33. doi: 10.1111/j.1365-2818.2007.01819.x. [DOI] [PubMed] [Google Scholar]
- 24.Pan YH, Brown A, Sader K, Brydson R, Gass M, Bleloch A. Quantification of absolute iron content in mineral cores of cytosolic ferritin molecules in human liver. Mater. Sci. Technol. 2008;24:689–694. [Google Scholar]
- 25.Sousa AA, Hohmann-Marriott MF, Aronova MA, Zhang G, Leapman RD. Determination of quantitative distributions of heavy-metal stain in biological specimens by annular dark-field STEM. J. Struct. Biol. 2008;162:14–28. doi: 10.1016/j.jsb.2008.01.007. [DOI] [PMC free article] [PubMed] [Google Scholar]
- 26. Batson PE, Dellby N, Krivanek OL. Sub-angstrom resolution using aberration corrected electron optics. Nature. 2002;418:617–620. doi: 10.1038/nature00972. ▪ Describes the implementation of a spherical-aberration correction system in scanning transmission electron microscopy that allows, among other applications, improved detectability of single heavy atoms situated on light-atom substrates.
- 27.Voyles PM, Grazul JL, Muller DA. Imaging individual atoms inside crystals with ADF-STEM. Ultramicroscopy. 2003;96:251–273. doi: 10.1016/S0304-3991(03)00092-5. [DOI] [PubMed] [Google Scholar]
- 28.Varela M, Lupini A, Benthem K, et al. Materials characterization in the aberration corrected scanning transmission electron microscope. Annu. Rev. Mater. Res. 2005;35:539–569. [Google Scholar]
- 29.Urban KW. Studying atomic structures by aberration corrected transmission electron microscopy. Science. 2008;321:506–510. doi: 10.1126/science.1152800. [DOI] [PubMed] [Google Scholar]
- 30.Herzing AA, Kiely CJ, Carley AF, Landon P, Hutchings GF. Identification of active gold nanoclusters on iron oxide supports for CO oxidation. Science. 2008;321:1331–1335. doi: 10.1126/science.1159639. [DOI] [PubMed] [Google Scholar]
- 31.Dai H. Carbon nanotubes: synthesis, integration and properties. Acc. Chem Res. 2002;35:1035–1044. doi: 10.1021/ar0101640. [DOI] [PubMed] [Google Scholar]
- 32.Hainfeld JF, Furuya FR. A 1.4-nm gold cluster covalently attached to antibodies improves immunolabeling. Histochem. Cytochem. 1992;40:177–184. doi: 10.1177/40.2.1552162. [DOI] [PubMed] [Google Scholar]
- 33.Kremer JR, Mastronarde DN, McIntosh JR. Computer visualization of three dimensional image data using IMOD. J. Struct. Biol. 2007;116:71–76. doi: 10.1006/jsbi.1996.0013. [DOI] [PubMed] [Google Scholar]
- 34.Keskar V, Mohanty P, Gemeinhart E, Gemeinhart RJ. Cervical cancer treatment with a locally insertable controlled release delivery system. J. Control. Release. 2006;115:280–288. doi: 10.1016/j.jconrel.2006.08.014. [DOI] [PMC free article] [PubMed] [Google Scholar]
- 35.Gabano E, Ravera M, Cassino C, Bonetti S, Palmisano G, Osella D. Stepwise assembly of platinum–folic acid conjugates. Inorganica Chim. Acta. 2008;361:1447–1455. [Google Scholar]
- 36.Brinson CI, Huang B, Willis A, et al. Purification and characterization of single-wall carbon nanotubes (SWNTs) obtained from the gas-phase decomposition of CO (HiPco process) J. Phys. Chem. B. 2001;105:8297–8301. [Google Scholar]
- 37. Midgley PA, Weyland M. 3D electron microscopy in the physical sciences: the development of Z-ontrast and EFTEM tomography. Ultramicroscopy. 2003;96:413–431. doi: 10.1016/S0304-3991(03)00105-0. ▪ Describes the use of Z-contrast tomography for the nanoscale 3D characterization of a wide range of specimens in the physical sciences.
- 38.Borisevich AY, Lupini AR, Pennycook SJ. Depth sectioning with the aberration-corrected scanning transmission electron microscope. Proc. Natl Acad. Sci. USA. 2006;103:3044–3048. doi: 10.1073/pnas.0507105103. [DOI] [PMC free article] [PubMed] [Google Scholar]
- 39.Sriuranpong V, Park J, Amornphimoltham P, Patel V, Nelkin B, Gutkind S. Epidermal growth factor receptor-independent constitutive activation of state in head and neck squamous cell carcinoma is mediated by the autocrine/paracrine stimulation of the interleukin 6/gp130 cytokine system. Cancer Res. 2003;63:2948–2956. [PubMed] [Google Scholar]


