

Abstract
The electron spin echo envelope modulation (ESEEM) investigation of the high-pH (hpH) form of sulfite oxidase (SO) and sulfite dehydrogenase (SDH) prepared in buffer enriched with H2 17O reveals the presence of three types of exchangeable oxygen atoms at the molybdenum center. Two of these oxygen atoms belong to the equatorial OH ligand and the axial oxo ligand, and are characterized by 17O hyperfine interaction (hfi) constants of about 37 MHz and 6 MHz, respectively. The third oxygen has an isotropic hfi constant of 3–4 MHz and likely belongs to a hydroxyl moiety hydrogen-bonded to the equatorial OH ligand. This exchangeable oxygen atom is not observed in the ESEEM spectra of the Y236F mutant of SDH, where the active site tyrosine has been replaced by phenylalanine.
Introduction
Sulfite-oxidizing enzymes (SOEs) occur in vertebrates, plants, and certain bacteria. In vertebrate sulfur metabolism, sulfite oxidase (SO) converts toxic sulfite to sulfate in the final degradation step of the sulfur-containing amino acids cysteine and methionine.1 Sulfite dehydrogenase (SDH), isolated from the soil bacterium Starkeya novella, oxidizes sulfite during chemolithotrophic growth with thiosulfate serving as its energy source.2,3 Despite their different metabolic roles, both SO and SDH catalyze the same reaction
| (1) |
and have nearly identical active site geometries, which contain several conserved residues including Y236 (SDH numbering).4
The square pyramidal oxomolybdenum active site of either SO or SDH (see Fig. 1) has an axial oxo ligand, one equatorial sulfur from a cysteine amino acid residue, two equatorial sulfurs from the molybdopterin (MPT) cofactor, and one exchangeable equatorial ligand that depends on the stage of the catalytic cycle.4–6 In the fully oxidized Mo(VI) state the exchangeable equatorial ligand is an oxo group. In the generally accepted catalytic mechanism,7 the equatorial oxo ligand undergoes nucleophilic attack by sulfite to form a sulfate-bound Mo(IV) intermediate. Subsequent hydrolysis of the sulfate and one-electron oxidation lead to a Mo(V)–OH species that can be studied by EPR spectroscopy.8
Fig. 1.
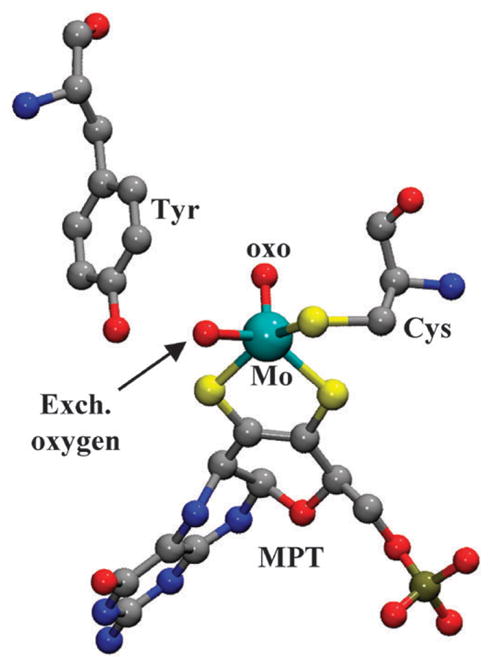
Structural representation of the Mo center of wt SO and SDH enzymes (prepared from the cSO coordinates from pdb 1SOX), including the MPT cofactor, the cysteine (Cys) residue, and the tyrosine (Tyr) residue that is within hydrogen-bonding distance from the exchangeable equatorial oxygen ligand.
Extensive EPR investigations of the Mo(V) state have shown that the spectra depend on pH, anions in the media, the method of generating the Mo(V) state, as well as the source organism and mutations near the active site. In particular, it was found that the signals formed at pH ≤ 7.5 and pH ≥ 9 in chicken SO (cSO) are characterized by different principal g-values,9–14 and that the low-pH signal exhibits hyperfine splittings from a nearby proton of the equatorial OH ligand. The structurally different forms of SO (i.e., the Mo(V) active center) corresponding to these signals are referred to as the low-pH (lpH) and high-pH (hpH) forms, respectively. Similar lpH and hpH forms have also been identified for wild-type (wt) and mutated SOEs from human (hSO), plant (Arabidopsis thaliana, At–SO), and bacteria (Starkeya novella SDH).1,15,16 In addition, recent pulsed EPR measurements have detected a blocked form of SOEs where the sulfate ligand remains bound to the Mo(V) center.17–19
Continuous wave (CW) EPR spectra are helpful for qualitative characterization of the Mo(V) center of SOEs under various conditions, but they provide very little information about the hyperfine and nuclear quadrupole interactions (hfi and nqi, respectively) of neighboring magnetic nuclei. The hfi and nqi reflect the geometric and electronic structure of the Mo center and can provide details about the enzyme function (e.g., electron transfer, substrate binding, product release, etc.). Therefore, their experimental determination represents an active systematic effort that requires using high-resolution pulsed EPR methods, including electron spin echo envelope modulation (ESEEM) and electron-nuclear double resonance (ENDOR). For example, the 1H hfi for the equatorial OH ligand and the active site protein environment have been estimated using these techniques, supplemented by measurements of the deuterium nqi in 1H → 2H exchanged samples.20–24 These experiments have directly established the presence of the equatorial OH ligand in the hpH form of SOEs and have revealed some of the structural differences between the hpH and lpH forms. In the blocked forms of SOEs prepared with 33S-enriched sulfite, the detection of a nearby 33S with non-zero isotropic hfi has proven the presence of a sulfate ligand.17,19 Similarly, the detection of 31P has shown the coordination of phosphate in the phosphate-inhibited form of SO.25 Finally, in lpH SOEs, the presence of a chloride near the active center has been definitively revealed,26 and the interpretation of the experimentally determined Cl− parameters by density functional theory (DFT) has shown that it is a second sphere ligand rather than being directly coordinated to the Mo(V).
Attempts to measure the hfi of the oxygen ligands in 17O-enriched preparations of SOEs have been the focus of several investigations, with the degree of success depending on the location of the 17O ligand (either equatorial or axial). For equatorial 17O, hfi splittings on the order of tens of MHz were observed by CW EPR for some of the EPR turning points, although the complete hfi tensor could not be extracted.27 Detecting this oxygen by pulsed EPR was also never completely successful because of the strong hfi. For lpH SO, this 17O was observed by hyperfine sublevel correlation (HYSCORE) spectroscopy at the intermediate-field (gY) and high-field (gX) EPR turning points,28 while detection at the low-field turning point (gZ) was not possible. A similar situation was encountered for the blocked form of the R160Q mutant of hSO. In hpH SO, HYSCORE detection was not possible, presumably because of the significantly larger hfi constant.
In addition to the strongly coupled equatorial oxygen, the preliminary ESEEM investigations have also revealed the spectral features of a weakly coupled 17O.29 This was tentatively assigned to the oxo-ligand, which was later confirmed by comparison with the synthetic model Mo(V) complex, [Mo17O(SPh)4]−.30
In this work, we performed a detailed ESEEM study of the exchangeable oxygens in samples of hpH cSO and SDH. Since no HYSCORE cross-peaks for the equatorial oxygen could be observed, we applied more traditional one-dimensional (1D) techniques of two-pulse and three-pulse ESEEM, where at least the low-frequency fundamental line of this oxygen nucleus could be detected. This approach allowed the hfi to be measured, although the nqi splittings could not be detected. The results obtained for the axial oxo ligand were more detailed, however, and both the hfi and nqi tensors were evaluated for it. In addition to these two ligand oxygen nuclei, a third 17O nucleus was detected. This oxygen nucleus has a nearly isotropic hfi, and several possibilities for its origin are discussed.
The reasons for presenting the results obtained from the hpH forms of vertebrate and bacterial SOEs together in this work are explained as follows. First, it was interesting to compare the 17O spectroscopic parameters of the SOEs from different organisms, as these parameters reflect subtle structural details of their respective Mo centers. Second, with the similarity between wt cSO and SDH established, we studied the Y236F mutant SDH in order to address the structural role of the conserved active site tyrosine residue (Y236 in SDH; see Fig. 1 for the relative location of the tyrosine and the Mo center). The choice of the bacterial enzyme was determined by the fact that for another available mutant of this kind, Y343F hSO, the EPR spectrum shows a mixture of the hpH and lpH forms even at pH ~10.18 According to X-ray crystallographic studies, the tyrosine is within a hydrogen-bonding distance from the equatorial ligand of the Mo center,5 yet the same types of EPR signals are formed (although at somewhat different pH) despite the absence of this bond in the Y236F SDH mutant.
In this work, we report some preliminary structural insights from 17O hfi and nqi parameters, where DFT calculations have been used to interpret the experimental parameters. A more thorough interpretation of these parameters in terms of the complete active site structure will require a significant separate effort and will be the subject of future work.
Materials and methods
Sample preparation
The hpH forms of cSO and Starkeya novella SDH in H2 17O-enriched water were prepared by first concentrating a 100 μL to 300 μL solution of the enzyme (1 and 3 mgs) in 100 mM bis-tris propane pH 9.0 to reduce the amount of H2 16O. Next, a solution of 100 mM bis-tris propane pH 9.0 buffer was vacuum centrifuged to evaporate the H2 16O, and the pelleted buffer was redissolved in the same volume of H2 17O. The concentrated enzyme sample was then incubated in 30 μL of the buffer prepared with H2 17O for approximately 3 h at 4 °C for long incubation. Finally, the enzyme was reduced with a 20-fold of excess sodium sulfite under argon, and the samples were immediately frozen in liquid nitrogen. For short incubation, the samples were frozen immediately after addition of H2 17O buffer and sulfite.
ESEEM measurements
The orientation-selective ESEEM experiments were performed on a home-built Ka-band (26–40 GHz) pulsed EPR spectrometer28 at the microwave (mw) frequency, νmw, of about 29 GHz. A representative set of measurement positions is shown in the ESE field-sweep spectrum of Fig. 2a. The average amplitude of the normalized 17O ESEEM was about 10% (see Fig. 2b). The measurement temperature was about 21 K. Numerical simulations of the ESEEM spectra were performed using the SimBud software (available for a free download from the website of the Department of Chemistry, University of Arizona: see http://quiz2.chem.arizona.edu/epr for details).
Fig. 2.

(a) Two-pulse ESE field sweep spectrum of hpH cSO. Arrows indicate the EPR positions where the two-pulse ESEEM experiments of Fig. 4 were performed. (b) Normalized two-pulse 17O ESEEM recorded at gZ. Experimental conditions: mw frequency, 29.34 GHz; mw pulses, 2 × 15 ns; time interval between the mw pulses (for panel a), τ = 200 ns; temperature, 21 K.
Theoretical calculations
The DFT calculations were performed using the ORCA computational package (www.thch.uni-bonn.de/tc/orca). Geometry optimizations were performed using the BP86 functional31 in conjunction with the all-electron TZVP basis32 in its scalar relativistic re-contraction33 and modeling the protein environment through dielectric continuum methods (conductor like screening model, COSMO)34 using a dielectric constant of four.35 Density fitting36 was used to accelerate these calculations. Relativistic effects were treated at the level of the zeroth order regular approximation (ZORA)37 in one-component form using the model potential of van Wüllen (as implemented in ORCA).38 For geometry optimizations, the one-center ZORA scalar relativistic correction was employed.39
Starting coordinates for different structural models describing the possible orientations of the hydroxo ligand (in 30° increments about the Mo(V) hydroxo oxygen bond with respect to the Mo(V) oxo bond) were based on the X-ray crystal structures of wt cSO.40,41 The models were modified to include the equatorial hydroxo ligand (replacing the equatorial oxo ligand from the cSO crystal structure). In addition, the pterin portion of the molybdopterin cofactor was omitted, the cysteinate residue was replaced by ethanethiolate, and the ethanethiolate dihedral angles were constrained to their crystal structure values relative to the axial Mo(V) oxo bond in order to prevent unrealistic rotation of that group during geometry optimization. The 17O oxo/hydroxo hfi and nqi parameters and the 1H hfi parameters were calculated using the B3LYP functional,42 the TZVP basis set, the ZORA method, and COSMO (using a dielectric constant of four). Since the scalar relativistic TZVP basis set is less heavily contracted than its nonrelativistic counterpart, further decontraction is not necessary in order to obtain accurate hfi and nqi predictions close to the basis set limit. Since we have previously found that the inclusion of picture change effects in the ZORA-4 formalism43 did not improve the quality of calculated quadrupole couplings,44 we did not apply such corrections here. For the correct ZORA calculation of hyperfine couplings,45 it is nevertheless necessary to apply the relativistic formalism.
Results and discussion
1 General situation with 17O nuclei in the vicinity of the Mo(V) centers of hpH SO and SDH
The CW EPR spectra of hpH cSO and SDH prepared in H2 17O-enriched buffer are similar to those reported earlier27 (see the ESI†). The only 17O nucleus detectable by CW EPR for these samples is that of the equatorial OH ligand (for hpH cSO, splittings at the low-field EPR turning point are, on average, about 1.1 mT27). ESEEM, however, reveals a total of three types of 17O nuclei. The axial oxo ligand exchanges to 17O relatively slowly (tens of minutes). When the sample is prepared with a very short incubation time in H2 17O (~2 min) before adding sulfite, the contribution of the 17O-oxo is significantly diminished, and the other two exchangeable oxygens dominate the ESEEM spectra. As an example, traces 1 and 2 in Fig. 3 (panels a and b corresponding to gZ and gX, respectively) show the two-pulse ESEEM spectra of wt hpH cSO prepared with long (~3 h) and short (~2 min) incubation time, respectively. All of the features seen in these spectra originate from 17O because they were absent in the spectra of the sample prepared in the buffer containing the natural abundance of oxygen isotopes (0.037% 17O, trace 3 in both panels of Fig. 3). The contributions from the three different types of oxygen nuclei are indicated, and the spectroscopic information obtained for each of these oxygen nuclei is described below.
Fig. 3.
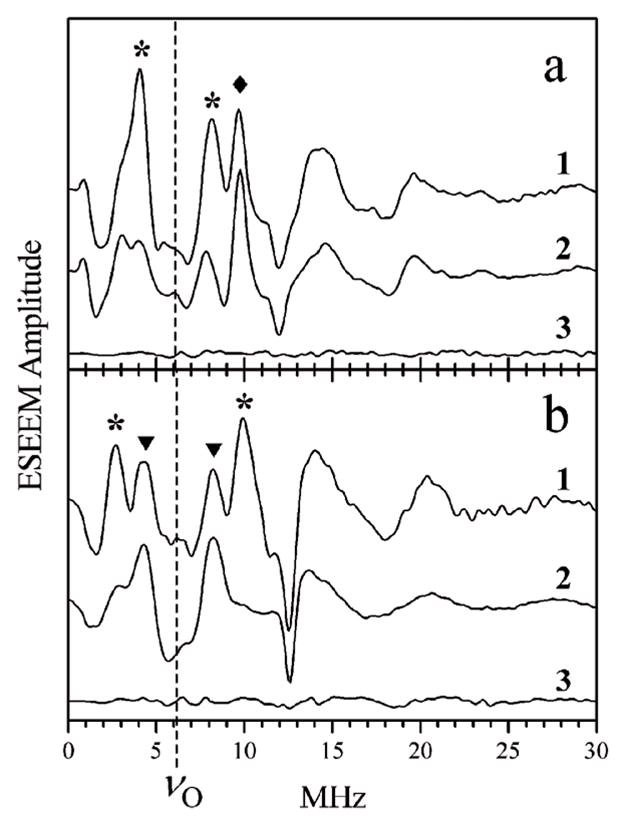
Panels a and b, two-pulse ESEEM spectra (cosine FT) of wt hpH cSO obtained at gZ (Bo = 1055 mT) and gX (Bo = 1071.5 mT), respectively. Traces 1 and 2 in each panel, spectra of samples prepared with H2 17O with long and short incubation time, respectively. Trace 3 in each panel, spectra of samples prepared with H2 16O. Experimental conditions: mw frequency, 29.34 GHz; mw pulses, 2 × 15 ns; temperature, 21 K. Asterisks, diamonds and triangles indicate the ΔmI = 1 fundamental lines of axial oxo-17O, equatorial 17O (from the OH ligand), and unidentified weakly coupled 17O, respectively. The vertical dashed line in each panel shows the Zeeman frequency of 17O, νO.
In the following we discuss in detail the data obtained for hpH wt cSO. The data obtained for wt and Y236F SDH were generally similar, with the differences pointed out when necessary. The representative 17O ESEEM spectra of wt and Y236F SDH are shown in the ESI. †
2 Axial 17O-oxo ligand
We have reported earlier29 that the axial oxo ligand of the molybdenum center of SO exchanges to 17O when the enzyme is incubated in the H2 17O-enriched buffer. Later, using a synthetic oxomolybdenum(V) model complex, we refined the ESEEM-based approach to obtain information about the hfi and nqi of the 17O-oxo.30 A similar approach was then applied to study the 17O-oxo ligand in various preparations of SO and SDH. While some of the results of those investigations were mentioned briefly elsewhere,46 no detailed analysis of the spectra has been presented so far. In this work, we describe the data obtained for hpH cSO in greater detail.
As in our previous studies, it was convenient to use the two-pulse ESEEM technique to obtain the information about the 17O-oxo hfi. For the nqi, however, a higher spectral resolution was required, and to achieve this resolution the τ-integrated four-pulse ESEEM technique was used.47 The spectra for the 17O-oxo were obtained by subtracting the spectra of short-incubation samples from those of long-incubation samples. Such spectra will be referred to as difference ESEEM spectra.
Fig. 4 shows the difference spectra of the two-pulse ESEEM of hpH cSO obtained at different EPR positions. The starting estimates of the hfi constants at each EPR position were obtained as a difference between the frequencies of the fundamental lines of ΔmI = 1 transitions of 17O (να1 and νβ1 in Fig. 4, where the superscript “1” indicates ΔmI = 1), A = να1 − νβ1. The smallest hfi constant (A ~ 4.2 MHz) was observed at the low-field EPR turning point, gZ. At higher fields the hfi constant gradually increased and reached the maximum value of ~7.3 MHz at the high-field turning point, gX. This hfi range is similar to that observed for the synthetic model complex [Mo(V)17O(SPh)4]− (from 3.5 to 7.9 MHz). The starting estimates of the hfi parameters are also similar, aiso ~ 6.3 MHz and T⊥ = 1 MHz (where aiso is the isotropic hfi constant and T⊥ is the perpendicular component of the anisotropic hfi tensor, which at this point is assumed to be axial for simplicity).
Fig. 4.

Solid traces, primary ESEEM spectra (cosine FT) of wt hpH cSO obtained as a difference between the spectra of samples incubated for 3 h and 2 min in H2 17O buffer. Traces 1 through 5 are obtained at magnetic fields Bo = 1055 mT (gZ), 1061 mT, 1066.3 mT (gY), 1069.5 mT and 1071.5 mT (gX), respectively. Experimental conditions: mw frequency, 29.34 GHz; mw pulses, 2 × 15 ns; temperature, 21 K. Dashed traces, 17O primary ESEEM spectra calculated with the following parameters: aiso = 6.3 MHz; (T11,T22,T33) = (2.4, 1, −3.4) MHz; (φh,θh,ψh) = (55°, 20°, −10°); e2Qq/h = 1.7 MHz; η = 1; (φq,θq,ψq) = (70°, 30°, 0°). The calculated traces were divided by 11 in order to make their amplitude similar to the experimental one.
The nqi parameters can be conveniently estimated from the splittings between the components of the sum combination line .30 These splittings, however, are rather small and are not observed in the two-pulse ESEEM spectra of Fig. 4 because the resolution of these spectra is limited by a relatively short transverse relaxation time (T2 ~ 800 ns). Therefore, to estimate the nqi, the integrated four-pulse ESEEM spectra were used. The attainable resolution in these spectra is determined by the longitudinal relaxation time (T1 ~ 300 μs at the temperature of ~20 K) and is sufficient for observation of the nqi splittings that are expected to be on the order of several tenths of a MHz.
As an example, Fig. 5 shows the sum combination line region of the spectra obtained at the EPR turning points. The splittings observed at gZ, gY, and gX are about 0.4, 0, and 0.4 MHz, respectively. The similarity of the splittings at gZ and gX shows that the nqi tensor is very rhombic, with an asymmetry parameter, η, of ~1. In contrast, for the axially symmetric model compound [Mo(V)17O(SPh)4]− an axial nqi tensor was obtained (η = 0). From the largest splitting of 0.4 MHz (at gX and gZ), using the expressions given in ref. 30, the quadrupole coupling constant can be estimated as e2Qq/h = (40/12)·Δνσ ~ 1.3 MHz.
Fig. 5.
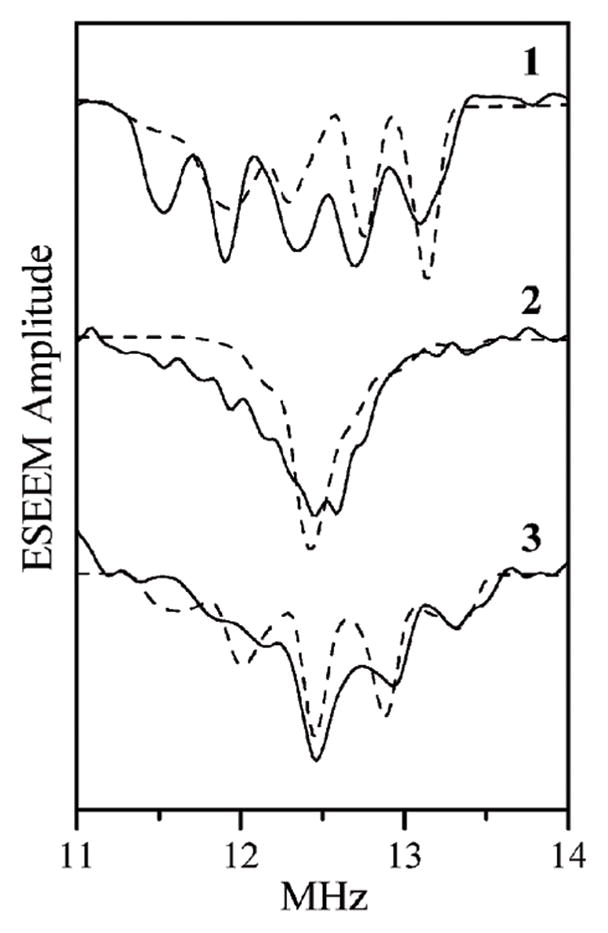
17O sum combination line regions of τ-integrated four-pulse ESEEM spectra (cosine FT). Solid traces, experimental for wt hpH cSO, obtained as a difference between the spectra of samples incubated for 3 h and 2 min in H2 17O buffer. Magnetic fields for traces 1 through 3, Bo = 1056.5 mT (gZ), 1067.7 mT (gY) and 1073 mT (gX), respectively. Experimental conditions: mw frequency, 29.38 GHz; mw pulses, 14, 14, 22 and 14 ns; temperature, 21 K. Dashed traces, calculated with the same parameters as in Fig. 4.
Using the above starting estimates of the hfi and nqi parameters, numerical simulations of the ESEEM spectra were performed. While the number of variable parameters involved in such simulations is rather large (a total of eleven), the nqi of the 17O-oxo is relatively weak and mostly results in minor broadening of the fundamental lines without affecting their positions (which are determined by the hfi). In contrast, the shape and features of the quintet are mostly determined by the nqi. The sensitivity of different spectral features to different interactions has effectively uncoupled the variation of the hfi- and nqi-related parameters and has significantly simplified the entire simulation process. The parameters resulting from the simulations are summarized in Table 1.
Table 1.
The hfi and nqi parameters of exchangeable 17O nuclei in the vicinity of Mo(V) center of hpH SOEs, as determined by ESEEM measurements in this work. For equatorial 17O the sign of aiso is taken negative based on the DFT calculation results shown in Fig. 10. Correspondingly, the signs of the anisotropic hfi components for the equatorial 17O are also opposite to those in the text
| Type of 17O (enzyme) | aiso/MHz | (T11,T22,T33)/MHz | (ψh,θh,ϕh) | e2Qq/h/MHz | η | (ψq,θq,ϕq) |
|---|---|---|---|---|---|---|
| oxo-17O (wt cSO) | 6.3 ± 0.1 | (2.4, 1, −3.4) ± (0.1, 0.1, 0.2) | (55°, 20°, 310°) ± (10°, 5°, 10°) | 1.6 ± 0.1 | 0.9 ± 0.1 | (65°, 25°, −5°) ± (10°, 5°, 10°) |
| Equatorial 17O (wt cSO) | −37 | (−2.5, −2.5, 5) | ~ (0°, 0°, 0°) | — | — | — |
| Equatorial 17O (wt SDH) | −37 | (−2.5, −2.5, 5) | ~ (0°, 0°, 0°) | — | — | — |
| Equatorial 17O (Y236F SDH) | −39 | (−2.5, −2.5, 5) | ~ (0°, 0°, 0°) | — | — | — |
| Weakly coupled 17O (wt cSO) | 4 | |Tii| ≤0.5 | — | — | — | — |
| Weakly coupled 17O (wt SDH) | 3 | |Tii| ≤ 0.5 | — | — | — | — |
Examples of simulated spectra are shown by dashed lines in Fig. 4 and 5. The assignment of various features seen in the spectra of Fig. 4 is given in the ESI. † The overall quality of the simulations is quite reasonable. However, it is obvious from Fig. 5 that while the dependence of the nqi splittings of the νσ feature on the EPR position is qualitatively reproduced, the exact lineshapes are not. Although the variation of the nqi parameters and the orientation of the nqi tensor with respect to the g-frame (within the limits shown in Table 1) improved the agreement in some of the spectra (e.g., at gZ), it was always achieved at the expense of worsening the agreement in other spectra (e.g., at gX). A possible reason for the inabilty to obtain “perfect” simultaneous fits for all of the spectra is the fact that the simulations were performed for fixed magnetic resonance parameters. In reality, however, some static distribution of these parameters is always present, mainly caused by the orientational distribution of the equatorial OH ligand. The distributions of different parameters (principal g-values, hfi, and nqi tensors and their orientations) are correlated if they result from common structural variations. Including such correlated distributions into the simulations could arguably improve the quality of the fit. However, we did not attempt such an improvement in this work because doing so would be very time-consuming and largely cosmetic, and since the distribution widths and the corrections to the mean values of the parameters are expected to be small (within the error limits shown in Table 1).
It is interesting to note that the amplitude of the experimental two-pulse ESEEM spectral lines could only be reproduced if the simulated spectrum amplitude was divided by 11 (see Fig. 4). This indicates that even for the long-incubation sample in buffer containing about 60% H2 17O, only about 10% of the Mo(V) centers had their axial oxo ligand exchanged to 17O.
3 Strongly coupled 17O of the equatorial OH ligand
The strongly coupled 17O of the exchangeable equatorial ligand was observed by HYSCORE spectroscopy at Ka band (~30 GHz) for lpH SO28,48 and the blocked form of R160Q mutant hSO.19 The hfi constants estimated for these systems were about 26 MHz and 18 MHz, respectively. Based on the CW EPR splittings, the expected hfi constant for the hpH form of SO or SDH is significantly larger.27 We have never been able to observe the HYSCORE correlation peaks for the hpH SOEs, probably because the incomplete excitation results in the amplitude of the high-frequency lines being too small to be detectable. We have found, however, that in 1D ESEEM spectra, the low-frequency line is observable, and from the position of this line, the hfi constants at different EPR positions can be estimated.
The low-frequency line of the 17OH ligand (indicated by a diamond symbol in spectrum 1 of Fig. 3a) is readily observed in the two-pulse ESEEM spectrum obtained at gZ. Unfortunately, at higher magnetic fields this line decreases in amplitude and shifts to higher frequencies where it overlaps with the (negative) sum combination line. Therefore, this line becomes effectively undetectable in the two-pulse ESEEM spectra. In order to observe it, three-pulse ESEEM was used since the spectra of the three-pulse ESEEM only contain the fundamental lines and not the homonuclear sum combination lines. As for the heteronuclear combination lines, they are completely negligible because the overall 17O ESEEM amplitude in Ka band is rather small (~10%).
To minimize the contribution of the axial 17O-oxo ligand, samples prepared with short incubation time were used. In addition, to eliminate the blind spots that corrupt the spectra at any fixed time interval τ between the first two mw pulses, τ-integrated stimulated ESEEM was used. The idea behind this approach is as follows. The three-pulse ESEEM harmonics can be generally written as:49
| (2) |
where A and B are constants, τ was already defined above, T is the time interval between the second and third mw pulses (thus, t = τ + T is the interval between the first and third pulses), and ωα and ωβ are the frequencies of nuclear transitions within the α and β electron spin manifolds. For a nuclear spin I = 1/2 there is only one ωα and one ωβ. For arbitrary I, there are I(2I + 1) transitions within each electron spin manifold, and all possible combinations of ωα and ωβ enter the two time-dependent factors of eqn (2). A two-dimensional (2D) three-pulse ESEEM experiment can be performed with the two time coordinates being τ and t=τ+T. In order to be able to start each of the traces along t at the same initial interval to (irrespective of τ), the experiment has to be performed using swapping of the mw pulses.50 Summing up all of the traces recorded at different τ-values (effectively, integrating the 2D data set over τ) yields a 1D integrated three-pulse ESEEM with the general term being simply A·cos ωβ(α)t.
The spectra of the τ-integrated stimulated ESEEM of wt hpH cSO are shown in Fig. 6. In order to suppress the baseline rolling caused by non-zero dead time (td ~ 150 ns) and make the lines from the equatorial 17O easily observable, the ESEEM traces before the FT were extrapolated into the dead time using the FT slicing (FTS) algorithm.51 The spectra of the original ESEEM without extrapolation are shown in ESI.†
Fig. 6.
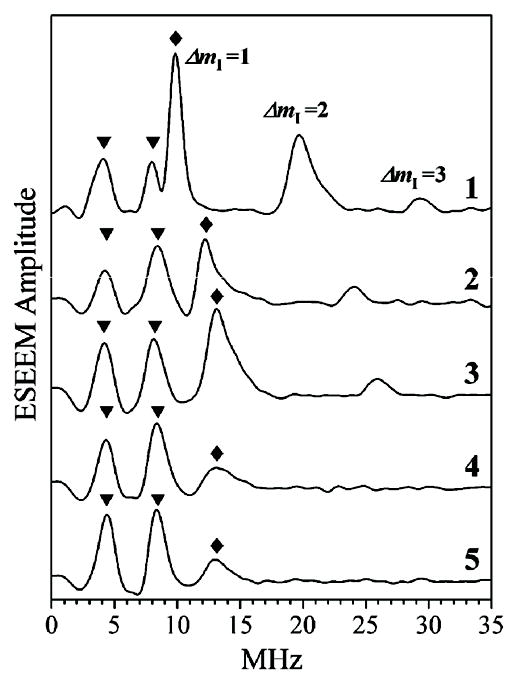
Traces 1 through 5, τ-integrated three-pulse ESEEM spectra (cosine FT) of wt hpH cSO for the samples incubated for 2 min in H2 17O buffer, obtained at Bo=1071.8 mT (gZ), 1079.5 mT, 1083.4 mT (gY), 1086 mT and 1088.6 mT (gX), respectively. Before the FT, the experimental ESEEM traces were extrapolated into the dead time using FTS algorithm.51 Experimental conditions: νmw = 29.810 GHz; mw pulses, 3 × 13 ns; temperature, 21 K. Diamonds and triangles indicate the ΔmI = 1 fundamental lines of equatorial 17O (from the OH ligand) and unidentified weakly coupled 17O, respectively. The higher-frequency lines belong to ΔmI = 2 and ΔmI = 3 fundamental lines of equatorial 17O.
The low-frequency fundamental line of the equatorial 17O in each spectrum of Fig. 6 is marked by a diamond. This line belongs to the ΔmI = 1 transitions of 17O within one of the electron spin manifolds. While the frequency of −1/2 ↔ 1/2 nuclear transition does not depend on the nqi to first order, the frequencies of all other transitions do. However, the largest splitting between the separate lines is only about Δνmax ~ 0.15 e2Qq/h.30 A quadrupole coupling constant of e2Qq/h ~ 7 MHz (similar to that in H2O52–54) would give a Δνmax of ~1 MHz. This splitting is smaller than the experimental linewidth (~1.5 MHz), and it is likely to be masked by even a slight statistical distribution of the hfi constant about the mean value of ~30 MHz (see below). As a result, all of the ΔmI = 1 fundamental lines within the same electron spin manifold merge into a single feature observed in the spectra of Fig. 6. The hfi constant at each EPR position can be found from the frequency of this feature as |A| = 2 (|να| + |νO|), where να is the assumed assignment of the experimental ESEEM frequency and νO is the Zeeman frequency of 17O.
Fig. 7 shows the dependence of the hfi constant A on the EPR position obtained for wt hpH cSO (black squares). From the full range of the variation of A, one can estimate the anisotropic hfi constant as T⊥ ≈ 2.5 MHz (assuming the interaction to be axial). The fact that the hfi constant reaches its minimum at gZ shows that gZ approximately corresponds to the canonical orientation of the anisotropic hfi. The isotropic constant is estimated as aiso = 37 MHz.
Fig. 7.
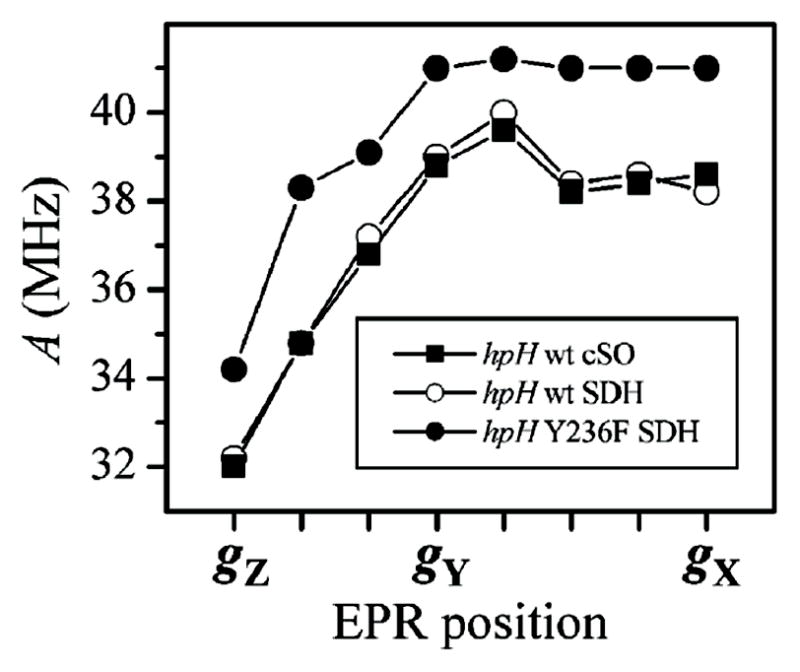
Hyperfine constants of the equatorial 17O ligand of several different hpH SOEs as a function of the EPR position, calculated from the position of the experimental fundamental line να as A = 2(να + νO).
Similar measurements were performed for the samples of hpH wt and Y236F SDH (open and black circles in Fig. 7). For wt SDH, the 17O hfi parameters of the equatorial OH ligand are similar to those obtained for hpH cSO, while for hpH Y236F SDH the isotropic hfi constant is slightly larger (39 MHz). In all samples of hpH SO and SDH, the hfi constant was considerably larger than for lpH SO (37–39 MHz vs. 26 MHz28).
An interesting feature of the experimental spectra of the equatorial 17O is that, while they do not show the high-frequency line of ΔmI = 1 transitions, they do show a series of lines with progressively decreasing amplitudes corresponding to ΔmI = 2, 3, etc., located at the frequencies that are integer multiples of the low-frequency line discussed above. These lines are most clearly seen in the spectrum obtained at gZ, where the amplitude of the ΔmI = 1 line is the largest (see the ΔmI = 2 and ΔmI = 3 features at the frequencies of ~20 and ~30 MHz in trace 1 of Fig. 6).
4 Weakly coupled 17O
In addition to the ligand 17O nuclei, we have also observed a weakly coupled 17O nucleus with hfi parameters that are very different from those of the axial oxo ligand (see Fig. 6, lines marked by triangles). For wt hpH SO, this oxygen nucleus does not show much hf anisotropy, and the splitting between the lines of ~4 MHz gives a good estimate of the isotropic hfi constant, aiso. The lack of visible orientation dependence of the splitting between the lines indicates that the anisotropic hfi constant does not exceed 1 MHz. No nqi-related splittings of the sum combination line are observed in either two-pulse or integrated four-pulse ESEEM spectra, which makes estimating the nqi impossible. The hfi constant for wt hpH SDH is slightly smaller, about 3 MHz. For hpH Y236F SDH, no additional weakly coupled 17O could be reliably observed.
5 Structural implications
The lpH and hpH forms are the two distinct forms of the Mo(V) center of SOEs that contain an equatorial OH ligand. The large isotropic hfi constant of the OH ligand proton observed in the lpH form and the nearly zero hfi constant for this proton in the hpH form have been linked to the orientation of the OH ligand with respect to the Mo center.20 Similar explanations were put forward to rationalize the OH ligand proton hfi constant in other molybdoenzymes, namely dimethyl sulfoxide reductase (DMSOR)55 and xanthine oxidase.56,57 Thus, in the lpH form, the OH ligand was assumed to be nearly parallel to the equatorial plane, while in the hpH form it was thought to be oriented out of the equatorial plane (with a dihedral angle between the planes formed by O==Mo–O(H) and (O==)Mo–OH close to 90°). The orientation of the OH ligand has been, in fact, the only obvious and explicitly discussed major structural difference between the lpH and hpH forms.
In order to determine if the OH orientation alone could account for the spectroscopic differences between the lpH and hpH forms, DFT calculations were performed. The orientation of the OH ligand in the calculations was described by the dihedral angle, θOH, the Mo–O–H plane forms with the O==Mo–O(H) plane. The angle θOH = 0° corresponds to the OH being about parallel to Mo==O bond, while θOH = 90° corresponds to OH being about parallel to Mo–S(MPT) bond and θOH = 270° corresponds to OH being about parallel to Mo–S(Cys). The structural model used in the calculations and described in the Materials and methods section is shown in Fig. 8. Possible protein interactions that may impose restrictions on the range of θOH were not taken into account in this preliminary work.
Fig. 8.
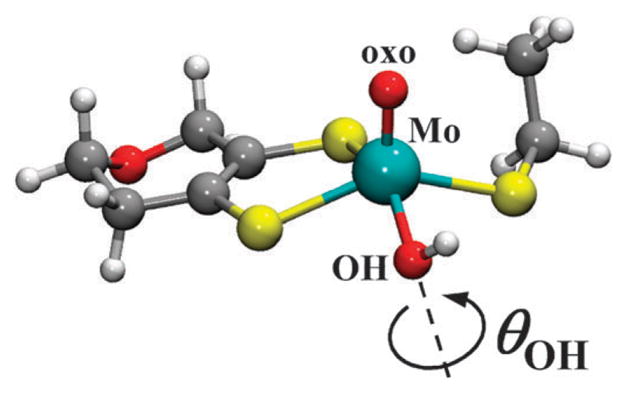
Representative geometry-optimized computational model (where θOH = 330°) from which the various spectroscopic parameters were calculated as a function of θOH.
a Oxo-ligand
The hfi and nqi of the 17O-oxo in the enzyme are similar in magnitude to those in the [Mo(V)17O(SPh)4]− model compound. The most notable difference is in the rhombicity of the interactions, which is related to the lack of the axial symmetry in the ligand surroundings of the Mo(V) center of SO. The main effect of this asymmetry is to make the dxz and dyz orbitals of Mo(V) electronically inequivalent, which results in different spin polarizations of and electron delocalizations from the px and py orbitals of the oxo-ligand that are overlapping with these d-orbitals. Since the orbitals of the equatorial OH ligand also overlap with the dxz orbital, and their overlap is dependent on the OH ligand orientation, it is reasonable to expect that the OH ligand orientation will affect the inequivalence of the dxz and dyz orbitals and the hfi and nqi parameters of the 17O-oxo.
Fig. 9 shows the results of DFT calculations of the hfi and nqi parameters of the 17O-oxo ligand as a function of θOH. The calculated aiso and e2Qq/h are about 40% smaller than the respective experimental values. The DFT results presented elsewhere30 for the model synthetic complex [Mo17O(SPh)4]− and for the Mo center of lpH SO26 were of similar quality. Currently, the origins of the low accuracy of the calculated parameters for the 17O-oxo ligand are not clear since the above two reports, this work, and earlier CW EPR publications58,59 represent the only available sources of experimental data that could be used for comparison and refinement of the DFT methodology as applied to oxo-Mo(V) systems.
Fig. 9.
Hyperfine and quadrupole interaction parameters of the oxo-17O ligand calculated by DFT as a function of the orientation of the OH ligand. Grey strips correspond to the experimental values.
Keeping the accuracy issues in mind, it is still interesting to note that, while the calculated aiso and e2Qq/h are practically independent of θOH, the nqi asymmetry parameter, η, shows a strong dependence on θOH. When the OH ligand is near the equatorial plane (θOH~90° and 270°), the nqi tensor becomes nearly axial (η ~ 0), while for the OH direction being significantly out of the equatorial plane, the nqi tensor becomes very rhombic. In particular, for θOH corresponding to small hfi constants of the OH ligand proton (see below) the calculated η approaches 1, in agreement with our experimental measurements.
b Equatorial OH ligand
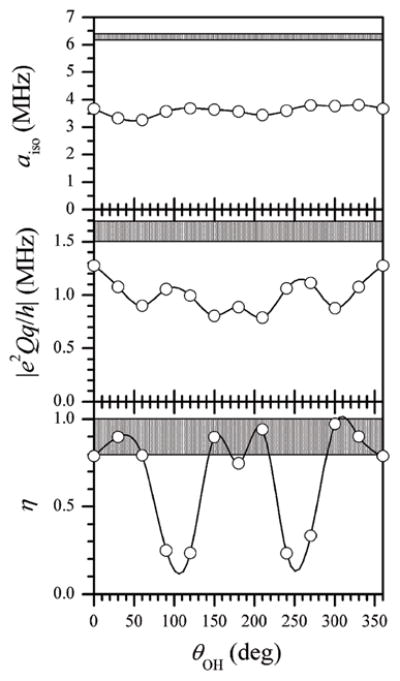
Fig. 10 shows the calculated 1H and 17O hfi constants for the equatorial OH ligand. The proton hfi constant is mostly determined by the overlap of the OH bond orbital with the Mo(V) dxy orbital and is rather accurately described by a simple approximate expression: aH~ −9.5+57·cos2(θOH+90°) [MHz]. In contrast, the oxygen hfi constant, aO, has comparable contributions from the valence orbitals that are not involved in σ-bonding with Mo(V). If all three of these orbitals were strictly equivalent and the geometry of the Mo(V) SOMO were perfectly planar (dxy orbital), then aO would not depend on θOH. However, the OH bond orbital is not equivalent to the two lone pair orbitals, and this results in the oscillating dependence of aO.
Fig. 10.

Hyperfine and quadrupole interaction parameters of 1H (top panel) and 17O (middle and bottom panels) of the OH ligand calculated by DFT as a function of the orientation of this ligand. Dark and light grey strips indicate the experimental values for hpH and lpH SOEs, respectively. For the 17O quadrupole coupling constant the experimental value is unavailable.
Throughout the complete range of θOH, aO remains negative, indicating the presence of total positive spin population in the oxygen valence orbital system. The first minimum of aO (maximum of |aO|), at θOH ~ 90°, is much less pronounced then the second minimum, at θOH ~ 270°. A similar effect is also seen for aH (the two oscillations have somewhat different sizes), although it is much less pronounced than that observed for aO. The inequivalence of the situations with θOH~90° and 270° obviously reflects the slight asymmetry of the Mo(V) SOMO related to the electronic inequivalence of the Mo–S(MPT) and Mo–S(Cys) bonds, as well as the geometrical distortions of the Mo(V) center in SOEs.
The experimental hfi constants for the equatorial hydroxo 1H and 17O in lpH SO are (aH, |aO|) ≈ (26, 26) [MHz], and they are reasonably reproduced by the DFT calculation at θOH ~ 230° and 310° (see Fig. 10). In contrast, the hfi constants (aH, |aO|) ≈ (0, 37) [MHz] found for hpH SO are not reproduced simultaneously at any θOH. Moreover, the DFT calculations predict a synphase variation of aH and |aO| as a function of θOH, which seems to be incompatible with the experimental observation that the smaller experimental aH corresponds to the larger experimental |aO|. Since even the predicted trend of the variation of aH and aO with θOH in this case is in disagreement with the experimental results, it is very likely that the discrepancy is not related to a limited accuracy of the DFT calculations, but is rather caused by an overly simplistic structural model that does not include any interactions of the ligands (mostly, the OH ligand) with second sphere molecules. The observation of the weakly coupled 17O in this work and an earlier observation of two (rather than one) nearby exchangeable protons in hpH SO46 each testify in favor of this explanation.
Finally, the bottom panel of Fig. 10 shows the 17O-hydroxo quadrupole coupling constant estimated by DFT. The calculated constant is virtually independent of θOH, always remaining close e2Qq/h ~ −8 MHz. The nqi asymmetry parameter also did not show much variation with θOH, always remaining close to 0.6 (η = 0.58 ± 0.05). Both nqi parameters can obviously change if the H-bonding of the hydroxo ligand is incorporated into the calculation.
c Weakly coupled 17O
The origin of the observed weakly-coupled exchangeable 17O is not immediately clear. From general considerations it is evident that an isotropic hfi constant of several MHz can only be caused by a relatively efficient through-bond propagation of spin density from the Mo(V) center to the oxygen atom in question. Several conceivable structural models that could allow for this possibility are shown in Fig. 11, including 17OH (or H2 17O) (a) weakly coordinated at the axial position trans to the oxo ligand; (b) hydrogen-bonded to the oxygen of the equatorial hydroxo ligand; (c) hydrogen-bonded to the hydrogen of the equatorial hydroxo ligand; or (d) SO4 2− hydrogen-bonded to the equatorial OH ligand in the active site pocket of the protein in vitro. Model (d) requires that the H-bonded oxygen of the sulfate be 17O (presumably formed during the reaction of sulfite with the 17O labeled Mo(VI) center).
Fig. 11.
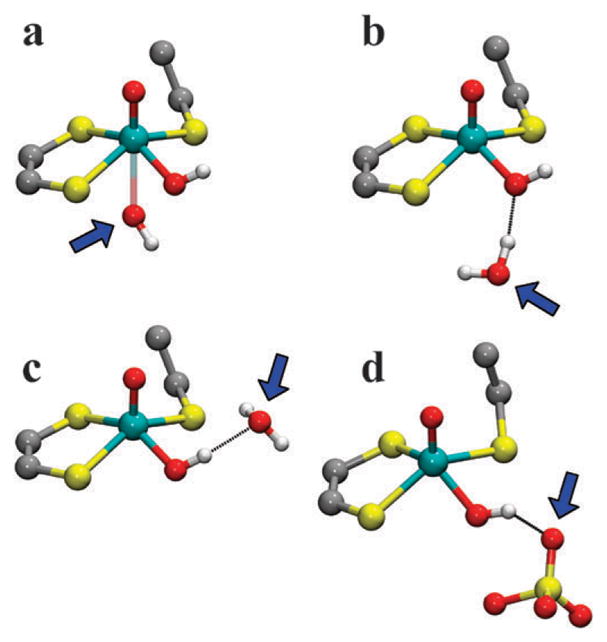
Structural models that may account for the ESEEM observation of the weakly coupled exchangeable 17O at the Mo(V) center of hpH SOEs (indicated by a blue arrow in each structure): 17OH (or H2 17O) (a) weakly coordinated at the axial position trans to the oxo ligand; (b) hydrogen-bonded to the oxygen of the equatorial hydroxo ligand; (c) hydrogen-bonded to the hydrogen of the equatorial hydroxo ligand; or (d) 17OSO3 2− hydrogen-bonded to the equatorial OH ligand.
As a preliminary consideration, model (a) may prove unrealistic due to electronic reasons and because the available space between the Mo center and the active site Arg residue would be insufficient to accommodate such an axial ligand.25 Models (c) and (d) are unlikely to result in any measurable hfi constant of the H-bonded remote oxygen because the H-bond is nearly perpendicular to the plane of the Mo(V) dxy orbital. Only model (b) is expected to result in a measurable aiso of the remote 17O. Work is currently underway to investigate each of these possibilities using DFT. However, unlike the simple DFT calculations discussed above, these calculations must include interactions with nearby protein surroundings that would stabilize the position of the second sphere OH or SO4 2−. This will be the subject of a separate work.
Summarizing the results obtained for the hpH SOEs from vertebrates and bacteria, we may note that similar hfi parameters of the 17O ligands, taken together with the earlier data for the OH ligand proton21,22 and the similarity of the g-tensors, suggest that the Mo center structures in the hpH SOEs of these very different organisms are nearly identical.
The Y236F mutation has no substantial effect on the hfi constant of the equatorial 17O. However, if the tyrosine were hydrogen-bonded to the OH ligand, an appreciable difference would be expected between the wt and mutant enzymes. Instead, the weakly coupled oxygen that was detected for the wt enzymes became unobservable for Y236F SDH. A possible explanation of these observations is that the tyrosine in hpH SOEs does not interact directly with the equatorial hydroxo ligand, but rather forms a hydrogen bond to a second sphere 17O-containing species (likely, OH or H2O) detected in the ESEEM spectra. Substitution of the tyrosine by phenylalanine removes the hydrogen bond to this species and results in a change of its position relative to the OH ligand. Such structural rearrangement may lead to a significantly smaller spin density delocalization onto the remote 17O, rendering it unobservable by ESEEM.
Conclusions
In this work, we have used 17O ESEEM spectroscopy to study the exchangeable oxygens in samples of hpH cSO and SDH. For the exchangeable oxo ligand of hpH cSO, detailed high resolution data were obtained and analyzed. For the equatorial hydroxo 17O, the hfi parameters were accurately measured for the first time, although the nqi parameters could not be determined. Because of the very strong hfi of the hydroxo 17O in hpH SOEs, the reliable observation of ESEEM spectra for this oxygen could only be done using the τ-integrated three-pulse ESEEM. In addition to the two ligand 17O nuclei, a third 17O nucleus was detected. This oxygen nucleus has a nearly isotropic hfi, and it is likely to belong to a second-sphere OH hydrogen-bonded to the equatorial hydroxo ligand.
The preliminary DFT calculations were performed using a simplified structural model that did not include any interactions of the Mo(V) center or its ligands with any other group. The θOH dependences of 1H and 17O hfi constants for the hydroxo ligand, were incompatible with the combined experimental results for the lpH and hpH forms of SOEs. This indicates that θOH is not the only structural parameter responsible for spectroscopic differences between the lpH and hpH forms. More advanced computational models that accurately reflect the structure of the active site should clarify other structural differences and establish the origin of the remote weakly coupled 17O. This work is currently in progress.
Supplementary Material
Acknowledgments
This investigation was made possible by the NIH (GM-37773 to JHE) and by grants from the NSF (DBI-0139459, DBI-9604939, BIR-9224431) and the NIH (S10RR020959) for development of the pulsed EPR facility. FN gratefully acknowledges financial support of this work by the German Science Foundation (grant NE 690/6-1). We thank Dr Arnold Raitsimring for stimulating discussions.
Footnotes
Electronic supplementary information (ESI) available: X-Band EPR spectra of cSO in H217O and H217O; detailed assignment of various spectral lines seen in two-pulse ESEEM spectra of Fig. 4; representative 17O ESEEM spectra of hpH wt and Y236F SDH; FT spectra of τ-integrated ESEEM of hpH cSO obtained without extrapolation into the dead time. See DOI: 10.1039/b907029j
Contributor Information
Andrei V. Astashkin, Email: andrei@u.arizona.edu.
Frank Neese, Email: neese@thch.uni-bonn.de.
Ulrike Kappler, Email: u.kappler1@uq.edu.au.
Notes and references
- 1.Rajagopalan KV. In: Molybdenum and Molybdenum-Containing Enzymes. Coughlan MP, editor. Pergamon; Oxford: 1980. pp. 243–272. [Google Scholar]
- 2.Suzuki I. Methods Enzymol. 1994;243:447–454. [Google Scholar]
- 3.Kappler U, Dahl C. FEMS Microbiol Lett. 2001;203:1. doi: 10.1111/j.1574-6968.2001.tb10813.x. [DOI] [PubMed] [Google Scholar]
- 4.Kappler U, Bailey S. J Biol Chem. 2005;280:24999–25007. doi: 10.1074/jbc.M503237200. [DOI] [PubMed] [Google Scholar]
- 5.Kappler U, Bailey S, Feng C, Honeychurch MJ, Hanson GR, Bernhardt PV, Tollin G, Enemark JH. Biochemistry. 2006;45:9696–9705. doi: 10.1021/bi060058b. [DOI] [PubMed] [Google Scholar]
- 6.Schrader N, Fischer K, Theis K, Mendel RR, Schwarz G, Kisker C. Structure. 2003;11:1251–63. doi: 10.1016/j.str.2003.09.001. [DOI] [PubMed] [Google Scholar]
- 7.Hille R. Chem Rev. 1996;96:2757–2816. doi: 10.1021/cr950061t. [DOI] [PubMed] [Google Scholar]
- 8.Emesh S, Rapson TD, Rajapakshe A, Kappler U, Bernhardt PV, Tollin G, Enemark JH. Biochemistry. 2009;48:2156–2163. doi: 10.1021/bi801553q. [DOI] [PMC free article] [PubMed] [Google Scholar]
- 9.Cohen HJ, Fridovich I, Rajagopalan KV. J Biol Chem. 1971;246:374. [PubMed] [Google Scholar]
- 10.Kessler DL, Rajagopalan KV. J Biol Chem. 1972;247:6566. [PubMed] [Google Scholar]
- 11.Lamy MT, Gutteridge S, Bray RC. Biochem J. 1980;185:397. doi: 10.1042/bj1850397. [DOI] [PMC free article] [PubMed] [Google Scholar]
- 12.Gutteridge S, Lamy MT, Bray RC. Biochem J. 1980;191:285. doi: 10.1042/bj1910285. [DOI] [PMC free article] [PubMed] [Google Scholar]
- 13.Bray RC, Gutteridge S, Lamy MT, Wilkinson T. Biochem J. 1983;211:227. doi: 10.1042/bj2110227. [DOI] [PMC free article] [PubMed] [Google Scholar]
- 14.George GN, Garrett RM, Graf T, Prince RC, Rajagopalan KV. J Am Chem Soc. 1998;120:4522–4523. [Google Scholar]
- 15.Kappler U, Bennett B, Rethmeier J, Schwarz G, Deutzmann R, McEwan AG, Dahl C. J Biol Chem. 2000;275:13202–13212. doi: 10.1074/jbc.275.18.13202. [DOI] [PubMed] [Google Scholar]
- 16.Eilers T, Schwarz G, Brinkmann H, Witt C, Richter T, Nieder J, Koch B, Hille R, Hansch R, Mendel RR. J Biol Chem. 2001;276:46989–46994. doi: 10.1074/jbc.M108078200. [DOI] [PubMed] [Google Scholar]
- 17.Astashkin AV, Johnson-Winters K, Klein EL, Byrne RS, Hille R, Raitsimring AM, Enemark JH. J Am Chem Soc. 2007;129:14800–14810. doi: 10.1021/ja0704885. [DOI] [PMC free article] [PubMed] [Google Scholar]
- 18.Raitsimring AM, Astashkin AV, Feng C, Wilson HL, Rajagopalan KV, Enemark JH. Inorg Chim Acta. 2008;361:941–946. doi: 10.1016/j.ica.2007.05.023. [DOI] [PMC free article] [PubMed] [Google Scholar]
- 19.Astashkin AV, Johnson-Winters K, Klein EL, Feng C, Wilson HL, Rajagopalan KV, Raitsimring AM, Enemark JH. J Am Chem Soc. 2008;130:8471–8480. doi: 10.1021/ja801406f. [DOI] [PMC free article] [PubMed] [Google Scholar]
- 20.Raitsimring AM, Pacheco A, Enemark JH. J Am Chem Soc. 1998;120:11263–11278. [Google Scholar]
- 21.Astashkin AV, Mader ML, Pacheco A, Enemark JH, Raitsimring AM. J Am Chem Soc. 2000;122:5294–5302. [Google Scholar]
- 22.Raitsimring AM, Kappler U, Feng C, Astashkin AV, Enemark JH. Inorg Chem. 2005;44:7283–7285. doi: 10.1021/ic0509534. [DOI] [PubMed] [Google Scholar]
- 23.Astashkin AV, Raitsimring AM, Feng C, Johnson JL, Rajagopalan KV, Enemark JH. Appl Magn Reson. 2002;22:421. [Google Scholar]
- 24.Astashkin AV, Raitsimring AM, Feng C, Johnson JL, Rajagopalan KV, Enemark JH. J Am Chem Soc. 2002;124:6109–6118. doi: 10.1021/ja0115417. [DOI] [PubMed] [Google Scholar]
- 25.Pacheco A, Basu P, Borbat P, Raitsimring AM, Enemark JH. Inorg Chem. 1996;35:7001. doi: 10.1021/ic9607806. [DOI] [PubMed] [Google Scholar]
- 26.Klein EL, Astashkin AV, Ganyushin D, Riplinger C, Johnson-Winters K, Neese F, Enemark JH. Inorg Chem. 2009;48:4743–4752. doi: 10.1021/ic801787s. [DOI] [PMC free article] [PubMed] [Google Scholar]
- 27.Cramer SP, Johnson JL, Rajagopalan KV, Sorrell TN. Biochem Biophys Res Commun. 1979;91:434–439. doi: 10.1016/0006-291x(79)91540-7. [DOI] [PubMed] [Google Scholar]
- 28.Astashkin AV, Enemark JH, Raitsimring AM. Concepts Magn Reson, Part B. 2006;29b:125–136. [Google Scholar]
- 29.Astashkin AV, Feng C, Raitsimring AM, Enemark JH. J Am Chem Soc. 2005;127:502–503. doi: 10.1021/ja0461466. [DOI] [PubMed] [Google Scholar]
- 30.Astashkin AV, Neese F, Raitsimring AM, Cooney JJA, Bultman E, Enemark JH. J Am Chem Soc. 2005;127:16713–16722. doi: 10.1021/ja055472y. [DOI] [PubMed] [Google Scholar]
- 31.Becke AD. Phys Rev A: At, Mol, Opt Phys. 1988;38:3098–3100. doi: 10.1103/physreva.38.3098. [DOI] [PubMed] [Google Scholar]; Perdew JP. Phys Rev B: Condens Matter Mater Phys. 1986;33:8822–8824. doi: 10.1103/physrevb.33.8822. [DOI] [PubMed] [Google Scholar]
- 32.Schäfer A, Horn H, Ahlrichs R. J Chem Phys. 1992;97:2571–2577. [Google Scholar]; Schäfer A, Huber C, Ahlrichs R. J Chem Phys. 1994;100:5829–5835. [Google Scholar]; Weigend F, Haeser M, Patzelt H, Ahlrichs R. 2006 ftp://ftp.chemie-karlsruhe.de/pub/basen.
- 33.Pantazis DA, Chen XY, Landis CR, Neese F. J Chem Theory Comput. 2008;4:908–919. doi: 10.1021/ct800047t. [DOI] [PubMed] [Google Scholar]
- 34.Klamt A, Schüürmann G. J Chem Soc, Perkin Trans 2. 1993;2:799. [Google Scholar]
- 35.Sinnecker S, Neese F. J Comput Chem. 2006;27:1463–1475. doi: 10.1002/jcc.20426. [DOI] [PubMed] [Google Scholar]
- 36.Baerends EJ, Ellis DE, Ros P. Chem Phys. 1973;2:41–51. [Google Scholar]; Dunlap BI, Connolly JWD, Sabin JR. J Chem Phys. 1979;71:3396–3402. [Google Scholar]; Eichkorn K, Treutler O, Öhm H, Häser M, Ahlrichs R. Chem Phys Lett. 1995;240:283–289. [Google Scholar]; Eichkorn K, Weigend F, Treutler O, Ahlrichs R. Theor Chem Acc. 1997;97:119. [Google Scholar]
- 37.van Lenthe E, Baerends EJ, Snijders JG. J Chem Phys. 1993;99:4597–4610. [Google Scholar]
- 38.van Wüllen C. J Chem Phys. 1998;109:392–399. [Google Scholar]
- 39.van Lenthe JH, Faas S, Snijders JG. Chem Phys Lett. 2000;328:107–112. [Google Scholar]
- 40.Kisker C, Schindelin H, Pacheco A, Wehbi WA, Garrett RM, Rajagopalan KV, Enemark JH, Rees DC. Cell. 1997;91:973–983. doi: 10.1016/s0092-8674(00)80488-2. [DOI] [PubMed] [Google Scholar]
- 41.Karakas E, Wilson HL, Graf TN, Xiang S, Jaramillo-Busquets S, Rajagopalan KV, Kisker C. J Biol Chem. 2005;280:33506–33515. doi: 10.1074/jbc.M505035200. [DOI] [PubMed] [Google Scholar]
- 42.Becke AD. J Chem Phys. 1993;98:5648–5652. [Google Scholar]; Lee C, Yang W, Parr RP. Phys Rev B: Condens Matter Mater Phys. 1988;37:785–789. doi: 10.1103/physrevb.37.785. [DOI] [PubMed] [Google Scholar]
- 43.van Lenthe E, Baerends EJ. J Chem Phys. 2000;112:8279–8292. [Google Scholar]
- 44.Neese F, Wolf A, Fleig T, Reiher M, Hess BA. J Chem Phys. 2005;122:204107–1. doi: 10.1063/1.1904589. [DOI] [PubMed] [Google Scholar]
- 45.van Lenthe E, van der Avoird A, Wormer PES. J Chem Phys. 1998;108:4783–4796. [Google Scholar]
- 46.Enemark JH, Astashkin AV, Raitsimring AM. Dalton Trans. 2006:3501–3514. doi: 10.1039/b602919a. [DOI] [PubMed] [Google Scholar]
- 47.Astashkin AV, Raitsimring AM. J Magn Reson. 2000;143:280–291. doi: 10.1006/jmre.1999.1988. [DOI] [PubMed] [Google Scholar]
- 48.Enemark JH, Astashkin AV, Raitsimring AM. In: Biological Magnetic Resonance. Hanson G, Berliner L, editors. Vol. 29. Springer; 2010. [DOI] [PMC free article] [PubMed] [Google Scholar]
- 49.Mims WB. Phys Rev B: Condens Matter Mater Phys. 1972;6:3543–3545. [Google Scholar]
- 50.Fauth JM, Schweiger A, Braunschweiler L, Forrer J, Ernst RR. J Magn Reson. 1986;66:74. [Google Scholar]
- 51.Astashkin AV, Kawamori A. J Magn Reson, Ser A. 1995;112:24–29. [Google Scholar]
- 52.Verhoeven J, Dymanis A, Bluyssen H. J Chem Phys. 1969;50:3330–3338. [Google Scholar]
- 53.Edmonds DT, Zussman A. Phys Lett. 1972;41A:167. [Google Scholar]
- 54.Raitsimring AM, Astashkin AV, Baute D, Goldfarb D, Caravan P. J Phys Chem A. 2004;108:7318–7323. [Google Scholar]
- 55.Raitsimring AM, Astashkin AV, Feng C, Enemark JH, Nelson KJ, Rajagopalan KV. JBIC, J Biol Inorg Chem. 2003;8:95–104. doi: 10.1007/s00775-002-0393-8. [DOI] [PubMed] [Google Scholar]
- 56.Gutteridge S, Tanner SJ, Bray RC. Biochem J. 1978;175:887. doi: 10.1042/bj1750887. [DOI] [PMC free article] [PubMed] [Google Scholar]
- 57.Wilson GL, Greenwood RJ, Pilbrow JR, Spence JT, Wedd AG. J Am Chem Soc. 1991;113:6803–6812. [Google Scholar]
- 58.Hanson GR, Brunette AA, McDonell AC, Murray KS, Wedd AG. J Am Chem Soc. 1981;103:1953–1959. [Google Scholar]
- 59.Hanson GR, Wilson GL, Bailey TD, Pilbrow JR, Wedd AG. J Am Chem Soc. 1987;109:2609–2616. [Google Scholar]
Associated Data
This section collects any data citations, data availability statements, or supplementary materials included in this article.