

Abstract
Auditory neurons in the inferior colliculus (IC) show remarkable selectively in that they can distinguish between complex sounds that have identical spectral energy but different temporal structure, such as frequency modulations (FMs) that sweep either upward or downward. Extracellular recordings show that blocking inhibition locally reduces or eliminates response selectivity, suggesting that selectivity is created de novo in the IC, with inhibition playing a prominent role. However, these studies can only infer underlying mechanisms based on spike counts. Using in vivo whole-cell recordings, we examine the mechanisms underlying FM directional selectivity in the IC. We first report that spike threshold can strongly amplify directional selectivity in that the spike directionality was on average more than twice as large as the directionality of the postsynaptic potentials (PSPs). We then show that, in our sample of IC cells, PSP directional selectivity is not created de novo. Rather, we found that the preferred and null FMs evoked synaptic conductances of different magnitudes, indicating that the presynaptic neurons were directionally selective. Combining conductance data with modeling, we show that directionally dependent magnitude differences, not temporal differences, underlie PSP directionality. Modeling also shows that our results are consistent with extracellular studies in which blocking inhibition reduces or eliminates directionality. Our findings suggest that some IC cells use a rate code in their inputs rather than a time code and that highly selective discharge properties can be created by only minor adjustments in the synaptic strengths evoked by different signals.
Introduction
Frequency modulation (FM) is a critical component of auditory scene analysis (Bregman, 1990) and is nearly ubiquitous in animal communication (Ryan, 1983; Wang et al., 1995; Doupe and Kuhl, 1999; Bohn et al., 2008), including speech. In higher auditory nuclei, many neurons fire preferentially or exclusively to one FM direction (preferred) compared with the other (null) (Suga, 1968; Fuzessery and Hall, 1996; Koch and Grothe, 1998; Woolley and Casseday, 2005; Razak and Fuzessery, 2006; Andoni et al., 2007). In most mammals, neurons in the inferior colliculus (IC) and cortex are directionally selective for upward and downward FM sweeps in approximately equal numbers (Poon et al., 1991; Nelken and Versnel, 2000; Zhang et al., 2003), whereas in bats there is a strong bias for downward FMs, consistent with the prevalence of downward FM sweeps in their echolocation and communication signals (Suga, 1968; Fuzessery et al., 2006; Andoni et al., 2007; Voytenko and Galazyuk, 2007).
Selectivity for FM direction is not present in the auditory nerve and thus has to be constructed somewhere in the auditory pathway (Britt and Starr, 1976; Sinex and Geisler, 1981). It is generally believed that the de novo construction of this selectivity first occurs in the IC (Poon et al., 1992; Fuzessery and Hall, 1996; Casseday et al., 1997; Fuzessery et al., 2006; Andoni et al., 2007; Voytenko and Galazyuk, 2007), the midbrain structure in which nearly all of the brainstem output converges before ascending to the thalamus and cortex (Oliver and Morest, 1984; Pollak and Casseday, 1986; Casseday et al., 2002).
Two hypotheses have been proposed to explain how directional selectivity is created in the IC (Suga, 1968; Fuzessery, 1994; Fuzessery and Hall, 1996; Casseday et al., 2002). Both incorporate differences between the timing of inputs evoked by the preferred and null FMs. Furthermore, both assume that the excitatory and inhibitory inputs to the IC are nondirectional, and thus the preferred and null FMs evoke excitatory conductances of equal magnitude and inhibitory conductances of equal magnitude. One hypothesis posits a timing asymmetry between excitation and inhibition, in which the preferred FM activates excitation first, whereas the null FM activates inhibition first. When excitation arrives first, the inputs evoke a larger peak depolarization and thus more spikes than when inhibition arrives first. The second hypothesis posits that directionality is generated by the relative coincidence in the arrival of the inputs that comprise the total synaptic conductance. More coincident arrival generates a more powerful synaptic input, whereas less coincident arrival generates a less powerful input. Thus, compared with the null, the preferred FM would evoke more coincident excitatory input and/or less coincident inhibitory input. The two hypotheses outlined above are not mutually exclusive and are supported by extracellular recordings from IC cells, including those in which blocking inhibition reduces or eliminates FM directionality (Fuzessery and Hall, 1996; Koch and Grothe, 1998; Andoni et al., 2007).
Alternatively, directionality may not be created de novo in the IC, but rather the inputs to the IC are themselves at least partially directional. The preferred and null FMs would evoke synaptic conductances of different magnitude in the IC, and this “input magnitude asymmetry” could produce directionality, as has been demonstrated in the auditory cortex (Zhang et al., 2003). This hypothesis has received little attention in the IC because previous studies indicate that most, although not all, cells in lower auditory nuclei are nondirectional (Suga, 1968; Britt and Starr, 1976; Vater, 1982; Zhao and Liang, 1996; Huffman et al., 1998b; Bauer et al., 2002; Xie et al., 2005). However, the possibility that FM directionality may be at least partially inherited has never been directly tested.
Most previous studies addressing FM directionality in the IC used extracellular electrodes and thus inferred the underlying mechanisms from spike counts (Casseday et al., 1997; Koch and Grothe, 1998; Fuzessery et al., 2006; Andoni et al., 2007). Here, we use in vivo whole-cell recordings in unanesthetized Mexican free-tailed bats to more directly determine how FM directionality is generated in the IC. We show that spike threshold can amplify small directionalities in the postsynaptic potentials (PSPs) to generate large directionalities in the spikes. We also show that the preferred and null FMs evoke synaptic conductances of different magnitude, indicating that the presynaptic cells are themselves directional and that the magnitude asymmetries are more important than the temporal asymmetries in generating PSP directionality. Finally, we evaluate how excitation, inhibition, and spike threshold can work together to convert a relatively small PSP directionality into a larger directionality in the spikes.
Materials and Methods
Surgical procedures.
Experiments were conducted on Mexican free-tailed bats, Tadarida brasilensis mexicana, captured from local sources in Austin, Texas. Surgical procedures were as described in a previous report (Xie et al., 2008). In brief, bats were sedated with isoflurane (inhalation) and then anesthetized with an intraperitoneal injection of ketamine/xylazine (75–100 mg/kg ketamine, 11–15 mg/kg xylazine; Henry Schein). Recordings began after recovery from the anesthetic, and thus all data were obtained from awake animals. Water was presented periodically with an eyedropper. Bats typically lay quietly during the experiments. If they showed signs of discomfort, data collection was stopped and doses of the neuroleptic, ketamine hydrochloride (1:40 dilution, 0.01 ml injection) were administered. All experimental procedures were in accordance with a protocol approved by the University of Texas Institutional Animal Care Committee.
Electrophysiology.
Electrodes (4–9 MΩ) were pulled from thick-walled (1.65 mm outer diameter, 1.1 mm inner diameter) capillary glass (catalog #PG52165-4; WPI). The standard internal solution contained the following (in mm): 115 K-gluconate, 10 HEPES, 20 KCl, 4 MgATP, 0.3 Na2GTP, 0.5 EGTA, and 10 Na2 phosphocreatine. Reported membrane potentials were not corrected for liquid junction potentials. In three cells, cesium was substituted for potassium to minimize the effects of voltage-gated potassium currents, and 1 mm QX-314 [N-(2,6-dimethylphenylcarbamoylmethyl)triethylammonium bromide] was included to block sodium channels. Results from these recordings were similar to recordings made with the standard internal solution, and so the data were combined.
Responses were sent to a Dagan BVC 700A bridge and voltage-clamp amplifier and then to an InstruTech ITC-18/PCI analog-to-digital converter and a Macintosh G-4 computer (Apple Computers). Acoustic and electrical stimuli were generated with IGOR PRO (Wavemetrics). Sound was presented in free field from a 3 inch ribbon tweeter (Fountek JP3.0; Madisound Speakers) positioned 30–40° on the side contralateral to the IC from which recordings were made. The speaker was flat ±6 dB from 3 to 80 kHz. Speakers were calibrated with ¼ inch Brüel and Kjær microphones.
Cell search was conducted in voltage-clamp mode using a −5 mV step to monitor electrode resistance. Electrodes were lowered into the IC with a piezoelectric microdrive (Burleigh Inchworm; EXFO Burleigh) while under positive pressure of 2–3 psi. Electrodes were lowered to a depth of ∼300 μm to bypass the external nucleus of the IC and ensure recordings were made from cells in the central nucleus of the IC. Cells were recorded at depths ranging from ∼300 to 1200 μm. Once reaching 300 μm, the pressure was reduced to 0.3–0.7 psi. When contact with a cell was made, pressure was released and a small amount of negative pressure (<0.5 psi) was applied to obtain a gigaohm seal. After a seal was obtained, additional negative pressure was applied to break in, and the amplifier was switched to whole-cell current-clamp mode. Adjustments for access resistance were performed offline.
Sound presentation.
After making a gigaohm seal and breaking in, FMs were presented in sets comprising two identical sweeps differing only in that one swept downward and the other upward. FMs were generated digitally at 200 kHz and swept logarithmically over 1 octave, a bandwidth similar to that used in the bat's communication and echolocation signals (Bohn et al., 2008). The starting frequencies of the FM sweeps were adjusted to evoke the largest excitatory response and then fixed while the cell was probed with a broad range of FM sets using different rates and intensities (5–320 octaves/s and 15–75 dB sound pressure level). We presented 5–20 repetitions of each FM set. To determine directional selectivity of the cell, only responses to FM sets were used in which the FM that evoked the most spikes (preferred FM) had a spike probability >40%. If neither FM direction had a spiking probability >40%, then the FM set was excluded from the analysis. One or two FM sets were chosen for the experiments in which we derived FM-evoked conductances. Unless otherwise stated, we present means ± SEM and determined significance using Student's t test at the 95% confidence level. Because substantial time periods and stable recordings were required to obtain conductances, we did not obtain tuning curves but rather focused on the responses to FM sweeps that evoked the strongest discharges.
Estimating access resistance, membrane resistance, and membrane capacitance.
Electrode capacitance was minimized by capacity compensation, and then access resistance, membrane resistance, membrane capacitance, and membrane time constant were estimated by fitting voltage responses to small hyperpolarizing current steps (25–100 pA, 200 ms duration) with a double exponential:
where V t was the measured change in voltage (total change) in response to the current injection, V p was the steady-state voltage change attributed to the pipette, and V m was the steady-state voltage change attributed to the membrane. The fast and slow time constants were attributed to the pipette (τp) and membrane (τm), respectively. Membrane resistance (R m) was equal to the change in membrane voltage divided by the injected current (R m = V m/I inj). Membrane capacitance (C m) was then calculated as τm divided by R m (C m = τm/R m). Access resistance and electrode capacitance were estimated in a similar way, using the fast components of the fit (V p and τp). In recordings judged acceptable, the fast time constant <1 ms and the associated access resistance was less than the estimated membrane resistance.
Although we got good separation between the fast component and the slow component using the double-exponential fits (>10-fold) (Fig. 1), the fits are an approximation. The membrane response to a current step in a cell with voltage-gated channels and dendrites cannot be described with a single exponential. Any error necessarily affected the calculated conductance magnitudes (see below). With this caveat in mind, estimates of membrane capacitance of the 17 cells shown in Figure 8 were 56 ± 4 pF.
Figure 1.

Estimating membrane resistance and capacitance. Example voltage responses (black) from two different cells to a small hyperpolarizing current step (bottom; −50 pA, 200 ms) and the double-exponential fits (red) used to estimate membrane resistance (R m), membrane capacitance (C m), access resistance (R p), and pipette capacitance (C p). The first 20 ms of the responses (insets) show the separation between the fast (τp) and slow (τm) exponentials. a, A recording with relatively low access resistance compared with the estimated R m (τm = 11.2 ms, R m = 208 MΩ, C m = 54 pF, R p = 58 MΩ, τp = 0.22 ms, C p = 3.8 pF). b, A recording of just-acceptable quality (same cell as Fig. 4): the access resistance was slightly smaller than the estimated R m (τm = 10.3, R m = 168, C m = 61, τp = 0.34, R p = 147, C p = 2.3).
Figure 8.

Conductance measurements were done on relatively slow cells. Membrane time constant and input resistance in 17 cells in which we measured directional selectivity using standard internal and the access resistance were sufficiently low. The seven cells from which we derived conductances (open circles) had relatively slow time constants and high input resistances.
Calculating directional selectivity.
To quantify directional selectivity in the responses to each FM set, we calculated a directional selectivity index (DSI) as (U − D)/(U + D), where U was the response to the upward FM, and D was the response to the downward FM. Responses were spike counts for the spike-DSI and peak PSPs for the PSP-DSI. Peak PSP was measured after filtering spikes and then averaging the individual PSPs. Spikes were filtered from the PSP responses by detecting spike threshold (dV/dt > 10 V/s), interpolating a straight line across the spike waveform and then smoothing. The DSIs for each cell were calculated from responses to all of the FM sets. For the spike-DSI, D was the sum of all the spikes evoked by downward FMs, and U was the sum of the spikes evoked by upward FMs. For the PSP-DSI, we averaged the PSP-DSIs evoked by each FM set.
Spike filtering necessarily introduced error into the measurements of PSP peak amplitudes. Because responses were filtered at spike threshold, a PSP that just reached threshold and one that was substantially suprathreshold would yield similar PSP amplitudes after filtering. The end result is that differences in PSP peak amplitudes of the FM sets that evoked spikes were probably underestimated, and therefore the PSP-DSIs were also underestimated in some FM sets.
Estimating synaptic conductances.
We estimated synaptic conductances as in the study by Priebe and Ferster (2005) using the following:
where C is the cell capacitance, dV m/dt is the slope of the membrane potential, I membrane is the current across the cell membrane, and I inject is the current injected through the electrode. We assumed three sources of membrane current: an excitatory current, an inhibitory current, and a leakage current. Equation 2 can be expanded to include the conductance and driving force terms:
 |
The conductances (g) are as follows: excitatory, g e; inhibitory, g i; leak, g Leak. V m is the measured membrane potential, and the reversal potentials for g leak, g e, and g i are (respectively) V leak, V e, and V i. Most of these terms can be measured or estimated. V m and dV m/dt were measured directly. Capacitance and input resistance (1/g leak) were measured as described above. V e was assumed to be 0 mV, and V i was estimated to be −63 mV from the changes in the PSP polarity while different amounts of constant current were being injected. V leak was resting potential when no current was injected through the electrode. When the cell was hyperpolarized, V leak was calculated from the steady-state V m, the input resistance measured at the steady-state V m, and the injected current. When the cell was hyperpolarized, V leak was typically depolarized with respect to resting potential.
Using the above values, there are only two unknowns in Equation 3, g e and g i. Consequently, conductances can be estimated from FM-evoked responses while hyperpolarizing the cell to only two different steady-state potentials. In practice, we required FM-evoked responses recorded while hyperpolarizing to at least three different steady-state membrane potentials.
As noted above, the estimates of membrane capacitance and membrane resistance are approximate and would necessarily introduce error into the conductance magnitudes estimated using Equation 3. However, the same error would apply equally to the conductance magnitudes derived for both the downward and the upward FMs, and therefore the relative conductance magnitudes are accurate when comparing magnitudes within a single cell. Our arguments concerning the mechanisms that underlie directional selectivity depend only on the relative conductance magnitudes evoked by the upward and downward FM sweeps and not the absolute magnitudes.
Modeling.
Model cells were “point neurons,” consisting only of excitatory, inhibitory and leak conductances with corresponding reversal potentials and a capacitance. We made a unique model cell for each neuron used in the conductance estimates based on the measured input resistance, resting membrane potential (RMP), and capacitance in each cell. For cells in which we estimated conductances from the responses to two FM sets, we used the same model for both conductance sets.
The validity of the conductance estimates was determined by two criteria. As shown in Figure 4, we used the estimated values for g e and g i to predict the voltage responses in the models. Correlation analysis between the predicted PSPs and measured PSPs indicates that the conductance estimates account for >94% of the variance (R 2 > 0.94 for all conductance sets). That predictions were good across a broad range of membrane potentials suggests that the state of voltage-gated channels changed little during the time course of the PSPs and thus had a relatively small effect on our conductance estimates. Second, we excluded analyses that found negative values for conductance. This requirement assumed that the ligand-gated channels were closed (0 nS) before sound presentation, and thus the conductances could only get larger. This is a reasonable assumption because there was little or no spontaneous activity in the IC cells. The absence or near absence of spontaneous activity is a common finding in the IC of bats (Vater et al., 1979; Klug et al., 1999; Bauer et al., 2000). The occasional spontaneous PSP that was obvious was excluded from analysis. In practice, negative conductance values were obtained when the access resistance was too high to determine the actual membrane potentials. These datasets were excluded.
Figure 4.

Estimated synaptic conductances predict membrane responses. a, Five responses to the preferred and null FMs at rest (RMP of −42 mV). Fraction shows number of spikes per number of trials, and FM times are shown below voltage traces. b, To derive the conductances, we measured voltage responses to preferred and null FMs while the cell was hyperpolarized to different potentials with constant current [black; average of 10 trials, spikes filtered from responses at RMP (top row)]. Predicted responses (dashed red) from the derived conductances shown in c closely match measured responses. c, Estimated conductance traces derived from the black traces in b. FM times shown below traces, and gray indicates 95% confidence (bootstrapping). d, Predicted membrane responses closely match the measured membrane responses. Points plotted after the onset of the sound-evoked response. The solid line passes through the origin and has a slope of 1. The estimated conductances account for >99% of the variance in this example.
Results
We measured response preferences for the direction of FM sweeps in 24 cells in the IC of awake Mexican free-tailed bats by presenting one to nine FM sets and recording spikes and PSPs with patch electrodes. Each FM set consisted of two FMs that were identical in terms of frequency range and duration but differed in sweep direction, in which one swept upward and the other downward. FM rate and/or intensity was varied between sets for a total of 130 FM sets in the 24 cells. To quantify directionality, we calculated a DSI as (U − D)/(U + D) from responses to each FM set. U and D were the responses (spikes or peak depolarization after filtering spikes) to upward and downward FMs, respectively. DSIs could range from −1 to 1, with a positive number indicating a preference for upward FMs, a negative number indicating a preference for downward FMs, and 0 indicating no directional preference. Cells recorded using the standard internal solution had resting potentials between −40 and −60 mV (mean of −47 ± 6 mV). No corrections were made for liquid junction potentials. In 10 cells, we derived the excitatory and inhibitory conductances evoked by one or two FM sets for a total of 17 conductance sets.
In the sections below, we evaluate three issues. First we consider how spike threshold affects directional selectivity in the spikes by comparing the directional selectivity in the PSPs from each FM set with that in the spike counts evoked by the same FM set. In the second section, we ask whether PSP directional selectivity is created locally in the IC from nonselective inputs that differ only in their timing or whether the inputs themselves are already directionally selective. Finally, we consider the role of inhibition in shaping directional selectivity.
Spike threshold can amplify directional selectivity
Previous intracellular studies across sensory modalities have shown that many neurons expressing a high degree of discharge selectivity for certain stimuli receive innervation that is far less selective than indicated by the discharges (Pena and Konishi, 2000, 2002; Rosen and Mooney, 2003; Priebe et al., 2004; Wilent and Contreras, 2005; Priebe, 2008; Priebe and Ferster, 2008). These cells respond to the signals to which they are selective with suprathreshold PSPs but also respond to stimuli that do not evoke spikes with strong, subthreshold PSPs. The disparity in the spike selectivities compared with the PSP selectivities is attributable to nonlinear influence of spike threshold, in which the larger PSPs exceed threshold and the smaller PSPs are just below threshold. To determine how spike threshold affects FM directional selectivity in IC cells, we compared the PSPs evoked by the upward and downward FMs in each set with the spike counts evoked by the same FM sets (Figs. 2, 3). In 116 of 130 FM sets, the spikes were more directional than the PSPs, indicating that spike threshold amplified directional selectivity.
Figure 2.

Directional selectivity in the PSPs compared with the spikes. Three example cells comparing directional selectivity in the PSPs with that in the spikes. FM sweep times are shown below the voltage traces. Left, Five individual trials of downward (top) and upward FMs. Fractions are number of spikes per number of trials. Right, Average of all trials illustrates PSP directionality. Spikes were filtered before averaging. Spiking traces (truncated) are in gray. a, Both spikes and PSPs were highly directionally selective in this upward selective cell. RMP was −51 mV. b, Both spikes and PSPs were nondirectional in this nonselective cell. RMP was −58 mV. c, In this downward selective cell, spikes were highly directional, but PSPs were not, illustrating how spike threshold can strongly amplify directional selectivity. RMP was −47 mV.
Figure 3.

Spike threshold amplifies directional selectivity. Directional selectivity in the spikes is greater than in the PSPs. a, The distribution of DSIs for PSPs (top) and spikes measured from responses to 130 FM sets (bars with solid lines) in 24 cells (dashed lines). b, Most spike DSIs were greater than their corresponding PSP-DSIs in both the responses to individual FM sets (open circles) and for each cell (filled circles). The DSIs for downward selective responses were multiplied by −1 so that all the spike-DSIs ranged from 0 to 1. A negative PSP-DSI indicates that the FM direction evoking the most spikes (preferred FM) evoked a smaller PSP (see Materials and Methods). Solid unity line indicates that PSP-DSI = spike-DSI. Most points are above the unity line. Dashed lines delineate the criteria for directionally selective responses.
In Figure 2, we show three examples that illustrate the full range of the relationships between spike directionality and PSP directionality. In Figure 3, we show population data. In the first example, spike threshold had a small effect on directionality, because directionalities in both the PSPs and the spikes were large (Fig. 2 a). Both the downward and upward FMs were depolarizing, but the upward FM evoked a large depolarization (11.8 mV), whereas the downward FM evoked a small depolarization (∼0.6 mV). This asymmetry in the PSPs was highly directional, favoring the upward sweep (PSP-DSI of 0.9). The upward PSP evoked seven spikes in 10 trials, whereas the downward PSP evoked no spikes, yielding maximum directionality in the spike counts (spike-DSI of 1.0). In this cell, directionality was almost fully expressed in the PSPs, with only a slight enhancement in the spike counts. Thus, spike threshold had almost no effect on directionality.
In the second example, spike threshold also had essentially no effect on directionality, because the directionalities in the PSPs and the spikes were relatively small (Fig. 2 b). The downward and upward FMs both evoked large depolarizations (24.3 and 22.3 mV, respectively) for a PSP-DSI of −0.04, indicating no directional preference. In five presentations, the downward FM evoked seven spikes and the upward FM evoked six spikes for a spike-DSI of −0.08. Directionality in the spikes was approximately equal to that in the PSPs, and thus spike threshold had no effect on directionality.
In the third example, spike threshold had a large effect on directionality (Fig. 2 c). The downward FM evoked a 15 mV depolarization, and the upward FM evoked a 12.4 mV depolarization (PSP-DSI of −0.09). However, the downward FM evoked five spikes in five trials, whereas the upward FM evoked no spikes (spike-DSI of −1.0). In this cell, the PSPs peaked very close to spike threshold, with the downward evoking a just-suprathreshold PSP and the upward FM evoking a just-subthreshold PSP. Under these conditions, spike threshold strongly amplified spike directionality; a very small directionality in the PSPs was transformed into maximum spike directionality.
Looking at the distribution of PSP and spike directionalities across all cells (Fig. 3 a), we make two observations. First, as shown in a previous study (Andoni et al., 2007), there were more downward preferring cells than upward preferring cells in the IC of these bats. Ninety-seven of 130 FM sets (16 of 24 cells, 67%) had spike-DSIs < 0, indicating a preference for downward FMs. In comparison, only 33 of 130 (8 of 24 cells, 33%) had spike-DSIs > 0, indicating a preference for upward FMs. Second, spike directional preferences were stronger than PSP directional preferences. Over half the FM sets evoked relatively small PSP directionalities with PSP-DSIs between 0.25 and −0.25 (74 of 130, 57%). In contrast, nearly half of the spiking responses had large directionalities with spike-DSIs close to 1 or −1 (61 of 130, 47%).
How spike threshold affects directionality is more clearly seen when we show spike directional selectivity as an absolute value (Fig. 3 b). The spike-DSIs now range from 0 to 1, with 0 indicating no selectivity and 1 indicating maximum selectivity. The PSP-DSIs can range between −1 and 1, with PSP-DSI > 0 indicating a preference for the same (preferred) direction as the spikes, and PSP-DSI < 0 indicating a preference for the opposite (null) direction as the spikes. In 116 of 130 FM sets (23 of 24 cells), the spike-DSI was greater than the PSP-DSI. On average, the spike-DSI was more than twice as large as the PSP-DSI. These data show that, in general, spike threshold amplified FM directionality in IC cells.
What is also clear is that when the PSP directionality becomes moderate to large, the spiking responses are also consistently directionally selective (Fig. 3 b, dashed lines) (PSP-DSI ≥ 0.25, spike-DSI ≥ 0.3). However, when the directionality in the PSPs is small (PSP-DSI < 0.25), spike directionality is unpredictable, with spike-DSIs ranging from 0 to 1. What is noteworthy is that 33 of 74 FM sets that evoked small PSP directionality (PSP-DSI < 0.25) had moderate to high spike directionalities (spike-DSI > 0.3), and 11 of those sets (six cells) evoked maximum spike directionality (spike-DSI = 1.0). These data further show that spike threshold amplified PSP directionality in many cells so that the spike-DSI > PSP-DSI.
Directionality is not created de novo
To determine whether directional selectivity in the PSPs was created de novo from nondirectional inputs or whether the presynaptic cells were themselves directional, we next derived FM-evoked synaptic conductances in 10 directional cells using one or two FM sets (17 total conductance sets). Cells were considered directionally selective with a spike-DSI ≥ 0.3 or for the FM sets that evoked no spikes, with a PSP-DSI > 0.25 (Fig. 3 b, dashed lines).
We derived the conductances by recording FM responses while the cell was hyperpolarized to various potentials with constant current injection (Fig. 4). In this example, the preferred FM evoked six spikes in 10 trials, whereas the null FM evoked no spikes (Fig. 4 a). To confirm the validity of the derived conductances, we used them to predict the voltage responses in model cells that were based on the same cells from which the conductances were derived. Correlation analysis between the predicted and measured voltages indicates that the conductance estimates account for 99% of the variance in the example cell (R 2 = 0.99) (Fig. 4 d) and >94% across the population.
If PSP directionality was created de novo, then the presynaptic cells should be nondirectional and the total magnitude of the excitatory conductance (area under the curve) evoked by the preferred FM should be equal to the magnitude of the excitatory conductance evoked by the null FM. Similarly, the magnitude of the preferred-evoked inhibitory conductance should be equal to the null-evoked inhibitory conductance. Alternatively, if the presynaptic cells were directional, then the preferred and null conductances should be of different magnitudes.
Excitatory magnitudes evoked by the preferred FM were always larger than the null excitatory magnitudes as shown in the conductance sets from three cells in Figure 5 a–c. In each example, the total preferred excitatory conductance was approximately twice as large as the null (Student's t test, p < 0.01), indicating that the presynaptic cells providing the excitatory inputs were directionally selective. These excitatory magnitude asymmetries were in the same direction as the preferred PSPs and thus “favored” the PSP directionality.
Figure 5.
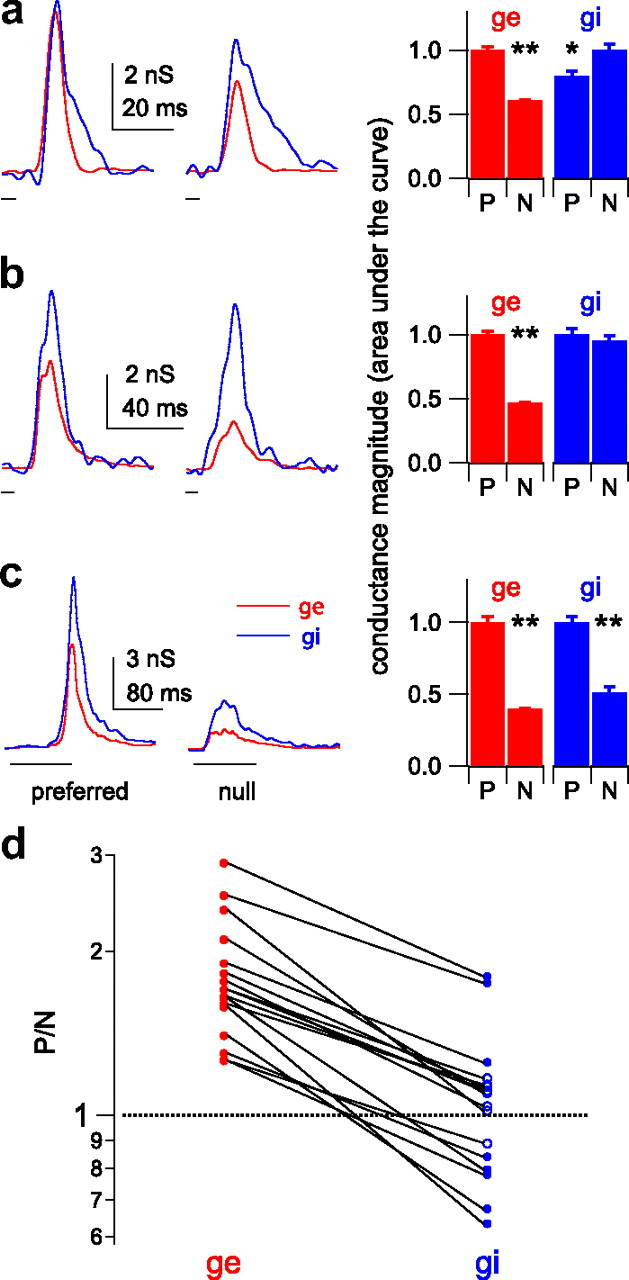
Input magnitude asymmetries show that the presynaptic cells were directionally selective. a–c, Input magnitude asymmetries of conductance sets for three cells. Left column, Preferred (left) and null (right) conductance traces, excitation (g e, red) and inhibition (g i, blue). Sweep timing shown below traces. Right, Total evoked conductance magnitudes (normalized areas under the curves; P, preferred, N, null). The preferred g e is significantly larger than the null g e in each set. a, Preferred inhibition is smaller than the null. b, Preferred and null inhibition are equal. c, Preferred inhibition is larger than the null (*p < 0.05, **p < 0.01, Student's t test). d, The P/N ratios for all 17 conductance sets. For excitation, all 17 P/N ratios were significantly greater than 1, indicating a magnitude asymmetry that favored the preferred sweep (filled red circles; mean of 1.79 ± 0.11). In contrast, the inhibitory P/N ratios varied at ∼1.0 (mean of 1.07 ± 0.08), and only eight were significantly different from 1 (filled blue circles). Five of 17 P/N ratios for inhibition were <1, favoring the preferred sweep. Nine of 17 were not different from 1 (open blue circles), favoring neither direction, and 3 of 17 were >1, favoring the null direction. Lines connect the excitatory and inhibitory conductance sets evoked by the same FM set.
In contrast to excitation, the magnitude relationships between the preferred and null inhibitory conductances were different in each set. For the cell in Figure 5 a (same cell shown in Fig. 4), the area under the preferred inhibitory conductance was significantly smaller than the area under the null inhibitory conductance (p < 0.05), indicating that the presynaptic cells providing the inhibitory inputs were also directionally selective. This inhibitory magnitude asymmetry also favored the PSP directionality; less inhibition evoked by the preferred FM would tend to result in a larger PSP compared with the null. For the cell in Figure 5 b, the preferred and null FMs evoked equal amounts of inhibition, indicating there was no directional selectivity in the responses of the inhibitory presynaptic cells and that the inhibitory conductance magnitudes did not contribute to PSP directionality. Finally, for the cell in Figure 5 c, the preferred FM evoked more inhibition than the null (p < 0.01). This inhibitory conductance magnitude asymmetry favored the null FM, in that more preferred inhibition would tend to result in a smaller preferred depolarization. Unlike excitation, there were not consistent magnitude asymmetries in the inhibitory inputs. Instead, the inhibitory conductance magnitudes sometimes favored the preferred FM, sometimes favored the null FM, and sometimes favored neither sweep direction.
We summarize the magnitude asymmetries for both excitation and inhibition by calculating the ratio of the preferred conductance magnitude to the null magnitude (P/N ratio) in each conductance set (Fig. 5 d). The P/N ratios for excitation were significantly different from 1 in all 17 conductance sets (Student's t test, p < 0.05), indicating that the presynaptic excitatory cells were at least partially directional. Because the preferred excitatory conductance was larger than the null in all 17 sets, the excitatory magnitude asymmetry contributed to PSP directionality in every set. In contrast, 12 of 17 conductance sets had P/N ratios for inhibition that were either not different from 1, favoring neither direction (n = 9), or significantly more than 1, favoring the null direction rather than the preferred (n = 3). In only five sets were the inhibitory P/N ratios significantly less than 1, favoring the preferred direction over the null. To summarize, every cell had at least some inputs that were already directional, suggesting that directionality was not created de novo in any of the cells in our population. However, although the magnitude asymmetries of excitation consistently strengthened PSP directionalities, the role of inhibition was unclear; to contribute to PSP directionality, the preferred FM should evoke less inhibitory conductance than the null, yet in most of our conductance sets the preferred FM evoked either equal or more inhibitory conductance than the null. We return to this point below.
Timing asymmetries were also evoked by upward and downward FM sweeps
We also observed two types of temporal asymmetries in the conductance sets. One type of asymmetry was a latency difference between excitation and inhibition, whereas the second type was an asymmetry in the shapes of the conductance waveforms. In some cases, the asymmetries were consistent with the temporal asymmetries proposed to underlie directionality, and in some cases they were not. We show four examples in Figure 6 a–d to illustrate the diversity of the latency relationships between excitation and inhibition. For the cell in Figure 6 a, the preferred FM evoked excitation that preceded inhibition, and the null FM evoked simultaneous excitation and inhibition. This temporal asymmetry would favor the preferred PSP over the null PSP and is consistent with the hypothesis that differences in the timing of excitation and inhibition generates FM directional selectivity. For the cell in Figure 6 b, the preferred FM evoked essentially simultaneous excitation and inhibition, whereas the null FM evoked inhibition that preceded the excitation. This temporal asymmetry would also favor the preferred PSP over the null PSP. In the cell in Figure 6 c (same cell shown in Fig. 4), there was essentially no temporal asymmetry between excitation and inhibition for either the preferred or null FMs. In the final example (Fig. 6 d), excitation preceded inhibition in response to both the preferred and null FMs. What is noteworthy is that in response to the null FM, excitation preceded inhibition by a greater degree than it did in response to the preferred FM. If this temporal asymmetry were the only factor affecting directionality, it would favor the null FM rather than the preferred FM. In short, we sometimes observed temporal asymmetries between excitation and inhibition that favored the preferred direction, and sometimes we did not. The point is that latency differences between excitation and inhibition cannot by themselves account for directionality in the PSPs.
Figure 6.

Temporal asymmetries in the preferred and null conductances. a–d, Four cells that illustrate the variety of temporal relationships between excitation (g e, red) and inhibition (g i, blue) evoked by preferred and null FMs. Timescale for a–d shown in b. Conductances are normalized to peak values. a, Preferred excitation leads inhibition, favoring the preferred sweep direction. b, Null inhibition leads excitation, favoring the preferred sweep. c, No latency asymmetry between excitation and inhibition. Same cell as Figure 4. d, Both preferred and null excitation lead inhibition, but the null latency difference is greater. This temporal asymmetry favors the null sweep. e, f, 2 cells showing different temporal asymmetries in the conductance shapes. Conductances are normalized and aligned at the rise. e, There is no asymmetry in the shape of excitation, but the preferred-evoked inhibition is narrower that the null-evoked inhibition, favoring the null sweep. f, Both the null evoked inhibition and excitation are broader than the preferred. The temporal asymmetry in excitation favors the preferred sweep, but the inhibitory asymmetry favors the null sweep.
As with latency asymmetries, we also observed a variety of asymmetries in the shapes of the conductances (Fig. 6 e,f). In the cell in Figure 6 e (same cell shown in Fig. 4), there was no asymmetry in the shape of the excitatory conductances, but the null inhibitory conductance was broader than the preferred, suggesting that the arrival of the individual synaptic inputs that comprised the total null inhibitory conductance was less coincident than the arrival of those that comprised the preferred inhibition. All other things being equal, less coincident arrival would tend to make a weaker input. This particular temporal asymmetry would make the null inhibition weaker than the preferred inhibition, exactly the opposite of the expected result if the timing of inhibition contributed to PSP directionality. In the cell in Figure 6 f, the null FM evoked broader excitatory and inhibitory conductances than did the preferred FM. A broader null excitation suggests less coincident excitatory inputs than the preferred and would favor the preferred FM. However, like the cell in Fig. 5 e, broader null inhibition would be less effective than the narrower preferred inhibition and is thus inconsistent with the hypothesis that the timing of inhibition contributed to directionality. In summary, we found cases in which the temporal asymmetries of the conductance shapes favored the preferred FM and cases in which they did not, and thus conductance shapes by themselves could not account for directionality.
Magnitude is more important than timing in determining directionality
Although we found both temporal asymmetries and magnitude asymmetries in all of the conductance sets, it was unclear which asymmetry contributed more to FM directionality. We therefore developed a model that allowed us to evaluate the relative contributions of the combined temporal asymmetries compared with the magnitude asymmetries in determining the PSP directionality of each FM set.
To evaluate the relative contributions for directionality of timing and magnitude asymmetries, we preserved the conductance temporal envelopes (latency and shape) but scaled the magnitudes (Fig. 7 a). Each preferred conductance magnitude (area under the curve) was scaled to be equal to the null conductance. This “swapped” conductance had the preferred temporal envelope but the null magnitude. Similarly, we scaled the null conductance to create a swapped conductance with null timing and the preferred magnitude. These swaps were performed on both excitatory and inhibitory conductances. We then compared directionality in the PSPs evoked by the control conductances with those evoked by the swapped conductances (Fig. 7 b,c). Specifically, we asked whether the swapped conductances with the preferred timing and null magnitudes evoked a larger depolarization than the swapped conductances with the null timing and preferred magnitudes. In other words, did directionality stay with the preferred timing or follow the preferred magnitude? In the example cell (Fig. 7 c; same as Fig. 4), the conductances with the null timing and preferred magnitude evoked a larger depolarization than the pair with the preferred timing and the null magnitude. Directionality followed the magnitude, indicating that magnitude asymmetries played a greater role in determining the directional preference than temporal asymmetries.
Figure 7.
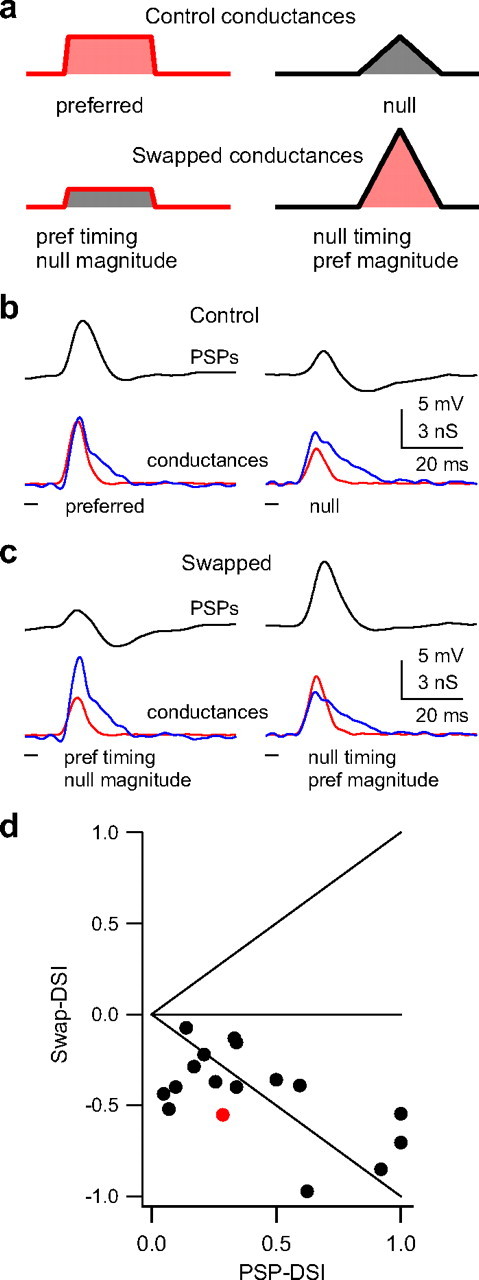
Magnitude is more important than timing for generating PSP directionality. To determine the relative contribution of magnitude asymmetries compared with temporal asymmetries in generating directional selectivity in the PSPs, we manipulated the conductance waveforms and tested them in model cells. a, A schematic depicting how the magnitudes of the original conductance waveforms (top) were swapped (bottom). One swapped conductance had the preferred timing (latency and shape) and the null magnitude (area under the curve; bottom left). The other had the null timing and the preferred magnitude (bottom right). b, c, We swapped magnitudes of both inhibitory and excitatory conductances, and the resulting swapped conductances were injected into the same model cell as the control conductances. The swapped conductances with the preferred magnitudes (c, right) evoked a larger PSP compared with those with the null magnitudes, showing that magnitude asymmetries were more important than timing in generating PSP directionality. PSPs in black, excitation in red, and inhibition in blue. d, We compared directionality in swap-DSIs with the directionality in PSP-DSIs. Swap-DSI > 0 indicates that timing was more important than magnitude; swap-DSI < 0 indicates that magnitude was more important than timing; swap-DSI = 0 indicates equal importance of both timing and magnitude. Points on the unity lines would indicate that directionality was determined by only timing (top diagonal) or only magnitude (bottom diagonal). Example cell shown in red.
We compared the importance of timing versus magnitude in all 17 conductance sets by comparing the PSP directionality evoked by the control conductances with that evoked by the swapped conductances (Fig. 7 d). We quantified directionality in the swapped PSPs as a swap-DSI, where P was the response (peak depolarization) evoked by the swapped conductances with the preferred timing/null magnitudes, and N was the response evoked by the conductances with the null timing/preferred magnitudes. The swap-DSI could vary from −1 to +1: positive swap-DSIs indicate that timing was more important for generating directionality, negative values indicate that magnitudes were more important, and 0 indicates equal importance of both. The swap-DSIs < 0 in all 17 conductance sets and thus the magnitude asymmetries were more important than timing asymmetries for generating PSP directionality.
That directionality depends more on the input magnitude asymmetry than the temporal asymmetry is consistent with the input resistances and membrane time constants of these cells. We compared the input resistances and membrane time constants in the cells in which we measured directional selectivity with those in which we also derived the synaptic conductances (Fig. 8). In this analysis, we excluded recordings with high access resistance and the three conductance cells that were recorded with voltage-gated channel blockers. Consistent with our previous report (Xie et al., 2008), the input resistances in the overall population ranged from 40 to 340 MΩ. However, all the cells in which we were able to derive conductances had relatively high input resistance. The lowest measured input resistance was 168 MΩ (open circles; mean of 226 ± 29 MΩ). The range of time constants in the overall population was from 2.1 to 16.2 ms, whereas all seven conductance cells had time constants ≥10 ms (mean of 12.5 ± 1.0 ms). Thus, the neurons from which we derived conductances were relatively slow, having properties consistent with the temporal integration of inputs. Such slow membrane properties would not be effective in differentiating the subtle differences in input timing observed in our conductance estimates. Our results showing that magnitude asymmetries have a greater influence on PSP directional selectivity than temporal asymmetries are consistent with the slow membrane properties of the seven cells in which we evaluated the relative contribution of magnitude compared with temporal asymmetries.
Inhibition scales with excitation
Our data indicate that the dominant factors underlying FM directional selectivity were a magnitude asymmetry in the excitatory inputs and spike threshold, although the role of inhibition was unclear. To clarify the role that inhibition played in shaping FM directionality, we compared the magnitudes of the excitatory and inhibitory conductances evoked by each FM set (Fig. 9). We show three examples of an excitatory conductance overlaid with an inhibitory conductance evoked by the same FM sweep (Fig. 9 a). These examples illustrate how the magnitude ratio between excitation and inhibition is reasonably constant regardless of the absolute magnitudes of the conductance pairs. Indeed, we found a strong positive correlation between excitation and inhibition, such that FMs that evoked relatively large excitatory conductances tended to evoke large inhibitory conductances as well (Fig. 9 b) (n = 34; R 2 = 0.81; p < 0.01; regression not shown). This shows that inhibition scales with excitation. However, when we separated the conductance pairs into those evoked by preferred FMs from those evoked by null FMs, the slope of the preferred regression was significantly steeper than the slope of the null regression (Fig. 9 b) (n = 17; p = 0.034, ANCOVA), showing that, for any given magnitude of excitatory conductance, the inhibitory conductance was smaller in the preferred direction than in the null direction. These data suggest that inhibition functions as a gain control to balance excitation, but the balance is skewed such that ratio of excitation to inhibition is slightly larger in the preferred direction, favoring the preferred sweep.
Figure 9.

Inhibition scales with excitation. a, Three example conductance pairs evoked by the preferred FMs illustrating that excitation and inhibition scale together independent of their absolute magnitudes. Excitation (g e) in red, inhibition (g i) in blue. Conductance pairs correspond to the large filled circles in b. b, The magnitude of inhibition evoked by each FM correlated positively with the magnitude of excitation evoked by the same FM, consistent with inhibition acting as a gain control (n = 34; R 2 = 0.81; p < 0.01; regression not shown). However, the ratio of conductance magnitudes (excitation/inhibition) is greater for the preferred FMs (filled circles, solid line) than for the null FMs (open circles, dashed line), indicating that the magnitudes of inhibition were skewed to suppress the null responses (n = 17; p = 0.034, ANCOVA).
Blocking inhibition reduces spike directionality
To determine whether our results were consistent with the finding that blocking inhibition reduces directional selectivity, we modeled blocking inhibition (Fig. 10). In eight FM sets, spikes were evoked either by both FMs, in which the preferred evoked more spikes than the null (three sets), or only by the preferred and not by the null FM (five sets). For each set, we injected the model cells with only the excitatory conductance, as if inhibition were blocked, and then compared the resulting PSPs with spike threshold, measured from FM-evoked spikes. We excluded the nine FM sets that did not evoke spikes because we could not compare those PSPs with spike threshold.
Figure 10.
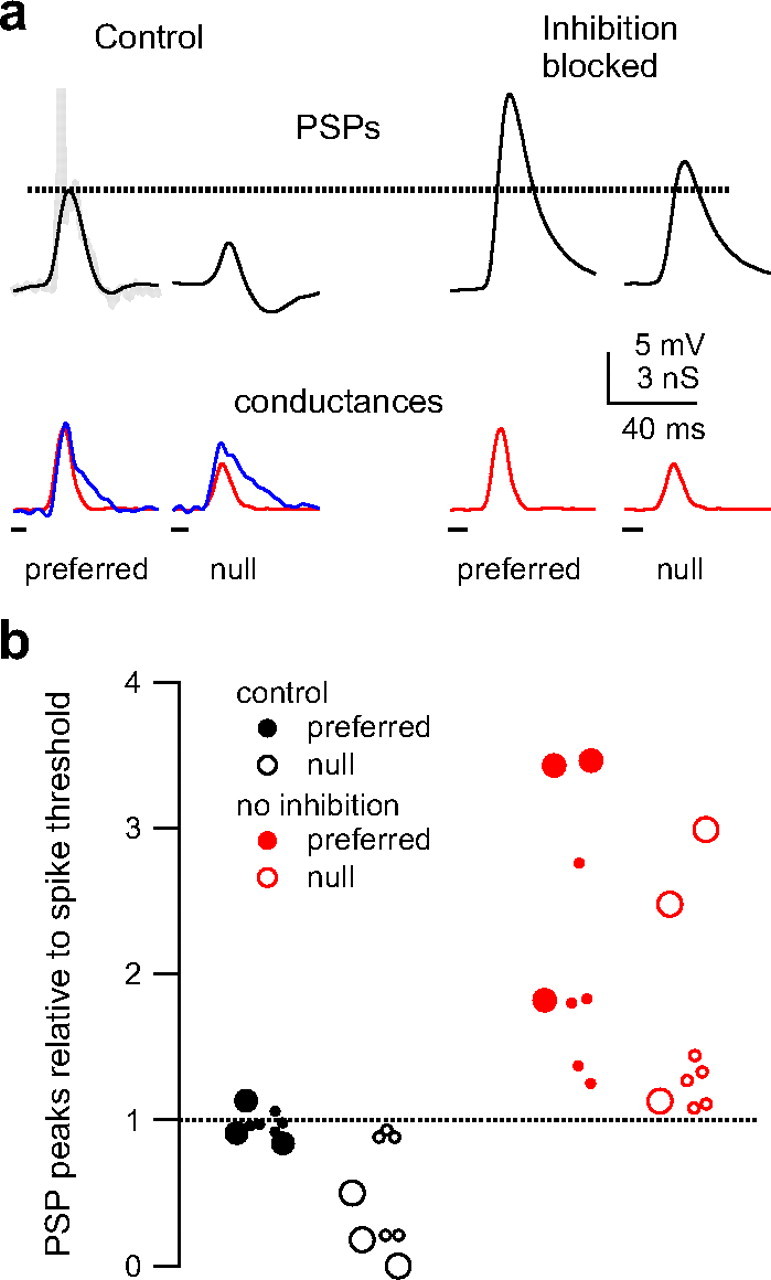
Blocking inhibition can reduce spike directionality. a, Predicted membrane responses to control injection (excitation and inhibition) and with inhibition blocked (excitation only). With inhibition blocked, both the null and preferred PSPs exceed spike threshold (dashed line). Predicted PSPs in black, excitatory conductance in red, and inhibitory conductance in blue. Truncated spike shown in gray (top left). b, The model PSP peak amplitudes (peak − rest) normalized to spike threshold (dashed line). The control preferred PSPs (black filled) were very close to spike threshold, whereas the control null PSPs (black, open) were less than or equal to spike threshold. With inhibition blocked (red), both the preferred (filled) and null (open) PSPs exceeded spike threshold. In three sets, there was no asymmetry in the inhibitory magnitudes (large circles).
The cell shown in Figure 10 a illustrates the effects of blocking inhibition (same as Fig. 4). When we computed the EPSPs using only the excitatory conductances, both the preferred and the null EPSPs approximately doubled in size compared with the control PSPs calculated with both inhibition and excitation. More importantly, both the preferred and null PSPs calculated with no inhibition exceeded spike threshold. This suggests that, had inhibition been blocked in this cell, the null FM would have evoked spikes, whereas under control conditions, the null FM evoked no spikes (Fig. 4 a).
When we injected the model cells with both excitation and inhibition, the preferred control PSPs peaked very close to spike threshold (Fig. 10 b) (mean compared with spike threshold, 0.97 ± 0.03; n = 8). The null control PSPs, however, had peaks that were on average approximately half the amplitude of spike threshold (0.47 ± 0.14). When PSPs were computed with excitation alone, both the preferred and null PSPs exceeded spike threshold. The PSPs calculated with no inhibition were more depolarized than spike threshold by factors of 2.2 ± 0.33 and 1.6 ± 0.27 for preferred and null, respectively.
We point out two implications from these results. First, all the FM sets evoked sufficient inhibition to substantially reduce the depolarization that would have been evoked by excitation alone. The inhibition not only reduced the peak amplitudes of the PSPs but also shortened their durations (data not shown). This was also true in the nine FM sets that did not evoke spikes, in which the average calculated peak depolarization to excitation alone was nearly twice (1.8 ± 0.19) the depolarization to both excitation and inhibition (data not shown).
Second, all the PSPs calculated from the null excitation alone (no inhibition) exceeded the control preferred PSPs calculated from both excitation and inhibition (data not shown). This suggests that, had inhibition been blocked, the null FMs would have evoked at least as many spikes as the preferred FMs under control conditions. However, the caveat in these evaluations is that we cannot evaluate how much spike counts would change by blocking inhibition because the model cells do not include voltage-gated channels and therefore do not fire spikes. In short, we do not know the degree to which blocking inhibition would increase the spike counts evoked by the preferred compared with the increase in spike counts evoked by the null FM and thus how spike directionality would change.
In five of the above FM sets, however, the preferred FM evoked spikes and the null evoked no spikes (spike-DSI of 1.0). These conditions provide a more definitive evaluation of whether blocking inhibition could reduce spike directionality. If blocking inhibition resulted in the null FM evoking just one spike, then directional selectivity would have been reduced. When we injected the model cell in Figure 10 a with the null excitation alone, the predicted PSP exceeded spike threshold, as described above. This strongly suggests that the null FM would have evoked spikes had inhibition been blocked, and thus directionality would have been reduced. We found the same results in all five conductance sets in which the preferred FM evoked spikes and null FM evoked no spikes. These results are consistent with the findings from extracellular studies that blocking inhibition reduces, or even eliminates, spike directional selectivity.
Inhibition can shape directionality through gain control
To evaluate the role of inhibition in greater detail, we next consider three of the five conductance sets in which the preferred FM evoked spikes but the null evoked no spikes. In these three conductance sets, there were no magnitude asymmetries in the inhibitory conductances (P/N ratio of ∼1) (Fig. 10 b, large circles). As described in Figure 7 above, the temporal asymmetries were not large enough to have a strong influence on FM directionality. Instead, PSP directionalities were generated by the magnitude asymmetries of excitation. When the excitatory conductance alone was injected into the model cells, the predicted PSPs for both the preferred and null FMs exceeded spike threshold. When the equally strong inhibitory conductances were injected with excitation, the inhibition acted to reduce both the preferred and null excitatory PSPs, so that with inhibition the preferred PSPs were just above threshold and the null PSPs were below threshold. The small directional differences in the PSP amplitudes in each FM set were subsequently amplified by spike threshold into maximum spike directionalities. In these cells, it appears that inhibition does not create PSP directionality but rather inhibition acts to suppress suprathreshold PSPs of the preferred and null FMs by the same degree, essentially functioning as a gain control. These data illustrate how blocking inhibition can reduce or even eliminate spike directionality in cells whose directional properties result not from differences in the timing of excitation and inhibition but rather from the magnitude asymmetries of their excitatory inputs.
Discussion
There are four major features that we showed in this study. The first is that upward and downward FM sweeps evoke conductances of different magnitudes, indicating that the presynaptic cells themselves were at least partially directionally selective. The second is that the asymmetries in input magnitudes make the major contribution to directional selectivity of the PSPs, and temporal asymmetries are less important. Third, spike threshold can strongly amplify a relatively small selectivity in the PSPs to generate a large spike selectivity, a feature also seen in other sensory modalities (Carandini and Ferster, 2000; Priebe et al., 2004; Wilent and Contreras, 2005). Finally, our data suggest that inhibition plays multiple roles in tuning directionality. Inhibitory conductance magnitudes are roughly balanced with excitation, but the balance is skewed so that the ratio of excitation/inhibition is greater in the preferred direction than in the null. In the sections below, we first compare our findings with previous extracellular studies of FM directionality in the IC. We then discuss the implications of our findings for information processing in the IC.
Comparisons with previous studies
Our results are partially in agreement with previous studies of FM directionality in the IC. The points of agreement are that many IC cells are directionally selective for FM, that in the IC of bats there is a predominance of neurons that prefer downward FM sweeps, the FM direction of their echolocation, and components of many communicational calls, and that blocking inhibition should reduce or even eliminate directional preferences (Suga, 1968; Fuzessery and Hall, 1996; Koch and Grothe, 1998; Fuzessery et al., 2006; Andoni et al., 2007; Voytenko and Galazyuk, 2007).
Our data, however, suggest that the mechanisms underlying FM directionality in many cells differ from those advanced in previous extracellular studies. Almost all previous extracellular studies implicitly assume that the inputs to the IC are nondirectional, and thus the preferred and null FMs evoke equally strong excitation and also evoke equally strong inhibition (Suga, 1968; Poon et al., 1991; Fuzessery and Hall, 1996; Fuzessery et al., 2006; Andoni et al., 2007). Moreover, they posit that directional preferences are formed de novo in the IC by input temporal asymmetries, i.e., differences in the arrival time of inputs evoked by the preferred FM compared with the arrival of null-evoked inputs. We found in every case tested that the preferred and null FMs evoked excitatory conductances of different magnitudes, and in approximately half of the cases they also evoked inhibitory conductances of different magnitudes. These results imply that directional selectivity is not formed de novo, but instead that at least some of the presynaptic inputs were directionally selective. Even more surprisingly, modeling suggests that all of the cells were far more sensitive to magnitude asymmetries than to timing differences. The dominant role of magnitude asymmetries and the more minor role of timing are also supported by the high input resistances and relatively slow membrane time constants of the cells from which we derived conductances.
Directional information is carried by a rate code
That magnitude asymmetries are more important than temporal asymmetries in generating directional preferences in the PSPs implies that the inputs to these IC cells carry directional information primarily by a rate code rather than a time code. This view is different from the view posited in previous extracellular studies in which the formation of directional selectivity in the IC depends critically on the precise timing of the inputs (Poon et al., 1991; Casseday et al., 1997; Fuzessery et al., 2006; Andoni et al., 2007). In contrast, input magnitudes trumped timing in every cell we evaluated. Although our sample size is small and limited to cells with high input resistances, this mechanism may be reasonably common because over half the IC population has high input resistances comparable with the cells reported here (Xie et al., 2008). However, we note that, in this study and in previous reports (Xie et al., 2007, 2008), we found highly directionally selective cells that have relatively fast membrane time constants and low input resistances, characteristics that are well suited for detecting small temporal differences. It seems probable, therefore, that timing asymmetries may be more important for FM directionality in those cells than in the cells in this study. If so, the formation of FM directionality predominately by magnitude asymmetries in some cells and temporal asymmetries in others would be yet another illustration of the diversity of intrinsic properties (Sivaramakrishnan and Oliver, 2001; Tan et al., 2007; Xie et al., 2008), response properties (Casseday et al., 2002; Klug et al., 2002; Pollak et al., 2002; Xie et al., 2005), and patterns of inputs (Pollak and Casseday, 1986; Ross and Pollak, 1989; Oliver and Huerta, 1992) that are prominent among the neuronal population of the IC.
Inhibition can shape directionality through gain control
We suggest that excitatory magnitude asymmetries could underlie PSP directionality even in cells in which blocking inhibition results in complete elimination of spike directionality. This could occur if blocking inhibition resulted in EPSPs that were so large that the firing rate approached or reached saturation. In other words, increasing the EPSP size would only increase firing rate up to some maximum value, after which firing rate would no longer increase. If blocking inhibition caused the preferred and null EPSPs to increase by the same degree and the preferred EPSP evoked firing saturation, then the firing rate to the null would increase more than the firing rate to the preferred FM. This would reduce directional selectivity in the spikes. If both the preferred and the null EPSPs reached spike saturation, then spike directionality would be eliminated. In either situation, small differences in EPSPs would be masked by spike threshold rather than accentuated. Consistent with this idea, our results indicate that both the preferred and null FMs evoke suprathreshold excitatory inputs. Whether spike saturation occurred in previous extracellular studies in which inhibition was blocked is unclear because it was not evaluated. However, blocking inhibition often results in large increases (200–400%) in sound-evoked spike counts, which is also consistent with this hypothesis (Pollak and Park, 1993).
Sources of directional inputs to the IC
One of the central features that shaped directionality in the IC cells in this study is the stronger excitation evoked by the preferred than the null FM, which requires that the excitatory inputs themselves were partially directional. Differences in the strengths of the inhibitory inputs evoked by the two FM directions were also seen in many, although not all, cells. That inputs to the IC are directionally selective is seemingly inconsistent with most studies of lower nuclei that report little or no directional preferences for FM (Suga, 1968; Vater, 1982; Huffman et al., 1998a; Bauer et al., 2002; Xie et al., 2005). However, some directionally selective cells have been found in the cochlear nucleus (Erulkar et al., 1968; Britt and Starr, 1976; Zhao and Liang, 1996) and in the columnar division of the ventral nucleus of the lateral lemniscus (VNLLc) (Huffman et al., 1998a). Most of the cochlear nucleus cells that expressed directionality were weakly directional, but a few were strongly directional. The cells in the VNLLc are strongly directional and provide glycinergic inputs to the IC (Winer et al., 1995; Vater et al., 1997; Riquelme et al., 2001). In short, there is evidence that at least some excitatory and inhibitory inputs to the IC are directional.
Summary and implications for information processing in the IC
We showed that inputs to some IC neurons are directional, which suggests that the construction of FM directionality in some IC cells is accomplished through a two-stage process that requires integrating input magnitudes rather than de novo construction through the precise timing of excitation and inhibition. In the first stage, some degree of directionality is established in one or a few lower nuclei. The lower cells do not have to be strongly directional but only weakly directional, features consistent with most of the directionally selective cells described in the cochlear nucleus. The summation of firing rates from multiple excitatory projections, some of which may be nondirectional and others weakly directional, provides the slight directionality of the excitatory innervation. The inhibitory innervation may also derive from directional and nondirectional lower nuclei or it may be entirely nondirectional, as shown in Figure 4 b. The excitatory and inhibitory innervation then sums over time, in which small differences in arrival times of excitation and inhibition are relatively unimportant. The excitatory inputs are relatively large, so that unchecked by inhibition, even the null FMs would always evoke suprathreshold EPSPs. In the presence of inhibition, however, the EPSPs evoked by the preferred FM are scaled down such that they peak close to spike threshold, whereas the EPSPs evoked by the null are suppressed to levels that are just above threshold and often to subthreshold levels. Spike threshold then acts as a nonlinear amplifier that transforms relatively small differences in PSP magnitudes into large directional preferences in the discharges.
The formation of selective response properties through multiple stages coupled with the finely tuned interactions between excitation, inhibition, and spike threshold may apply to auditory signals other than FM sweeps. The small differences in the preferred and null PSPs coupled with the powerful amplification of spike threshold suggests that highly selective discharge properties can be created by only minor adjustments in either biophysical properties, such as resting potential, or in the synaptic strengths evoked by different signals.
Footnotes
This work was supported by National Institutes of Health Grants DC007856 and 1F 32DC009741. We thank Sari Andoni, Nace Golding, Yong Lu, and Nicholas Priebe for helpful comments and discussions. We also thank Carl Resler for technical support.
References
- Andoni S, Li N, Pollak GD. Spectrotemporal receptive fields in the inferior colliculus revealing selectivity for spectral motion in conspecific vocalizations. J Neurosci. 2007;27:4882–4893. doi: 10.1523/JNEUROSCI.4342-06.2007. [DOI] [PMC free article] [PubMed] [Google Scholar]
- Bauer EE, Klug A, Pollak GD. Features of contralaterally evoked inhibition in the inferior colliculus. Hear Res. 2000;141:80–96. doi: 10.1016/s0378-5955(99)00206-3. [DOI] [PubMed] [Google Scholar]
- Bauer EE, Klug A, Pollak GD. Spectral determination of responses to species-specific calls in the dorsal nucleus of the lateral lemniscus. J Neurophysiol. 2002;88:1955–1967. doi: 10.1152/jn.2002.88.4.1955. [DOI] [PubMed] [Google Scholar]
- Bohn KM, Schmidt-French B, Ma ST, Pollak GD. Syllable acoustics, temporal patterns, and call composition vary with behavioral context in Mexican free-tailed bats. J Acoust Soc Am. 2008;124:1838–1848. doi: 10.1121/1.2953314. [DOI] [PMC free article] [PubMed] [Google Scholar]
- Bregman AS. Auditory scene analysis: the perceptual organization of sound. Ed 1. Cambridge, MA: MIT; 1990. [Google Scholar]
- Britt R, Starr A. Synaptic events and discharge patterns of cochlear nucleus cells. II. Frequency-modulated tones. J Neurophysiol. 1976;39:179–194. doi: 10.1152/jn.1976.39.1.179. [DOI] [PubMed] [Google Scholar]
- Carandini M, Ferster D. Membrane potential and firing rate in cat primary visual cortex. J Neurosci. 2000;20:470–484. doi: 10.1523/JNEUROSCI.20-01-00470.2000. [DOI] [PMC free article] [PubMed] [Google Scholar]
- Casseday JH, Covey E, Grothe B. Neural selectivity and tuning for sinusoidal frequency modulations in the inferior colliculus of the big brown bat, Eptesicus fuscus . J Neurophysiol. 1997;77:1595–1605. doi: 10.1152/jn.1997.77.3.1595. [DOI] [PubMed] [Google Scholar]
- Casseday JH, Fremouw T, Covey E. The inferior colliculus: a hub for the central auditory system. In: Oertel D, Popper AN, Fay RR, editors. Integrative functions in the mammalian auditory pathway. New York: Springer; 2002. pp. 238–318. [Google Scholar]
- Doupe AJ, Kuhl PK. Birdsong and human speech: common themes and mechanisms. Annu Rev Neurosci. 1999;22:567–631. doi: 10.1146/annurev.neuro.22.1.567. [DOI] [PubMed] [Google Scholar]
- Erulkar SD, Butler RA, Gerstein GL. Excitation and inhibition in cochlear nucleus. II. Frequency-modulated tones. J Neurophysiol. 1968;31:537–548. doi: 10.1152/jn.1968.31.4.537. [DOI] [PubMed] [Google Scholar]
- Fuzessery ZM. Response selectivity for multiple dimensions of frequency sweeps in the pallid bat inferior colliculus. J Neurophysiol. 1994;72:1061–1079. doi: 10.1152/jn.1994.72.3.1061. [DOI] [PubMed] [Google Scholar]
- Fuzessery ZM, Hall JC. Role of GABA in shaping frequency tuning and creating FM sweep selectivity in the inferior colliculus. J Neurophysiol. 1996;76:1059–1073. doi: 10.1152/jn.1996.76.2.1059. [DOI] [PubMed] [Google Scholar]
- Fuzessery ZM, Richardson MD, Coburn MS. Neural mechanisms underlying selectivity for the rate and direction of frequency-modulated sweeps in the inferior colliculus of the pallid bat. J Neurophysiol. 2006;96:1320–1336. doi: 10.1152/jn.00021.2006. [DOI] [PubMed] [Google Scholar]
- Huffman RF, Argeles PC, Covey E. Processing of sinusoidally frequency modulated signals in the nuclei of the lateral lemniscus of the big brown bat, Eptesicus fuscus . Hear Res. 1998a;126:161–180. doi: 10.1016/s0378-5955(98)00165-8. [DOI] [PubMed] [Google Scholar]
- Huffman RF, Argeles PC, Covey E. Processing of sinusoidally amplitude modulated signals in the nuclei of the lateral lemniscus of the big brown bat, Eptesicus fuscus . Hear Res. 1998b;126:181–200. doi: 10.1016/s0378-5955(98)00166-x. [DOI] [PubMed] [Google Scholar]
- Klug A, Bauer EE, Pollak GD. Multiple components of ipsilaterally evoked inhibition in the inferior colliculus. J Neurophysiol. 1999;82:593–610. doi: 10.1152/jn.1999.82.2.593. [DOI] [PubMed] [Google Scholar]
- Klug A, Bauer EE, Hanson JT, Hurley L, Meitzen J, Pollak GD. Response selectivity for species-specific calls in the inferior colliculus of Mexican free-tailed bats is generated by inhibition. J Neurophysiol. 2002;88:1941–1954. doi: 10.1152/jn.2002.88.4.1941. [DOI] [PubMed] [Google Scholar]
- Koch U, Grothe B. GABAergic and glycinergic inhibition sharpens tuning for frequency modulations in the inferior colliculus of the big brown bat. J Neurophysiol. 1998;80:71–82. doi: 10.1152/jn.1998.80.1.71. [DOI] [PubMed] [Google Scholar]
- Nelken I, Versnel H. Responses to linear and logarithmic frequency-modulated sweeps in ferret primary auditory cortex. Eur J Neurosci. 2000;12:549–562. doi: 10.1046/j.1460-9568.2000.00935.x. [DOI] [PubMed] [Google Scholar]
- Oliver DL, Huerta MF. Inferior and superior colliculi. In: Webster DB, Popper AN, Fay RR, editors. The mammalian auditory system: neuroanatomy. New York: Springer; 1992. pp. 168–221. [Google Scholar]
- Oliver DL, Morest DK. The central nucleus of the inferior colliculus in the cat. J Comp Neurol. 1984;222:237–264. doi: 10.1002/cne.902220207. [DOI] [PubMed] [Google Scholar]
- Peña JL, Konishi M. Cellular mechanisms for resolving phase ambiguity in the owl's inferior colliculus. Proc Natl Acad Sci U S A. 2000;97:11787–11792. doi: 10.1073/pnas.97.22.11787. [DOI] [PMC free article] [PubMed] [Google Scholar]
- Pena JL, Konishi M. From postsynaptic potentials to spikes in the genesis of auditory spatial receptive fields. J Neurosci. 2002;22:5652–5658. doi: 10.1523/JNEUROSCI.22-13-05652.2002. [DOI] [PMC free article] [PubMed] [Google Scholar]
- Pollak GD, Casseday JH. The neural basis of echolocation in bats. New York: Springer; 1986. [Google Scholar]
- Pollak GD, Park TJ. The effects of GABAergic inhibition on monaural response properties of neurons in the mustache bat's inferior colliculus. Hear Res. 1993;65:99–117. doi: 10.1016/0378-5955(93)90205-f. [DOI] [PubMed] [Google Scholar]
- Pollak GD, Burger RM, Park TJ, Klug A, Bauer EE. Roles of inhibition for transforming binaural properties in the brainstem auditory system. Hear Res. 2002;168:60–78. doi: 10.1016/s0378-5955(02)00362-3. [DOI] [PubMed] [Google Scholar]
- Poon PW, Chen X, Hwang JC. Basic determinants for FM responses in the inferior colliculus of rats. Exp Brain Res. 1991;83:598–606. doi: 10.1007/BF00229838. [DOI] [PubMed] [Google Scholar]
- Poon PW, Chen X, Cheung YM. Differences in FM response correlate with morphology of neurons in the rat inferior colliculus. Exp Brain Res. 1992;91:94–104. doi: 10.1007/BF00230017. [DOI] [PubMed] [Google Scholar]
- Priebe NJ. The relationship between subthreshold and suprathreshold ocular dominance in cat primary visual cortex. J Neurosci. 2008;28:8553–8559. doi: 10.1523/JNEUROSCI.2182-08.2008. [DOI] [PMC free article] [PubMed] [Google Scholar]
- Priebe NJ, Ferster D. Direction selectivity of excitation and inhibition in simple cells of the cat primary visual cortex. Neuron. 2005;45:133–145. doi: 10.1016/j.neuron.2004.12.024. [DOI] [PubMed] [Google Scholar]
- Priebe NJ, Ferster D. Inhibition, spike threshold, and stimulus selectivity in primary visual cortex. Neuron. 2008;57:482–497. doi: 10.1016/j.neuron.2008.02.005. [DOI] [PubMed] [Google Scholar]
- Priebe NJ, Mechler F, Carandini M, Ferster D. The contribution of spike threshold to the dichotomy of cortical simple and complex cells. Nat Neurosci. 2004;7:1113–1122. doi: 10.1038/nn1310. [DOI] [PMC free article] [PubMed] [Google Scholar]
- Razak KA, Fuzessery ZM. Neural mechanisms underlying selectivity for the rate and direction of frequency-modulated sweeps in the auditory cortex of the pallid bat. J Neurophysiol. 2006;96:1303–1319. doi: 10.1152/jn.00020.2006. [DOI] [PubMed] [Google Scholar]
- Riquelme R, Saldaña E, Osen KK, Ottersen OP, Merchán MA. Colocalization of GABA and glycine in the ventral nucleus of the lateral lemniscus in rat: an in situ hybridization and semiquantitative immunocytochemical study. J Comp Neurol. 2001;432:409–424. doi: 10.1002/cne.1111. [DOI] [PubMed] [Google Scholar]
- Rosen MJ, Mooney R. Inhibitory and excitatory mechanisms underlying auditory responses to learned vocalizations in the songbird nucleus HVC. Neuron. 2003;39:177–194. doi: 10.1016/s0896-6273(03)00357-x. [DOI] [PubMed] [Google Scholar]
- Ross LS, Pollak GD. Differential ascending projections to aural regions in the 60 kHz contour of the mustache bat's inferior colliculus. J Neurosci. 1989;9:2819–2834. doi: 10.1523/JNEUROSCI.09-08-02819.1989. [DOI] [PMC free article] [PubMed] [Google Scholar]
- Ryan MJ. Frequency modulated calls and species recognition in a neotropical frog. J Comp Physiol. 1983;150:217–221. [Google Scholar]
- Sinex DG, Geisler CD. Auditory-nerve fiber responses to frequency-modulated tones. Hear Res. 1981;4:127–148. doi: 10.1016/0378-5955(81)90001-0. [DOI] [PubMed] [Google Scholar]
- Sivaramakrishnan S, Oliver DL. Distinct K currents result in physiologically distinct cell types in the inferior colliculus of the rat. J Neurosci. 2001;21:2861–2877. doi: 10.1523/JNEUROSCI.21-08-02861.2001. [DOI] [PMC free article] [PubMed] [Google Scholar]
- Suga N. Analysis of frequency-modulated and complex sounds by single auditory neurons of bats. J Physiol. 1968;198:51–80. doi: 10.1113/jphysiol.1968.sp008593. [DOI] [PMC free article] [PubMed] [Google Scholar]
- Tan ML, Theeuwes HP, Feenstra L, Borst JG. Membrane properties and firing patterns of inferior colliculus neurons: an in vivo patch-clamp study in rodents. J Neurophysiol. 2007;98:443–453. doi: 10.1152/jn.01273.2006. [DOI] [PubMed] [Google Scholar]
- Vater M. Single unit responses in cochlear nucleus of horseshoe bats to sinusoidal frequency and amplitude modulation signals. J Comp Physiol. 1982;149:369–388. [Google Scholar]
- Vater M, Schlegel P, Zoller H. Comparative auditory neurophysiology of the inferior colliculus of two Molossid bats, Molossus ater and Molossus molossus . J Comp Physiol. 1979;131:137–145. [Google Scholar]
- Vater M, Covey E, Casseday JH. The columnar region of the ventral nucleus of the lateral lemniscus in the big brown bat (Eptesicus fuscus): synaptic arrangements and structural correlates of feedforward inhibitory function. Cell Tissue Res. 1997;289:223–233. doi: 10.1007/s004410050869. [DOI] [PubMed] [Google Scholar]
- Voytenko SV, Galazyuk AV. Intracellular recording reveals temporal integration in inferior colliculus neurons of awake bats. J Neurophysiol. 2007;97:1368–1378. doi: 10.1152/jn.00976.2006. [DOI] [PubMed] [Google Scholar]
- Wang X, Merzenich MM, Beitel R, Schreiner CE. Representation of a species-specific vocalization in the primary auditory cortex of the common marmoset: temporal and spectral characteristics. J Neurophysiol. 1995;74:2685–2706. doi: 10.1152/jn.1995.74.6.2685. [DOI] [PubMed] [Google Scholar]
- Wilent WB, Contreras D. Stimulus-dependent changes in spike threshold enhance feature selectivity in rat barrel cortex neurons. J Neurosci. 2005;25:2983–2991. doi: 10.1523/JNEUROSCI.4906-04.2005. [DOI] [PMC free article] [PubMed] [Google Scholar]
- Winer JA, Larue DT, Pollak GD. GABA and glycine in the central auditory system of the mustache bat: structural substrates for inhibitory neuronal organization. J Comp Neurol. 1995;355:317–353. doi: 10.1002/cne.903550302. [DOI] [PubMed] [Google Scholar]
- Woolley SM, Casseday JH. Processing of modulated sounds in the zebra finch auditory midbrain: responses to noise, frequency sweeps, and sinusoidal amplitude modulations. J Neurophysiol. 2005;94:1143–1157. doi: 10.1152/jn.01064.2004. [DOI] [PubMed] [Google Scholar]
- Xie R, Meitzen J, Pollak GD. Differing roles of inhibition in hierarchical processing of species-specific calls in auditory brainstem nuclei. J Neurophysiol. 2005;94:4019–4037. doi: 10.1152/jn.00688.2005. [DOI] [PubMed] [Google Scholar]
- Xie R, Gittelman JX, Pollak GD. Rethinking tuning: in vivo whole-cell recordings of the inferior colliculus in awake bats. J Neurosci. 2007;27:9469–9481. doi: 10.1523/JNEUROSCI.2865-07.2007. [DOI] [PMC free article] [PubMed] [Google Scholar]
- Xie R, Gittelman JX, Li N, Pollak GD. Whole cell recordings of intrinsic properties and sound-evoked responses from the inferior colliculus. Neuroscience. 2008;154:245–256. doi: 10.1016/j.neuroscience.2008.02.039. [DOI] [PubMed] [Google Scholar]
- Zhang LI, Tan AY, Schreiner CE, Merzenich MM. Topography and synaptic shaping of direction selectivity in primary auditory cortex. Nature. 2003;424:201–205. doi: 10.1038/nature01796. [DOI] [PubMed] [Google Scholar]
- Zhao HB, Liang ZA. Processing of modulation frequency in the dorsal cochlear nucleus of the guinea pig: sinusoidal frequency-modulated tones. Hear Res. 1996;95:120–134. doi: 10.1016/0378-5955(96)00030-5. [DOI] [PubMed] [Google Scholar]