Abstract
Acetylcholinesterase (EC 3.1.1.7) and butyrylcholinesterase (EC 3.1.1.8) are enzymes that belong to the superfamily of α/β-hydrolase fold proteins. While they share many characteristics, they also possess many important differences. For example, whereas they have about 54% amino acid sequence identity, the active site gorge of acetylcholinesterase is considerably smaller than that of butyrylcholinesterase. Moreover, both have been shown to display simple and complex kinetic mechanisms, depending on the particular substrate examined, the substrate concentration, and incubation conditions. In the current study, incubation of butyrylthiocholine in a concentration range of 0.005 mM – 3.0 mM, with 317 pM human butyrylcholinesterase in vitro resulted in rates of production of thiocholine that were accurately described by simple Michaelis-Menten kinetics, with a Km of 0.10 mM. Similarly, the inhibition of butyrylcholinesterase in vitro by the organophosphate chlorpyrifos oxon was described by simple Michaelis-Menten kinetics, with a ki of 3,048 nM−1h−1, and a KD of 2.02 nM. In contrast to inhibition of butyrylcholinesterase, inhibition of human acetylcholinesterase by chlorpyrifos oxon in vitro followed concentration-dependent inhibition kinetics, with the ki increasing as the inhibitor concentration decreased. Chlorpyrifos oxon concentrations of 10 nM and 0.3 nM gave kis of 1.2 nM−1h−1 and 19.3 nM−1h−1, respectively. Although the mechanism of concentration-dependent inhibition kinetics is not known, the much smaller, more restrictive active site gorge of acetylcholinesterase almost certainly plays a role. Similarly, the much larger active site gorge of butyrylcholinesterase likely contributes to its much greater reactivity towards chlorpyrifos oxon, compared to acetylcholinesterase.
Keywords: Acetylcholinesterase, Butyrylcholinesterase, Chlorpyrifos oxon, Organophosphate Insecticides, Pesticides
Introduction
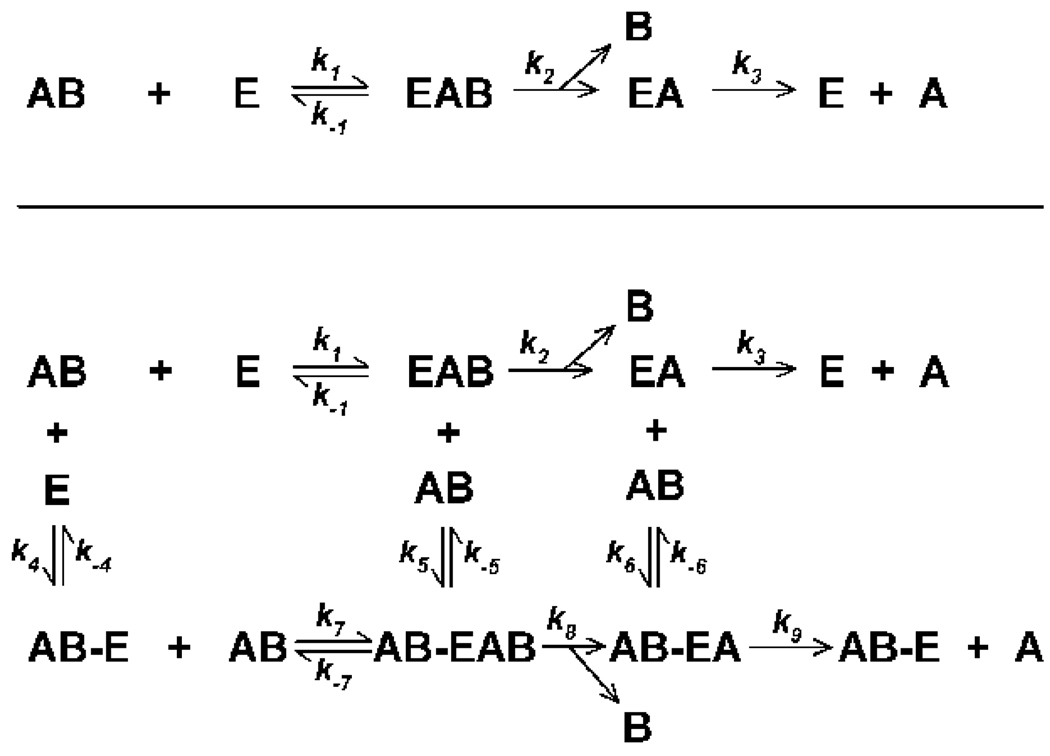
Acetylcholinesterase (EC 3.1.1.7) and butyrylcholinesterase (EC 3.1.1.8) are enzymes that belong to the superfamily of α/β-hydrolase fold proteins (Valle et al., 2008). These two enzymes share about 54% amino acid sequence identity (Lockridge et al., 1987), but differ in their specificity towards various substrates and inhibitors (Valle et al., 2008). Their crystal structures have revealed similar architecture, with one catalytic triad located at the bottom of a deep gorge (Nicolet et al., 2003; Masson et al., 2008). The hydrolysis of substrate by both enzymes proceeds through a transacylation step that involves nucleophilic and general acid-base elements (Quinn, 1987). However, the butyrylcholinesterase active site gorge is lined with 6 aromatic amino acid residues rather than the 14 found in acetylcholinesterase (Darvesh et al., 2003). Moreover, the phenylalanine residues of the acyl pocket in acetylcholinesterase (Phe-295 and Phe-297) are replaced with Lys-286 and Val-228 in butyrylcholinesterase, leading to a larger acyl pocket that can accommodate larger substrates (Vellom et al., 1993; Darvesh et al., 2003; Nicolet et al., 2003). The minimal reaction mechanism for both enzymes can be represented kinetically as shown in the upper panel of Figure 1.
Figure 1. Proposed kinetic schemes descriptive of the interactions of substrates or organophosphorus inhibitors with human acetylcholinesterase or butyrylcholinesterase.
The upper panel contains the minimal reaction scheme based on simple Michaelis-Menten kinetics where in the case of an organophosphorus inhibitor, ki = k2/KD (KD = [E]*[AB]/([E]-[AB]; and KD = k−1/k1)(developed by Main, 1964). E designates free enzyme; AB represents substrate or inhibitor; EAB represents the substrate or inhibitor reversibly bound to enzyme (Michaelis complex); EA signifies the acylated or phosphylated intermediate; B represents the leaving group; and A designates acetate (for the substrates acetylcholine or acetylthiocholine), butyrate (for the substrates butyrylcholine or butyrylthiocholine), or the di-alkoxy phosphate moiety (for an organophosphate). The lower panel contains a more complex kinetic scheme where the substrate or inhibitor also binds reversibly to a secondary site, thereby altering events at the active site. In this lower panel AB-E represents substrate or inhibitor bound reversibly to a secondary site; AB-EAB designates enzyme with reversibly bound substrate or inhibitor at both the active site and a secondary site; and AB-EB represents enzyme acylated or phosphylated at the active site, with substrate or inhibitor bound reversibly to a secondary site. All other symbols have the same meaning as in the upper panel.
Located in the vicinity of the rim of the acetylcholinesterase gorge is a region referred to as the peripheral anionic site (which includes Tyr-72, Tyr-124, Trp-286, Tyr-341, and Asp-74) that when occupied by certain ligands, including acetylcholine or acetylthiocholine, modifies activity through steric blockade and/or induction of confirmation changes in residues within the active site gorge (Barak et al., 1995; Bourne et al., 2003). Although butyrylcholinesterase was initially thought to lack a peripheral anionic site, later studies established that Asp-70 and Tyr-332 constitute the peripheral anionic site in this enzyme (Masson et al., 1996; Masson et al., 2001). A more complex reaction mechanism for both enzymes, which includes binding of substrate to the peripheral anionic site, is shown in the lower panel Figure 1.
The classic report of Main (1964) developed the inhibitory rate constant ki to describe the inhibitory capacity of organophosphorus inhibitors towards acetylcholinesterase (Fig. 1). While the ki scheme has served for many years as the basis for our understanding of how organophosphorus inhibitors interact with acetylcholinesterase kinetically, more recent studies have indicated that it is incomplete in certain instances. Studies from this laboratory have documented that certain oxons of organophosphorus insecticides, such as chlorpyrifos oxon or methyl paraoxon, have kis towards acetylcholinesterase in vitro that change as a function of inhibitor concentration, thereby displaying concentration-dependent inhibition kinetics (Rosenfeld and Sultatos, 2006; Kaushik et al., 2007; Sultatos, 2007; Sultatos and Kaushik, 2008). Stated differently, these studies have demonstrated that the capacity of individual inhibitor molecules to inhibit acetylcholinesterase (as evidenced by the ki) decreases as the inhibitor concentration increases. Interestingly, this concentration-dependent inhibition kinetics is likely not mediated through the peripheral anionic site since chlorpyrifos oxon did not displace the peripheral anionic site ligand thioflavin t (Sultatos and Kaushik, 2008).
The current report was undertaken to determine if inhibition of human butyrylcholinesterase by chlorpyrifos oxon displays concentration-dependent inhibition kinetics, as is the case with acetylcholinesterase. Given the documented similarities and differences between acetylcholinesterase and butyrylcholinesterase, comparisons of patterns of their inhibition by chlorpyrifos oxon could yield important insights into the mechanism of concentration dependent inhibition kinetics.
Materials and Methods
Chemicals
Chlorpyrifos oxon (O,O-diethyl O-(3,5,6-trichloro-2-pyridyl) phosphate) was purchased from Chem Services (West Chester, PA). Human recombinant acetylcholinesterase, human butyrylcholinesterase, and all other chemicals were purchased from Sigma Chemical Company (St. Louis, MO).
Measurement of enzyme activity
Acetylcholinesterase activity was monitored with the substrate acetylthiocholine in a plate reader (BIO-TEK Instruments, Winoski, VT), as previously described (Kaushik et al., 2007). Butyrylcholinesterase activity was measured by conventional and stopped-flow spectroscopy. For conventional spectroscopy a Shimadzu UV-2550 UV-Vis spectrophotometer (Shimadzu Scientific Instruments, Inc. Columbia, MD) was used at 24° with the wavelength set at 412 nm. The incubation volumes were 1 ml, containing 317 pM butyrylcholinesterase, 0.1 mM 5,5’-dithio-bis(2-nitrobenzoic acid)(DTNB), and various concentrations of the substrate butyrylthiocholine ranging from 0.005 mM - 3 mM. The concentration of butyrylcholinesterase was determined by titration with chlorpyrifos oxon (Amitai et al., 1998). Incubations were typically 10–15 min, and were linear throughout. The change in optical density was converted to amount of thiocholine produced by construction of a standard curve with glutathione serving as the sulfhydryl source for DTNB (this is possible since the increased optical density at 412 nm results from the liberation of 5-thio-2-nitro-benzoate upon reaction of DTNB with a sulfhydryl group (Ellman et al., 1961)).
For stopped-flow spectroscopy a SX20 stopped-flow spectrophotometer (Applied Photophysics Limited, Leatherhead, United Kingdom) was used. The instrument had a 20 µl flow cell at 24°, with the light path set at 10 mm. The wavelength was set to 412 nm, with monochromator slit openings of 5 mm. All solutions were prepared in 100 mM sodium phosphate buffer (pH 7.4), and the flow cell contained 0.5 mM butyrylthiocholine, various concentrations of butyrylcholinesterase ranging from 100 – 400 pM, and 1 mM DTNB. The concentration of DTNB was increased, compared to that used in conventional spectroscopy, so that the Ellman reaction could not become rate limiting at short time intervals (Stojan and Pavlič, 1992).
Chlorpyrifos oxon was dissolved in ethanol and stored at −17° C, at a concentration of 10 mg/ml. Appropriate dilutions of this stock solution were made in buffer to give the indicated chlorpyrifos oxon incubation concentrations. Incubation ethanol concentrations never exceeded 0.5%, and had no effect on enzyme activity (data not shown).
Determination of kinetic parameters
The Km for the hydrolysis of butyrylthiocholine was determined by fitting empirical data to three different equations.
| (1) |
| (2) |
| (3) |
In all three equations, v represents the reaction velocity; S represents the butyrylthiocholine concentration; and Vmax indicates the maximal velocity possible within the incubations. Equation 1 is the Michaelis Menten equation, and represents the kinetic scheme in the upper panel of Figure 1. Equation 2 is the Haldane equation, and includes a substrate inhibition term, Kss. Equation 3, also termed the Webb equation, is based on the more complex kinetic scheme shown in the lower panel of Figure 1. In this scheme it is assumed that there are two catalytically active enzyme-substrate complexes (EAB and AB-EAB in Figure 1), where Km1 and Km2 are analogous to their respective Michaelis constants, and where b represents the ratio of the respective maximum rates associated with each active enzyme substrate complex (Radić et al., 1993; Amitai et al., 1998; Reiner and Simeon-Rudolf, 2000). When b = 1, equation 3 reduces to equation 1. When b > 1, the enzyme is activated by substrate, and when b < 1, the enzyme is inhibited by substrate (Reiner and Simeon-Rudolf, 2000).
The determination of all kis was accomplished as described previously (Rosenfeld and Sultatos, 2006; Kaushik et al., 2007). With this approach, varying concentrations of chlorpyrifos oxon are incubated with acetylcholinesterase or butyrylcholinesterase for specified periods of time, and the phosphorylation reaction is terminated by the addition of a much larger volume containing acetylthiocholine or butyrylthiocholine, and DTNB. A ki at each chlorpyrifos oxon is calculated by fitting the empirical data, which consists of uninhibited enzyme active site concentrations over time, to a series of differential and algebraic equations descriptive of the simplest kinetic scheme in Figure 1 (Rosenfeld and Sultatos, 2006; Kaushik et al., 2007). The data fitting was carried out with ACSL (Advanced Continuous Simulation Language)(Aegis, Huntsville, AL).
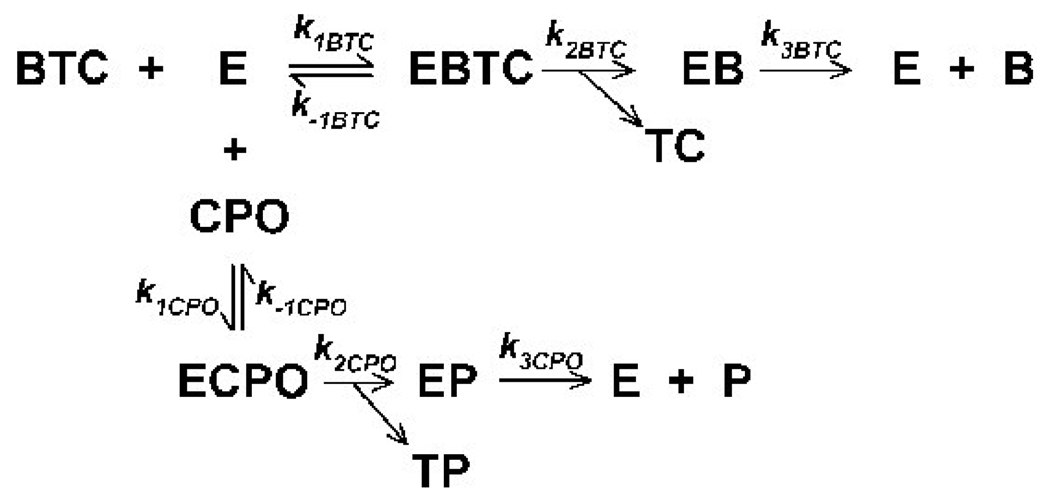
The dissociation constant, KDCPO, for binding of chlorpyrifos oxon to butyrylcholinesterase was determined with stopped-flow spectroscopy by the zero-time method (Gray and Duggleby, 1989), originally developed by Hart and O’Brien (1973). With this technique the KDCPO is determined by monitoring the hydrolysis of butyrylthiocholine in the absence and presence of a single concentration of chlorpyrifos oxon (utilizing the kinetic scheme shown in Figure 2). Four KDCPO estimations were made at each of three chlorpyrifos oxon concentrations (0.2 nM, 0.5 nM, and 0.7 nM). The KDCPO was obtained from the following equation:
| (4) |
where Km is the dissociation constant for butyrylthiocholine, and Vc is the velocity of butyrylthiocholine hydrolysis in the absence of chlorpyrifos oxon. Vo is the initial velocity of butyrylthiocholine hydrolysis in the presence of chlorpyrifos oxon (Gray and Duggleby, 1989, and Kaushik et al., 2007), and was determined by first fitting thiocholine production over time with the equation:
| (5) |
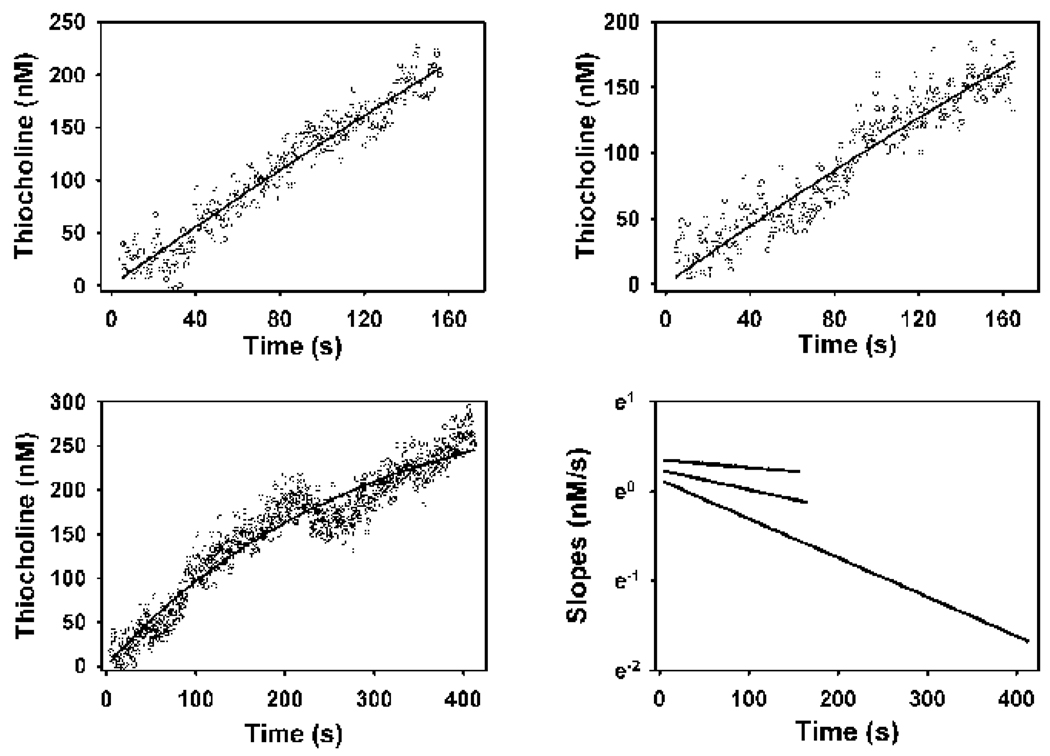
where [P] and [P]∞ are the concentrations of thiocholine at any time t and at t = ∞, respectively (Lin and Tsou, 1986; Gray and Duggleby, 1989). The constant “A” represents the apparent rate constant for the formation of phosphorylated enzyme. As described by Hart and O’Brien (1973) and Barak et al. (1995), semilogarithmic plots of the slopes of the fitted lines, determined by cubic spline analyses (Barak et al. (1995), yielded straight lines, where the intercepts equal Vo in Eq. (4).
Figure 2. Proposed kinetic model for co-incubation of butyrylthiocholine (BTC) and chlorpyrifos oxon (CPO) with butyrylcholinesterase (E).
The model assumes that substrate and inhibitor interactions with enzyme follow simple Michaelis-Menten kinetics. The Michaelis complex for substrate is EBTC, and for inhibitor is ECPO. Other abbreviations are as follows: TC is thiocholine; EB is the acylated enzyme intermediate; B is butyrate; EP is phosphorylated enzyme; TP is 3,5,6-trichloro-2-pyridinol; and P is phosphate.
The phosphorylation constant k2CPO for the phosphorylation of butyrylcholinesterase by chlorpyrifos oxon (Fig. 1 and Fig. 2) was calculated from the following equation:
| (6) |
The standard deviation for k2CPO was estimated by addition in quadrature (Taylor, 1997).
Construction of the co-incubation kinetic model
A continuous system computer model (Cellier, 1991) descriptive of the co-incubation of butyrylthiocholine and chlorpyrifos oxon with butyrylcholinesterase, as described in Figure 2, was constructed to determine binding micro-constants for substrate and inhibitor, and to assure pseudo first order conditions for the KDCPO determinations. The model was based on the following equations, where all symbols and abbreviations are the same as in Figure 2.
| (7) |
| (8) |
| (9) |
| (10) |
| (11) |
| (12) |
Additionally, the following equations were included, where ET, BTCT, and CPOT represented the initial enzyme, initial butyrylthiocholine, and initial chlorpyrifos oxon concentrations, respectively. All other symbols are the same as in Figure 2.
| (13) |
| (14) |
| (15) |
The modeling was carried out with ACSL (Advanced Continuous Simulation Language) (Aegis, Huntsville, AL).
Results
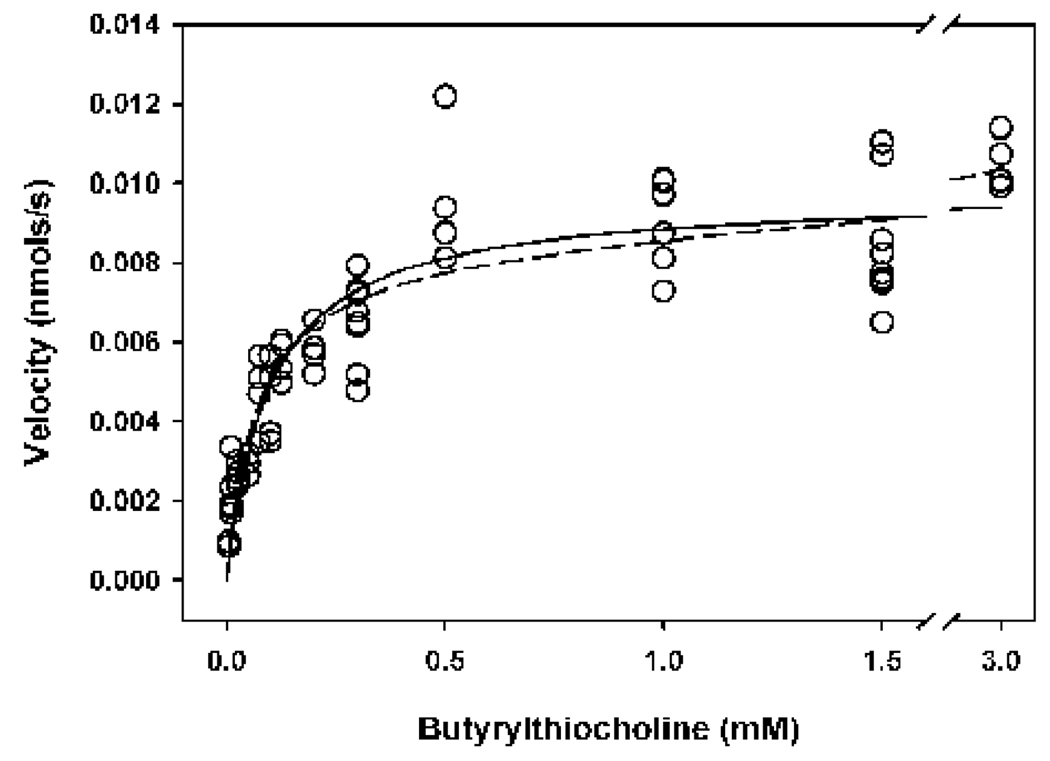
Incubation of butyrylthiocholine at concentrations ranging from 0.005 mM – 3.0 mM with butyrylcholinesterase yielded a rectangular hyperbola that was fit by nonlinear regression analyses with equation 1–equation 3 (Fig. 3)(Table 1). Equation 1–Equation 3 have been used previously by investigators to kinetically characterize activity of acetylcholinesterase and butyrylcholinesterase (Radić et al., 1993; Amitai et al., 1998; Reiner and Simeon-Rudolf, 2000). The Haldane equation (equation 2) can describe substrate inhibition with the substrate inhibition constant (Kss), while the Webb equation (equation 3) can describe both substrate inhibition and activation, and assumes the existence of two enzyme-substrate complexes (EAB and AB-EAB in the lower panel of Fig. 1) that are both catalytically active (Reiner and Simeon-Rudolf, 2000). However, no evidence of substrate inhibition was observed within the substrate concentrations utilized (Fig. 3 and Table 1), in contrast to hydrolysis of acetylthiocholine by acetylcholinesterase (Radić et al.; 1993, and Rosenfeld and Sultatos, 2006).
Figure 3. Determination of kinetic parameters descriptive of the hydrolysis of butyrylthiocholine by human butyrylcholinesterase.
The open circles represent empirical data, where each circle is indicative of a single determination of the slope of linear production of thiocholine over 10 minutes at 24°. The enzyme active site concentration was 317 pM. Fitting the data to the Michaelis-Menten equation (equation 1) or the Haldane equation (equation 2) yielded overlapping, indistinguishable fitted curves that are represented by the solid line. The dashed line designates the curve fit to the Webb equation (equation 3). Kinetic parameters are shown in Table 1.
Table 1.
Kinetic Parametersa Descriptive of Butyrylthiocholine Hydrolysis by Human Butyrylcholinesterase
| Fitted Equation | Km (mM) | Vmax (nmol/s) | Kss (mM) | Km2 (mM) | b |
|---|---|---|---|---|---|
| Michaelis-Menten | 0.10 | 9.71e−3 | - | - | - |
| (equation 1) | |||||
| Haldane | 0.10 | 9.51e−3 | 58,718 | - | - |
| (equation 2) | |||||
| Webb | 0.07b | 8.45e−3 | - | 26.09 | 1.06 |
| (equation 3) |
Kinetic parameters are defined in the text.
Represents Km1 in equation 3.
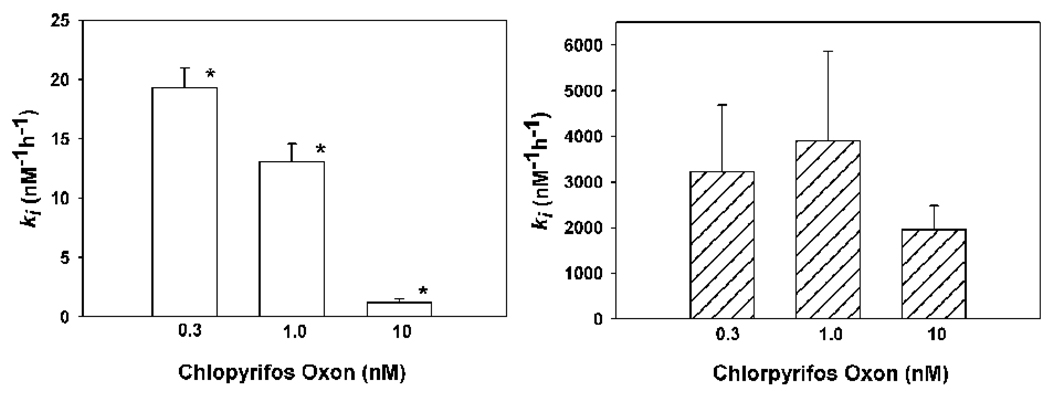
As previously reported (Kaushik et al., 2007), incubation of different concentrations of chlopryrifos oxon with acetylcholinesterase yielded kis that increased as the concentration of chlorpyrifos oxon decreased (Fig. 4). Therefore, the inhibitory capacity of individual chlorpyrifos oxon molecules towards acetylcholinesterase decreased with increasing chlorpyrfos oxon concentrations (Fig. 4). Kaushik et al. (2007) have shown that this decrease in ki levels off at about 10 nM chlorpyrifos oxon. Conversely, incubation of a similar range of concentrations of chlorpyrifos oxon with butyrylcholinesterase did not reveal any change in ki as a function of inhibitor concentration (Fig. 4). Moreover, the capacity of chlorpyrifos oxon to inhibit butyrylcholinesterase was markedly greater than the capacity of this same compound to inhibit acetylcholinesterase (Fig. 4), a phenomenon first noted by Amitai et al. (1998).
Figure 4. The relationship between chlorpyrifos oxon concentration and ki towards human acetylcholinesterase (left panel) and butyrylcholinesterase (right panel).
Each bar represents the mean ± SD of three-five determinations. The kis were determined at 24° as described by Kaushik et al., 2008. In the left panel the asterisk indicates a significant difference (p<0.05) from the other two groups by a Kruskal-Wallis analysis of variance on ranks, followed by a nonparametric Student-Newman-Keuls Test. In the right panel no significant differences were found between any of the groups by a one way analysis of variance.
The zero time method for determination of KDCPO requires pseudo first order conditions with respect to both substrate and inhibitor (Hart and O’Brien (1973); Gray and Duggleby, 1989). Therefore incubations were terminated when the co-incubation model indicated that chlorpyrifos oxon concentrations were reduced by 10% (Fig. 5)(Gray and Duggleby, 1989). The KDCPOs determined at three different chlorpyrifos oxon concentrations (0.2 nM, 0.5 nM, and 0.7 nM) were identical (data not shown), further demonstrating a lack of concentration-dependent inhibition kinetics with butyrylcholinesterase. A summary of the kinetic parameters for the interaction of chlorpyrifos oxon with butyrylcholinesterase is presented in Table 2.
Figure 5. Examples of primary plots (upper panels, and the lower left panel)) and secondary plot (lower right panel) for the determination of the KDCPO for the binding of chlorpyrifos oxon to butyrylcholinesterase, by the zero time method (Hart and O’Brien (1973), and Gray and Duggleby, 1989).
The open circles in the primary plots represent data generated by stopped flow spectroscopy at 24°, and the solid lines are the best fit lines to equation 5. Each primary plot shows a single example of thiocholine production from 150 pM butyrylcholinesterarse active sites and 50 µM butyrylthiocholine, with the following chlorpyfios oxon levels: upper left panel, 0.2 nM; upper right panel, 0.5 nM; and the lower left panel, 0.7 nM. The lines in the secondary plot are the slopes of the fitted lines from the other three panels, as determined by analysis with cubic splines (Barak et al., 1995). These analyses were repeated three additional times for each inhibitor concentration. The intercepts of the lines within the secondary plot were determined by linear regression analyses, and were used in equation 4 to calculate the KDCPO, which is shown in Table 2. While the incubations proceeded for 500 s, only those data where the chlorpyrifos oxon consumed in the reactions was less than 10% of the initial inhibitor concentration (as determined by the co-incubation model) are shown, and were used for the calculations.
Table 2.
Kinetic Parameters Descriptive of the Interaction of Chlorpyrifos Oxon with Human Butyrylcholinesterase
The mean ± SD of at least four determinations.
Calculated from ki and Kd as described in Figure 1. The standard deviation was calculated by addition in quadrature (Taylor, 1997).
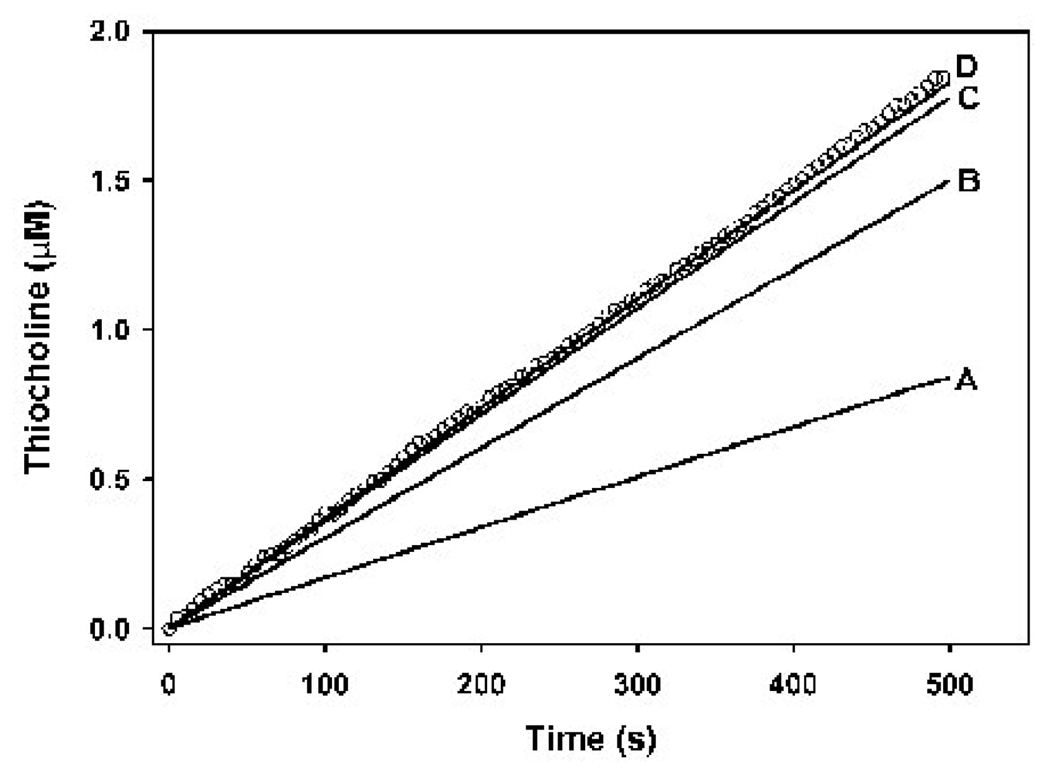
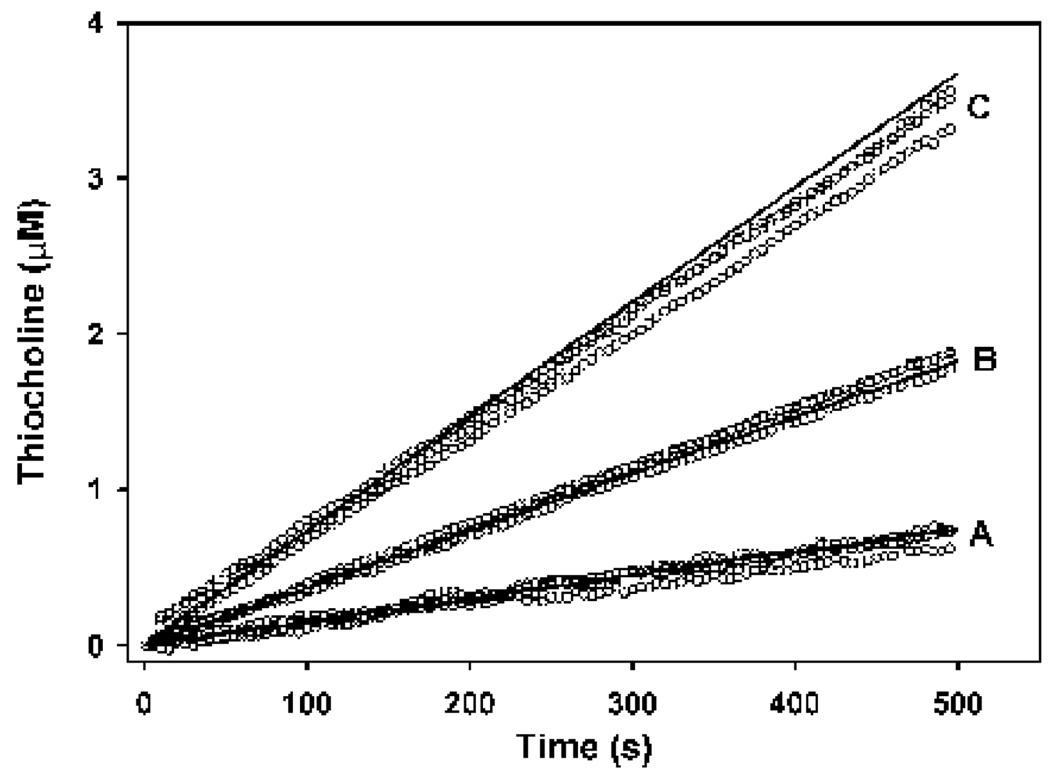
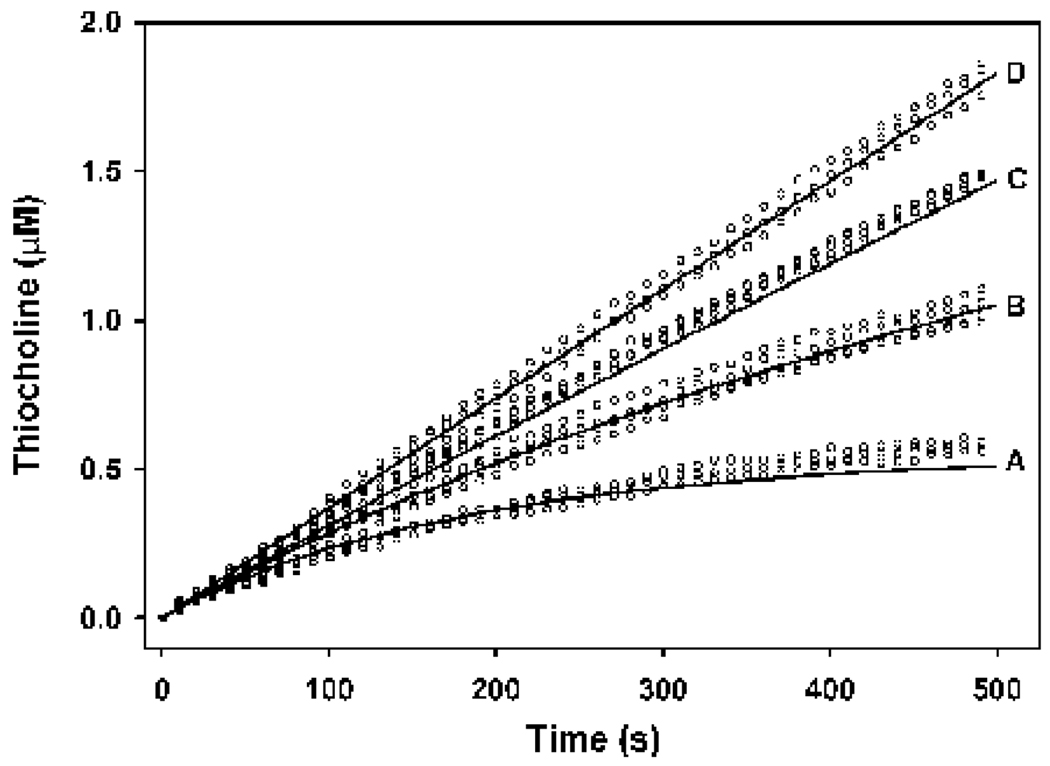
Development of the co-incubation kinetic model (based on the kinetic scheme shown in Fig. 2) required knowledge of the binding constants k1BTC and k−1BTC (eq. 7). The constant k1BTC was determined by optimization of the model (with a chlorpyrifos oxon concentrations of zero), to an empirical data set (Fig. 6). The constant k−1BTC was calculated from k1BTC and KDBTC (Table 3). An exact, single solution of the model for k1BTC (and consequently k−1BTC) was not possible, since a k1BTC of 0.65 nM−1min−1 or greater gave identical, overlapping simulations, all of which fit the data set (Fig. 6). These results indicated that, although the exact value of k1BTC could not be determined, the co-incubation model accurately simulated butyrylthiocholine hydrolysis by butyrylcholinesterase as long as k1BTC was assigned a value of 0.65 nM−1min−1 or greater. For all subsequent modeling, a value of 0.65 nM−1min−1 was used. The validity of the model with the optimized k1BTC and k−1BTC was evaluated by modeling additional data sets with different substrate and enzyme concentrations (Fig. 7).
Figure 6. Optimization of the butyrylcholinesterase model for determination of k1BTC.
The solid lines show the model output at different k1BTCs, while the open circles represent a single empirical data set, where enzyme active site concentrations was 159 pM and the butyrylthiocholine concentration was 0.25 mM. Only one empirical data set out of four is shown for visual clarity. The values for k1BTC in the model were as follows: A = 0.01 nM−1min−1; B = 0.05 nM−1min−1; C = 0.25 nM−1min−1; and D = 0.65 nM−1min−1. Increasing the k1BTC beyond 0.65 nM−1min−1 yielded output equal to that for k1BTC = 0.65 nM−1min−1. Therefore a k1BTC of 0.65 mM−1min−1 or greater gave the best fit to the empirical data.
Table 3.
Parameters Utilized In the Coincubation Kinetic Model
| Parameter | Value | Source |
|---|---|---|
| KDBTC | 107,013 nM | (k2BTC*Km)/(Vmax/[E]T) (adapted from Masson et al., 2008) |
| k1BTC | 0.65 nM−1min−1 | optimization |
| k−1BTC | 69,558 min−1 | KDBTC*k1BTC |
| k2BTC | 1,965 min−1 | (Vmax/[E]T)/(1-(Vmax/[E]T)/k3BTC) (adapted from Masson et al., 2008) |
| k3BTC | 28,020 min−1 | Stojan et al, 2002 |
| KMBTC | 100,000 nM | Table 1 |
| KDCPO | 2.02 nM | Table 2 |
| k1CPO | 0.7 nM−1min−1 | optimization |
| k−1CPO | 1.41 min−1 | KDCPO*k1CPO |
| k2CPO | 103 min−1 | Table 2 |
Figure 7. Comparison of butyrylcholinesterase model output (solid lines) at different enzyme and substrate concentrations with empirical data (open circles), with a k1BTC of 0.65 nM−1min−1.
In all cases no chorpyrifos oxon was included. The incubation conditions and model parameters were as follows: butyrylthiocholine = 50 µM with enzyme active sites = 100 pM (A); butyrylthiocholine = 0.25 mM with enzyme active sites = 159 pM (B); butyrylthiocholine = 0.5 mM, with enzyme active sites = 290 pM. The data set in group B were used to optimize the model for k1BTC determinations shown in Figure 6.
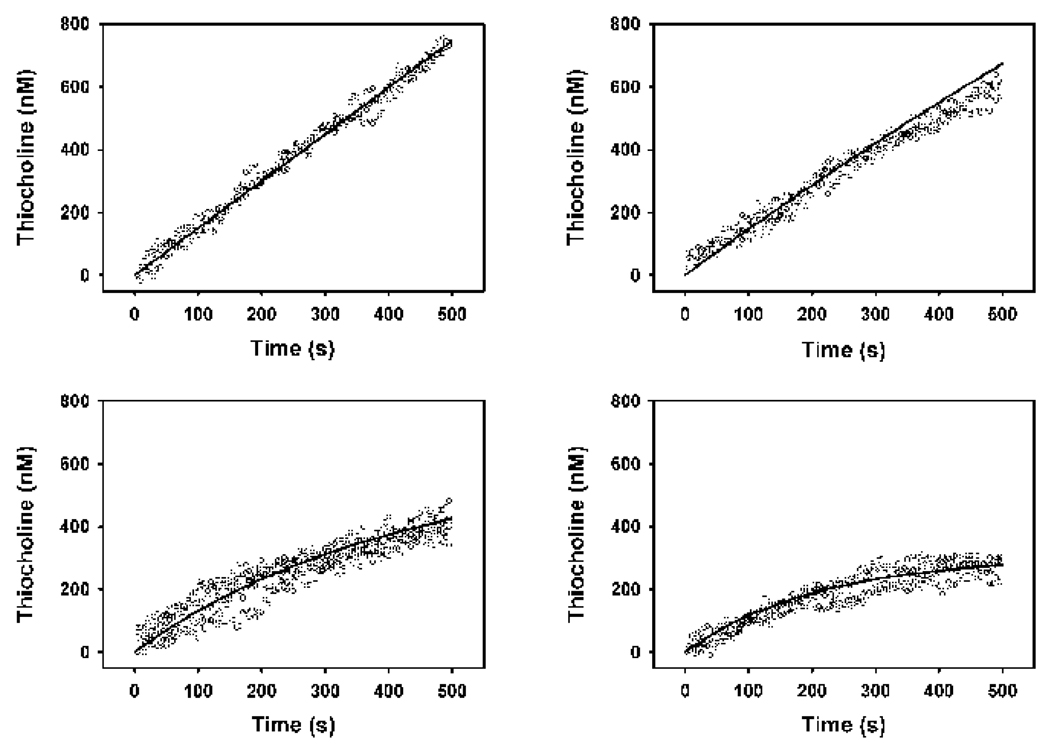
Modeling the addition of chlorpyrifos oxon with the co-incubation model became possible after determination of the parameters required for the description of butyrylthiocholine hydrolysis. Optimization of the model with both substrate and inhibitor present to determine k1CPO yielded a single, exact solution of 0.70 nM−1min−1 for this parameter (Fig. 8, Table 3). Consequently a single solution for k−1CPO was found as well (Table 3). And finally, the validity of the co-incubation model with both substrate and inhibitor present together was evaluated by simulating empirical data sets generated with incubation conditions different from those of the optimization procedure (Fig. 9).
Figure 8. Optimization of the co-incubation model to empirical data to determine k1CPO.
In all cases the butyrylthiocholine concentration was 50 µM, and the enzyme active site concentrations was 150 pM. The chlorpyrifos oxon levels were as follows: upper left panel, 0 nM; upper right panel, 0.2 nM; lower left panel, 0.5 nM; lower right panel, 0.7 nM). The open circles represent three or four sets of empirical data at each oxon concentration, and the solid lines represent the model best fit, which was with a k1CPO = 0.7 nM−1min−1.
Figure 9. Validation of the co-incubation model by simulation of various incubation conditions.
The open circles represent empirical data while the solid lines represent model output. In all cases the enzyme concentration was 317 pM and the butyrylthiocholine level was 50 µM. The chlorpyrifos oxon concentrations were as follows: 0.7 nM (A); 0.3 nM (B); 0.1 nM (C); and 0 nM (D).
Discussion
Although much is known about the reaction mechanisms of acetylcholinesterase and butyrylcholinesterase, the exact details of how these enzymes interact with various substrates and inhibitors are not clearly understood. These enzymes have been reported to display simple Michaelis-Menten kinetics, as well as substrate (ligand) inhibition and/or substrate (ligand) activation, depending upon the substrate examined, and the incubation conditions (Main. A.R., 1964; Amitai et al., 1998; Levitsky et al., 1999; Reiner and Simeon-Rudolf, 2000; Marcel et al., 2000; Masson et al., 2002; Masson et al., 2003; Johnson et al., 2003). For example, at low concentrations of the substrate butyrylthiocholine, hydrolysis can be described by simple Michaelis-Menten kinetics (Amitai et al., 1998). The hydrolysis rate of butyrylthiocholine at intermediate levels exceeds that predicted by Michaelis-Menten kinetics, while very high concentrations of butyrylthiocholine slightly inhibit butyrylcholinesterase (Masson et al., 1996; Masson et al., 1997; Stojan et al., 2002). Within the conditions of the current study, hydrolysis of butyrylthiocholine by butyrylcholinesterase was adequately described by simple Michaelis-Menten kinetics (Fig. 3 and Table 1), thereby confirming the report by Amitai et al. (1998). The enormous Kss from the Haldane equation (Table 1), as well as visual inspection of the data (Fig. 2) suggests a lack of substrate inhibition, while the value of b (close to 1) and the large Km2 argues against the existence of two enzyme-substrate complexes (Reiner and Simeon-Rudolf, 2000).
The development of the co-incubation model was an iterative process, coupled with the determination of KDCPO since each of these two tasks was related to, and dependent upon, the other. The measurement of KDCPO by the zero time method requires pseudo first order conditions with respect to substrate and inhibitor (Hart and O’Brien (1973); Gray and Duggleby, 1989). In order to satisfy this important requisite, the concentration of substrate and inhibitor must be significantly lower than their respective KDs, and no more than 10% of the substrate or inhibitor should be consumed during the course of the reactions (Gray and Duggleby, 1989). Initial determinations of KDCPO yielded estimates with incubation conditions that were subsequently found by the modeling to deviate from pseudo first order conditions. The incubation and model parameters were modified appropriately, and the zero time method was redone. Thus this iterative process was repeated until the co-incubation model indicated that pseudo first order conditions were maintained during the incubation.
Given the kinetic complexities known to exist for the hydrolysis of various substrates by acetylcholinesterase, it should not be surprising that the interactions of certain oxygen analogs of organophosphorus insecticides with acetylcholinesterase deviate from the often assumed simple Michaelis-Menten kinetics. In the current report, in sharp contrast to the interaction of chlorpyrifos oxon with acetylcholinesterase (Fig. 3), the inhibition of butyrylcholinesterase by chlorpyrifos oxon did not yield a changing ki as a function of oxon concentration (Fig. 4), suggesting that under the current incubation conditions simple Michaelis-Menten kinetics does apply with butyrylcholinesterase. It should be noted that the ki (Figure 5) was found to be larger than that reported by Amitai et al. (1998). However, the determinations described in Amitai et al. (1998) very likely deviated from pseudo first order conditions, given their substrate and inhibitor concentrations, as well as their incubation times.
The differential action of chlorpyrifos oxon on acetylcholinesterase and butyrylcholinesterase might provide some further understanding of the potential mechanism of the concentration-dependent inhibition kinetics observed with chlorpyrifos oxon and acetylcholinesterase (Fig. 4)(Kaushik et al., 2007). Crystallographic analyses of acetylcholinesterase and butyrylcholinesterase have revealed certain shared characteristics, such as a deep active site gorge with a catalytic triad and similar architecture (Nicolet et al., 2003; Masson et al., 2007). However, the active site gorge of butyrylcholinesterase is larger than that of acetylcholinesterase (Nicolet et al., 2003), by as much as ~ 200 Å3 (Saxena et al., 1999). This volume disparity almost certainly plays a role in the differential inhibitory capacity of chlorpyrifos oxon towards these two enzymes, as well as the occurrence of concentration-dependent inhibition kinetics with the more restrictive acetylcholinesterase. In this regard, Amitai et al. (1999) have shown that the double-site mutation of the phenylalanine residues at positions 295 and 297 in the acyl pocket of the active site gorge of acetylcholinesterase to the much less bulky leucine and valine, respectively, increased the ki for inhibition of acetylcholinesterase by chlorpyrifos oxon by a factor of 150, primarily by lowering the Kd for this inhibitor. Previous studies have demonstrated that the replacement of the bulky phenylalanine residues in the acyl pocket of acetylcholinesterase with smaller amino acid residues yields an enzyme with certain characteristics of butyrylcholinestersase with respect to substrate specificity (Harel et al., 1992; Ordentlich et al., 1993; Vellom et al., 1993).
Acetylcholinesterase has been known for many years to display substrate inhibition (Alles and Hawes, 1940, and Radić et al., 1993), and although the concentration-dependent inhibition kinetics of chlorpyrifos oxon (Fig. 4) is somewhat analogous to substrate inhibition, the mechanism for the chlorpyrifos oxon effect is likely much different than that seen with substrates such as acetylthiocholine. At high concentrations of acetylthiocholine (as well as acetylcholine), substrate molecules bound to the peripheral anionic site hinder the exit of choline, thereby reducing activity (Shafferman et al., 1992; Rosenberry et al., 1999; Stojan et al., 2004; and Colletier et al., 2006). At still higher substrate concentrations, a substrate molecule can bind to the catalytic anionic subsite (Trp-84, Glu-199, and Phe-330) in a particular conformation that impedes deacetylation, thereby reducing activity. Such actions for chlorpyrifos oxon are not possible since this inhibitor does not seem to interact significantly with the peripheral anionic site of acetylcholinesterase since it did not competitively displace the peripheral anionic site ligand, thioflavin t (Sultatos and Kaushik, 2008). Moreover, both mechanisms of substrate inhibition identified for acetylthiocholine are mediated through the inhibition of the hydrolysis of the acetylated intermediate. The concentration-dependent inhibition kinetics of chlorpyrifos oxon cannot result from inhibition of the hydrolysis of the phosphorylated intermediate because dephosphorylation is already a very slow process.
Possible mechanisms for the concentration-dependent inhibition kinetics of chlorpyrifos oxon include binding to some as yet unidentified allosteric binding site, or hysteresis of aceytlcholinesterase. Enzymes that display hysteresis exist in at least two different conformations, where the conformations differ in their capacities to metabolize substrate (James and Tawfik, 2003, and Masson et al., 2005). Conformational diversity observed in proteins ranges from fluctuations of side-chains to the movement of loops and secondary structures, and even to global tertiary structure rearrangements (James and Tawfik, 2003). Human butyrylcholinesterase and insect acetylcholinesterase have been shown to display hysteresis with certain substrates such as N-methylindoxylacetate (Masson et al., 2005, Masson et al., 2007, and Badiou et al., 2008). In both cases enzyme was shown to likely exist in two conformations in equilibrium, where only one form hydrolyzed substrate, or where the two forms possessed different catalytic activity towards substrate. Upon addition of substrate, all enzyme eventually converted to the more active conformation. A similar model for the interaction of chorpyrifos oxon with acetylcholinesterase could account for concentration-dependent inhibition kinetics (Fig. 4). Two conformational forms of acetylcholinesterase with differing reactivities towards chlorpyrifos oxon could yield an aggregate ki that would appear to change if progressively higher oxon concentrations interacted more with that enzyme form with a lower reactivity (smaller ki).
Acknowledgements
This work was supported by NIH grant ES012648. The sponsor was not involved in the study design; in the collection, analysis, and interpretation of data; in the writing of the report; or in the decision to submit the paper for publication.
Footnotes
Publisher's Disclaimer: This is a PDF file of an unedited manuscript that has been accepted for publication. As a service to our customers we are providing this early version of the manuscript. The manuscript will undergo copyediting, typesetting, and review of the resulting proof before it is published in its final citable form. Please note that during the production process errors may be discovered which could affect the content, and all legal disclaimers that apply to the journal pertain.
Conflict of Interest Statement
None of the authors have a conflict of interest.
References
- Alles GA, Hawes RC. Cholinesterases in the blood of man. J. Biol. Chem. 1940;133:375–390. [Google Scholar]
- Amitai G, Moorad D, Adani R, Doctor BP. Inhibition of acetylcholinesterase and butyrylcholinesterase by chlorpyrifos oxon. Biochem. Pharmacol. 1998;56:293–299. doi: 10.1016/s0006-2952(98)00035-5. [DOI] [PubMed] [Google Scholar]
- Badiou A, Froment MT, Fournier D, Masson P, Belzunces LP. Hysteresis of insect acetylcholinesterase. Chemico-Biologic. Interact. 2008;175:410–412. doi: 10.1016/j.cbi.2008.05.039. [DOI] [PubMed] [Google Scholar]
- Barak D, Ordentlich A, Bromber A, Kronman C, Marcus D, Lazar A, Ariel N, Velan B, Shafferman A, Ariel N, Velan B, Shafferman A. Allosteric modulation of acetylcholinesterase activity by peripheral ligands involves a conformational transition of the anionic subsite. Biochemistry. 1995;34:15444–15452. doi: 10.1021/bi00047a008. [DOI] [PubMed] [Google Scholar]
- Bourne Y, Taylor P, Radic Z, Marchot P. Structural insights into ligand interactions at the acetylcholinesterase peripheral anionic site. EMBO J. 2003;22:1–12. doi: 10.1093/emboj/cdg005. [DOI] [PMC free article] [PubMed] [Google Scholar]
- Cellier FE. Continuous System Modeling. New York: Springer-Verlag; 1991. [Google Scholar]
- Colletier JP, Fournier D, Greenblatt HM, Stojan J, Sussman JL, Zaccai G, Silman I, Weik M. Structural insights into substrate traffic and inhibition in acetylcholinesterase. EMBO J. 2006;25:2746–2756. doi: 10.1038/sj.emboj.7601175. [DOI] [PMC free article] [PubMed] [Google Scholar]
- Darvesh S, Hopkins DA, Geula C. Neurobiology of butyrylcholinesterase. Ann. Rev. Neurosci. 2003;4:131–138. doi: 10.1038/nrn1035. [DOI] [PubMed] [Google Scholar]
- Ellman GL, Courtney D, Valention A, Featherstone RM. A new and rapid colorimetric determination of acetylcholinesterase activity. Biochem. Pharmacol. 1961;7:88–95. doi: 10.1016/0006-2952(61)90145-9. [DOI] [PubMed] [Google Scholar]
- Gray PJ, Duggleby RG. Analysis of kinetic data for irreversible enzyme inhibition. Biochem. J. 1989;257:419–424. doi: 10.1042/bj2570419. [DOI] [PMC free article] [PubMed] [Google Scholar]
- Harel M, Sussman JL, Krejci E, Bon S, Chanal P, Massoulié J, Silman I. Conversion of acetylcholinesterase to butyrylcholinesterase. Modeling and mutagenesis. Proc. Natl. Acad. Sci. 1992;89:10827–10831. doi: 10.1073/pnas.89.22.10827. [DOI] [PMC free article] [PubMed] [Google Scholar]
- Hart GJ, O’Brien RD. Recording spectrophotometric method for determination of dissociation and phosphorylation constants for the inhibition of acetylcholinesterase by organophosphates in the presence of substrate. Biochemistry. 1973;12:2940–2945. doi: 10.1021/bi00739a026. [DOI] [PubMed] [Google Scholar]
- James LC, Tawfik DS. Conformational diversity and protein evolution – a 60-year-old hypthesis revisited. Trends in Biochem. Sci. 2003;28:361–368. doi: 10.1016/S0968-0004(03)00135-X. [DOI] [PubMed] [Google Scholar]
- Johnson JL, Cusack B, Davies MP, Fauq A, Rosenberry TL. Unmasking tandem site interaction in human acetylcholinesterase. Substrate activation with a cationic acetanilide substrate. Biochemistry. 2003;42:5438–5452. doi: 10.1021/bi027065u. [DOI] [PubMed] [Google Scholar]
- Kaushik R, Rosenfeld CA, Sultatos LG. Concentration-dependent interactions of the organophosphates chlorpyrifos oxon and methyl paraoxon with human recombinant acetylcholinesterase. Toxicol. Appl. Pharmacol. 2007;221:243–250. doi: 10.1016/j.taap.2007.03.013. [DOI] [PMC free article] [PubMed] [Google Scholar]
- Levitsky V, Xie W, Froment M-T, Lockridge O, Masson P. Polyol-induced activation by excess substrate of the D70G butyrylcholinesterase mutant. Biochim. Biophys. Acta. 1999;1429:422–430. doi: 10.1016/s0167-4838(98)00253-2. [DOI] [PubMed] [Google Scholar]
- Lin W, Tsou CL. Determination of rate constants for the irreversible inhibition of acetylcholine esterase by continuously monitoring the substrate reaction in the presence of the inhibitor. Biochim. Biophys. Acta. 1986;870:185–190. doi: 10.1016/0167-4838(86)90220-7. [DOI] [PubMed] [Google Scholar]
- Lockridge O, Bartels CF, Vaughan TA, Wong CK, Norton SE, Johnson II. Complete amino acid sequence of human serum cholinesterase. J. Biol. Chem. 1987;262:549–557. [PubMed] [Google Scholar]
- Main AR. Affinity and phosphorylation constants for the inhibition of esterases by organophosphates. Science. 1964;144:992–993. doi: 10.1126/science.144.3621.992. [DOI] [PubMed] [Google Scholar]
- Marcel VS, Estrada-Mondaca S, Magne F, Stojan J, Kleebe A, Fournier D. Exploration of the Drosophila acetylcholinesterase substrate activation site using a reversible inhibitor (Triton X-100) and mutated unzymes. J. Biol. Chem. 2000;275:11603–11609. doi: 10.1074/jbc.275.16.11603. [DOI] [PubMed] [Google Scholar]
- Masson P, Froment M-T, Bartels CF, Lockridge O. Asp70 in the peripheral anionic site of human butyrylcholinesterase. Eur. J. Biochem. 1996;235:36–48. doi: 10.1111/j.1432-1033.1996.00036.x. [DOI] [PubMed] [Google Scholar]
- Masson P, Legrand P, Bartels CF, Froment M-T, Schopfer LM, Lockridge O. Role of aspartate 70 and tryptophan 82 in binding of succinyldithiocholine to human butyrylcholinesterase. Biochem. 1997;36:2266–2277. doi: 10.1021/bi962484a. [DOI] [PubMed] [Google Scholar]
- Masson P, Xie W, Froment M-T, Lockridge O. Effects of mutations of active site residues and amino acids interacting with the Ω loop on substrate activation of butyrylcholinesterase. Biochim. Biophys. Acta. 2001;1544:166–176. doi: 10.1016/s0167-4838(00)00217-x. [DOI] [PubMed] [Google Scholar]
- Masson P, Schopfer LM, Bartels CF, Froment M-T, Ribes F, Nachon F, Lockridge O. Substrate activation in aceytlcholinesterase induced by low pH or mutation in the π-cation subsite. Biochim. Biophys. Acta. 2002;1594:313–324. doi: 10.1016/s0167-4838(01)00323-5. [DOI] [PubMed] [Google Scholar]
- Masson P, Nachon F, Bartels CF, Froment M-T, Ribes F, Mathews C, Lockridge O. High activity of human butyrylcholinesterase at low pH in the presence of excess butyrylthiocholine. Eur. J. Biochem. 2003;270:315–324. doi: 10.1046/j.1432-1033.2003.03388.x. [DOI] [PubMed] [Google Scholar]
- Masson P, Schopfer LM, Froment M-T, Debouzy J-C, Nachon F, Gillon E, Lockridge O, Hrabovska A, Goldstein BN. Hysteresis of butyrylcholinesterase in the approach to steady-state kinetics. Chemico-Biologic. Interact. 2005;157–158:143–152. doi: 10.1016/j.cbi.2005.10.019. [DOI] [PubMed] [Google Scholar]
- Masson P, Froment M-T, Gillon E, Nachon F, Darvesh S, Schopfer LM. Kinetic analysis of butyrylcholinesterase-catalyzed hydrolysis of acetanilides. Biochim. Biophys. Acta. 2007;1774:1139–1147. doi: 10.1016/j.bbapap.2007.06.004. [DOI] [PubMed] [Google Scholar]
- Masson P, Froment M-T, Gillon E, Nachon F, Lockridge O, Schopfer LM. Kinetic analysis of effector modulation of butyrylcholinesterase-catalyzed hydrolysis of acetanilides and homologous esters. FEBS J. 2008;275:2617–2631. doi: 10.1111/j.1742-4658.2008.06409.x. [DOI] [PubMed] [Google Scholar]
- Nicolet Y, Lockridge O, Masson P, Fontecill-Camps JC, Nachon F. Crystal structure of human butyrylcholinesterase and of its complexes with substrates and products. J. Biol. Chem. 2003;278:41141–41147. doi: 10.1074/jbc.M210241200. [DOI] [PubMed] [Google Scholar]
- Ordentlich A, Barak D, Kronman C, Flashner Y, Leitner M, Segall Y, Ariel N, Cohen S, Velan B, Shafferman A. Dissection of the human acetylcholinesterase active center determinants of substrate specificity. Identification of residues constituting the anionic site, the hydrophobic site, and the acyl pocket. J. Biol. Chem. 1993;268:17083–17095. [PubMed] [Google Scholar]
- Quinn DM. Acetylcholinesterase: Enzyme structure, reaction dynamics and virtual transition states. Chem. Rev. 1987;87:955–979. [Google Scholar]
- Radić Z, Pickering NA, Vellom DC, Camp S, Taylor P. Three distinct domains in the cholinesterase molecule confer selectivity for acetyl- and butyrylcholinesterase inhibitors. Biochemistry. 1993;32:12074–12084. doi: 10.1021/bi00096a018. [DOI] [PubMed] [Google Scholar]
- Reiner E, Simeon-Rudolf V. Cholinesterase: substrate inhibition and substrate activation. Pflügers Arch. – Eur. J. Physiol. 2000;440 Suppl:R118–R120. doi: 10.1007/s004240000029. [DOI] [PubMed] [Google Scholar]
- Rosenberry TL, Mallender WD, Thomas PJ, Szegletes T. A steric blockade model for inhibition of acetylcholinesterase by peripheral site ligands and substrate. Chem. Biol. Interact. 1999;119–120:85–97. doi: 10.1016/s0009-2797(99)00017-4. [DOI] [PubMed] [Google Scholar]
- Rosenfeld CA, Sultatos LG. Concentration-dependent kinetics of acetylcholinesterase inhibition by the organophosphate paraoxon. Tox. Sci. 2006;90:460–469. doi: 10.1093/toxsci/kfj094. [DOI] [PubMed] [Google Scholar]
- Saxena A, Redman AMG, Jiang X, Lockridge O, Doctor BP. Differences in active-site gorge dimensions of cholinesterases revealed by binding of inhibitors to human butyrylcholinesterase. Chemico-Biologic. Interact. 1999;119–120:61–69. doi: 10.1016/s0009-2797(99)00014-9. [DOI] [PubMed] [Google Scholar]
- Shafferman A, Velan B, Ordentlich A, Kronman C, Grosfeld H, Leitner M, Flashner Y, Cohen S, Barak D, Ariel N. Substrate inhibition of acetylcholinesterase: residues affecting signal transduction from the surface to the catalytic center. EMBO J. 1992;11:3561–3568. doi: 10.1002/j.1460-2075.1992.tb05439.x. [DOI] [PMC free article] [PubMed] [Google Scholar]
- Stojan J, Pavlič MR. Velocity of Ellman’s reaction and its implication for kinetic studies in the millisecond time range. Neurochem. Res. 1992;17:1207–1210. doi: 10.1007/BF00968401. [DOI] [PubMed] [Google Scholar]
- Stojan J, Goličnik M, Froment M-T, Estour F, Masson P. Concentration-dependent reversible activation-inhibition of human butyrylcholinesterase by tetraethylammonium ion. Eur. J. Biochem. 2002;269:1154–1161. doi: 10.1046/j.1432-1033.2002.02749.x. [DOI] [PubMed] [Google Scholar]
- Stojan J, Brochier L, Alies C, Colletier JP, Fournier D. Inhibition of Drosophila melanogaster acetylcholinesterase by high concentrations of substrate. Eur. J. Biochem. 2004;271:1364–1371. doi: 10.1111/j.1432-1033.2004.04048.x. [DOI] [PubMed] [Google Scholar]
- Sultatos LG. Concentration-dependent binding of chlorpyrifos oxon to acetylcholinesterase. Tox. Sci. 2007;100:128–135. doi: 10.1093/toxsci/kfm197. [DOI] [PubMed] [Google Scholar]
- Sultatos LG, Kaushik R. Altered binding of thioflavin t to the peripheral anionic site of acetylcholinesterase after phosphorylation of the active site by chlorpyrifos oxon or dichlorvos. Toxicol. Appl. Pharmacol. 2008;230:390–396. doi: 10.1016/j.taap.2008.03.006. [DOI] [PubMed] [Google Scholar]
- Taylor JR. second edition. Sausalito: University Science Books; 1997. An Introduction to Error Analyses: The Study of Uncertainties in Physical Measurements. [Google Scholar]
- Valle AM, Radić Z, Rana BK, Whitfield JB, O’Connor DT, Martin NG, Taylor P. The cholinesterases: Analysis by pharmacogenomics in man. Chem. Biol. Interact. 2008 doi: 10.1016/j.cbi.2008.04.042. doi: 10.1016/j.cbi.2008.04.042. [DOI] [PMC free article] [PubMed] [Google Scholar]
- Vellom D, Radić Z, Li Y, Pickering NA, Camp S, Taylor P. Amino acid residues controlling acetylcholinesterase and butyrylcholinesterase specificity. Biochemistry. 1993;32:12–17. doi: 10.1021/bi00052a003. [DOI] [PubMed] [Google Scholar]


