Abstract
The coordination of iron(III) to the marine amphiphilic marinobactin and aquachelin siderophores, as well as to petrobactin, the unusual 3,4-dihydroxybenzoyl siderophore is reported. Potentiometric titrations were performed on the apo siderophore to determine the ligand pKa values, as well as the complex formed with addition of one equivalent of Fe(III). The logKML values for Fe(III)-marinobactin-E and Fe(III)-aquachelin-C are 31.80 and 31.4, respectively, consistent with the similar coordination environment in each complex, while logKML for Fe(III)-petrobactin is estimated to be ca. 43. The pKa of the β-hydroxyaspartyl hydroxyl group was determined to be 10.8 by 1H NMR titration. 13C NMR and IR were used to investigate Ga(III) coordination to the marinobactins. The coordination-induced shifts (CIS) in the 13C NMR spectrum of Ga(III)-marinobactin-C compared to apo-marinobactin-C indicates that the hydroxamate groups are coordinated to Ga(III), however, the lack of CISs for the carbons of the β-hydroxyamide group suggests this moiety is not coordinated in the Ga(III) complex. Differences in the IR spectrum of Ga(III)-marinobactin-C and Fe(III)-marinobactin-C in the 1600–1700 cm−1 region also corroborates Fe(III) is coordinated to the β-hydroxyamide moiety, whereas Ga(III) is not coordinated to the β-hydroxyamide group.
Introduction
For the vast majority of microbes, life without iron is not possible. While iron is an essential element, it is present in the environment as insoluble minerals such as hematite, goethite, and pyrite or as polymeric oxide-hydrates, -carbonates, and –silicates, severely restricting its bioavailability. To acquire iron, many aerobic bacteria secrete siderophores, which are ligands that have a high affinity for iron(III). Siderophores function not only in the extracellular solubilization of iron(III) from minerals, but also in the receptor-mediated transport of Fe(III)-siderophores into microbial cells.
Although iron ranks as the fourth most abundant element in the Earth’s crust, iron levels in the ocean are surprisingly low, ranging 20 pM to 1 nM over much of the world’s oceans. These low levels of iron have been shown to limit primary production by autotrophic microorganisms 1–4 and also heterotrophic bacteria.5 The dissolved Fe(III) in surface waters is complexed by natural organic ligands, 6–8 which may also play a role in limiting the availability of iron to microorganisms. Thus, iron is arguably the most important of all the bioactive metals in the oceans.9
A large percentage of the characterized marine siderophores can be classified as amphiphilic, 10–14 suggesting an iron uptake strategy tailored to the physical and chemical constraints of the marine environment. In addition the presence of α-hydroxy carboxylate groups in many marine siderophores renders their Fe(III) complexes photoactive.11, 15–18 Sunlight-driven photoreduction of the Fe(III) in such siderophores transiently produces Fe(II) which can be utilized by other organisms, although in the one case studied in detail, the photooxidized siderophore remains capable of binding iron(III) and transporting it into the cell of the producing organism.18 As part of an overall program of isolation and characterization of siderophores from marine microbes, we have investigated representatives of three families of siderophores isolated from different species of marine bacteria and which contain an α-hydroxy carboxylate core, specifically the marinobactins, the aquachelins and petrobactin.
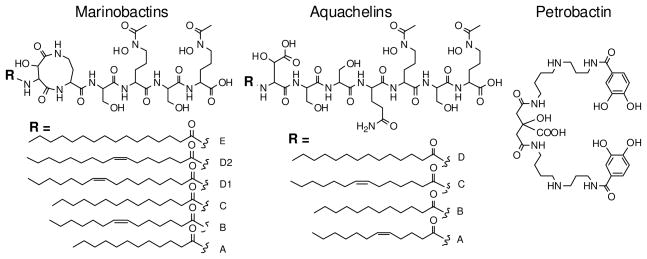
The marinobactins and aquachelins are two suites of amphiphilic peptide siderophores produced by distinct genera of marine bacteria, Marinobacter and Halomonads.10, 13, 19 The marinobactins have a six-amino acid peptide headgroup with an N-terminal appendage of one of a series of fatty acid residues, ranging from C-12 to C-18 [Figure 1].10, 13 These siderophores span a range of amphiphilicities as a result of the fatty acid appendage variations. The apo- and Fe(III)- complexes can form spherical micelles,20, 21 while the Fe(III)-marinobactins can be induced to form vesicles.10, 21, 22 Apo and Fe(III)-marinobactins also partition to varying degrees in membrane bilayers.23 The aquachelins are characterized by a seven amino-acid peptide with N-terminal appendages ranging from C-12 to C-14 fatty acids.10 As a result of their shorter fatty acid tails and longer peptide headgroup, the aquachelins are more hydrophilic within the amphiphilic spectrum than are the marinobactins.
Figure 1.
Structures of the Marinobactins, Aquachelins and Petrobactin
Petrobactin (PB), on the other hand, is a citrate-based catecholate-type siderophore first isolated from a culture of the oil-degrading marine bacterium Marinobacter hydrocarbonoclasticus,17, 24, 25 and M. aquaeolei.26 This siderophore is unique in that it utilizes the unusual 3,4-dihydroxybenzoyl chelating subunit rather than the common 2,3-dihydroxybenzoyl moiety, 24, 25 Further interest in PB comes from the fact that it is also found to be produced by terrestrial bacteria and has recently been shown to play an important role in growth and virulence under iron-deficient conditions of the bioterrorism agent Bacillus anthracis where, because it does not bind to siderocalin, it has been designated as a “stealth siderophore” that can avoid recognition by the mammalian immune system.27–32
Given the interest in how oceanic microorganisms acquire iron(III), particularly in environments in which the iron is dominantly complexed by other organic ligands, we report herein on the coordination properties of several representative marine siderophores.
Materials and Methods
Bacteria
M. hydrocarbonoclasticus was maintained and grown as previously described, 25 while Marinobacter strain DS40M6, and Halomonas aquamarina strain DS40M3 10, 33 were maintained in marine broth 2216 (Difco Laboratories, Detroit, Mich.) and kept at −80°C 34 for long term storage. For bench cultures, the maintenance medium consisted of natural sea water obtained from the UCSB central sea water collection system, aged 1–3 months in the dark at 4°C before use, 1.5% Bacto-agar, 5 g/l Bacto-peptone and 1 g/l yeast extracted (Difco Laboratories). For siderophore production, DS40M6 and DS40M3 were shaken aerobically at room temperature on a rotary shaker (New Brunswick) at 200 rpm in a low-iron synthetic medium containing: 15 g/l NaCl, 0.75 g/l KCl, 0.4 g/l MgSO4·7H2O, 1.0 g/l NH4Cl, 0.15 g/l CaCl2·2H2O, and 5 g/l sodium succinate. The pH was adjusted to the desired 3 g/l K2HPO4., value with phosphoric acid. The iron concentration in the media was measured to be 0.1–0.2 ppm by atomic absorption spectroscopy.
Siderophore Isolation
The aquachelins, marinobactins and petrobactins were isolated and purified as previously described.10, 25
Potentiometric, NMR and Spectrophotometric Titrations
Standard carbonate-free solutions of KOH were prepared from Baker “Dilut-It” ampoules using boiled, purified water (i.e., 18 MΩ resistance; Nanopure) and were stored under Ascarite™-scrubbed argon. Base solutions were standardized with KHP to the phenolthalein end point. The absence of carbonate (< 2%) was confirmed by Gran’s plots 35. Iron solutions were prepared from Fe(NO3)3·9H2O in 0.1M HNO3 and the exact iron concentration determined by EDTA titration with Variamine Blue as an indicator.18 Excess acid in the iron solution was determined by passing a aliquot through a well washed sample of the acid form of AG 50W-X8 cation exchange resin (Bio-Rad) and titrating the liberated acid. The excess acid was the difference between the total acid and three times the known iron concentration.
Spectrophotometric and potentiometric titrations were performed in jacketed three necked titration vessels connected to a constant temperature water bath and held at 25.0(1)°C. Hydrogen ion concentration was measured using a Radiometer PHM240 pH meter with a pHC4406 combination electrode which was standardized with a three buffer sequence and corrected (as needed) to read the negative log of the hydrogen ion concentration directly using dilute HNO3 solutions.18 Titrant was added to the cell, which was kept under a blanket of Ascarite scrubbed argon gas, with a Gilmont microburet. Ligand protonation constants were determined from the nonlinear refinement of the potentiometric titration data using the programs BEST or PKAS developed by Martell and Motekaitis.36 Spectrophotometric titration data were analyzed either graphically using the Schwarzenbach equation or via nonlinear least squares refinement using the program SPECFIT ™.
Proton NMR titrations were conducted at 500 MHz using 12–35 mg of siderophore in 700 μl D2O on a Varian Inova spectrometer. The data were processed with a baseline correction and exponential multiplication prior to Fourier transformation and all chemical shifts were reported relative to an internal standard of DSS (0.00 ppm, at 25°C). The pH was adjusted using NaOD (2.0 M) as a titrant and meter readings in D2O were corrected by adding 0.44 to obtain values of pD.37 Protonation constants were determined by fitting the chemical shift values vs. pH by nonlinear least squares refinement. To facilitate comparison to the potentiometric results, the NMR data was corrected to 0.1 M ionic strength using the Davies equation.38
EDTA Competition Experiments
The low pH obtained upon mixing Fe(III) with a solution of any of the siderophores indicates that a considerable degree of chelate formation occurs prior to the addition of any base. Since no significant fraction of free metal is present, it is not possible to obtain the overall formation constant from titration data directly. Therefore an EDTA competition method was used to obtain the desired formation constants. Solutions for the EDTA competition measurements were prepared by adding a known quantity of iron stock to a 50 mM HEPES (pH 7.4) or MES (pH 6.0) buffer containing 0.1 M KNO3, a constant amount of ligand and varying quantities of EDTA in excess and allowing them to come to equilibrium. The attainment of equilibrium was monitored by optical spectroscopy and appeared to be relatively rapid but samples were left for 1 week as a precaution. The concentration of iron siderophore complex was measured by optical spectroscopy using the known extinction coefficients of the Fe-siderophores and EDTA. Data were analyzed both manually and via the program SPECFIT.
Results
Marinobactins
Ligand Protonation Equilibria
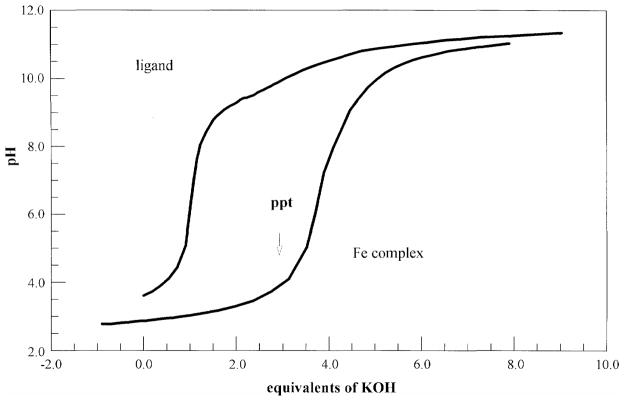
Ligand protonation constants were determined from the nonlinear refinement of the potentiometric titration data (Figure 2 for Marinobactin E) to give pKa values of 3.85(4), 8.89(2), and 9.52(4). These pKas correspond to the terminal carboxylic acid and the two hydroxamic acid groups respectively (Table 1). An additional deprotonation for the β-hydroxyaspartyl proton was also indicated but as it averaged 12.0(6), it is not well defined by the potentiometric titration data.
Figure 2.
Potentiometric Titration of Marinobactin E (0.515 mM in 0.1 M KNO3) with KOH before and after addition of 1 equivalent of Fe(III).
Table 1.
Comparison of the 13C resonances of apo-marinobactin C and Ga(III)-marinobactin C
| CO (ppm) | Cα (ppm) | Cβ (ppm) | Cγ(ppm) | Cδ (ppm) | Other (ppm) | ||
|---|---|---|---|---|---|---|---|
| OAc-OH-L-Orn | Apo-MC | 173.5 | 51.7 | 22.9 | 29.0 | 46.7 | 170.4, 20.4 |
| Ga(III)-MC | 173.0 | 51.6 | 23.5 | 28.7 | 50.5 | 160.7, 16.4 | |
| L-Ser | Apo-MC | 169.8 | 54.9 | 61.9 | |||
| Ga(III)-MC | 169.6 | 56.6 | 61.0 | ||||
| OAc-OH-D-Orn | Apo-MC | 171.5 | 52.3 | 22.9 | 29.0 | 46.7 | 170.4, 20.4 |
| Ga(III)-MC | 171.4 | 51.9 | 23.0 | 28.7 | 50.0 | 160.7, 16.4 | |
| D-Ser | Apo-MC | 169.5 | 55.3 | 61.9 | |||
| Ga(III)-MC | 169.6 | 54.8 | 61.9 | ||||
| L-DABA | Apo-MC | 168.9 | 50.8 | 21.5 | 36.5 | ||
| Ga(III)-MC | 168.8 | 50.7 | 21.5 | 36,4 | |||
| D-threo-β-OH-Asp | Apo-MC | 162.0 | 53.1 | 70.5 | 162.0 | ||
| Ga(III)-MC | 161.9 | 53.0 | 70.5 | 161.3 |
The 13C chemical shifts in bold show a CIS of at least 3 ppm in the Ga(III) complex compared to apo-marinobactin C. The13C chemical shifts in italics are carbons which shift 0.5 to 1 ppm in the Ga(III) complex compared to apo-marinobactin C.
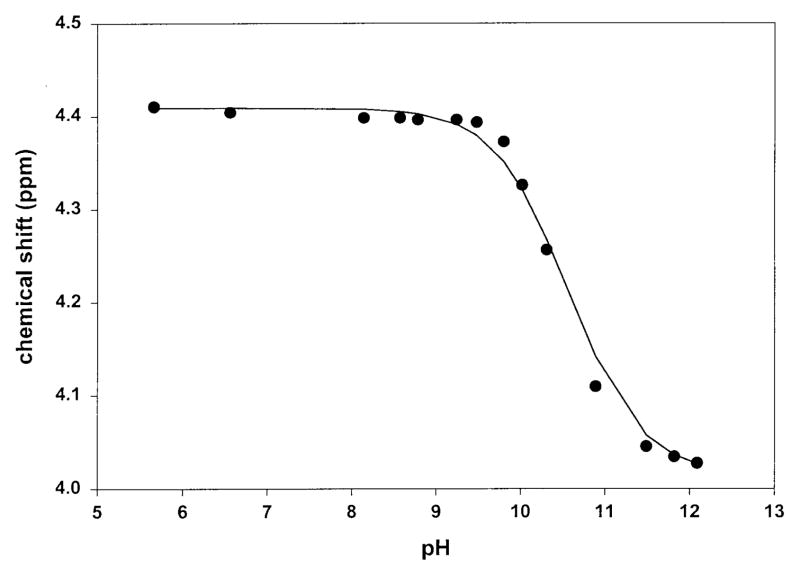
Because the pKa of the hydroxyl group of the β-hydroxyaspartyl moiety is important to the determination of the overall formation constant, an NMR titration was chosen as an alternate approach. Deprotonation of each hydroxamate group of marinobactin B was easily monitored by NMR using either the acetyl methyl or the δ proton resonances which are closest to the titrating groups and produced the largest chemical shift differences. Somewhat surprisingly however the α and β protons of the β-hydroxyaspartyl moiety were not the most sensitive to the titration of this group; rather the DABA protons on the opposite side of the nine-membered ring were most strongly affected. Nevertheless similar values for the pKa of the β-hydroxyaspartyl amide group were determined by monitoring any of the protons contained in the nine-membered ring. The determined pKa values for the hydroxamic acids were 9.67 and 8.76, in reasonable agreement with the potentiometric results for the related marinobactin E, 9.52 and 8.89. The pKa obtained for the β-hydroxyaspartyl hydroxyl group was 10.8 (Figure 3) which is comparable to the pKa of the hydroxyl proton in citric acid, pKa ~11.6, or in the citric acid groups of the siderophore rhizoferrin, pKa ~10.7.39
Figure 3.
Determination of the pKa of the β-hydroxyaspartic acid moiety of Marinobactin B via NMR titration.
Metal-Ligand Equilibria
The potentiometric titration curve for an equimolar solution of marinobactin E and Fe(III) is shown in Figure 2. Below pH 7 four protons are released upon iron(III) coordination, indicating that in addition to the three readily titratable protons on the ligand (i.e., two hydroxamic acids and the terminal carboxylic acid), an additional proton, almost certainly from the β-hydroxyaspartyl group, is also released. In addition, below about pH 3.7, where one proton has been added to the fully deprotonated Fe(III)-marinobactin-E complex, precipitation of a neutral iron(III)-siderophore complex occurs. More detailed analysis (i.e. nonlinear least squares refinement) of the data was frustrated by two features of this system. The first is that the system was very slow to equilibrate and yield stable pH values. This phenomenon was exacerbated by the higher concentrations needed for reasonable accuracy. This problem appears to be related to the surfactant-like qualities of these siderophores and their tendency to aggregate and form micelles and other assemblies.10, 20 The second is that the high salt concentration needed to control the ionic strength increased the pH at which a neutral iron-siderophore complex began to precipitate. Therefore some of the pH instability could also be related to partial precipitation. In any event, the lack of any free metal at equilibrium under conditions accessible without precipitation precluded refinement of the overall formation constant.
Some of the pertinent metal-ligand equilibria could be obtained spectrophotometrically but only by working at zero ionic strength and allowing significant time for equilibration between pH changes. Starting at high pH, where the Fe(III)-marinobactin-E is completely soluble, and lowering the pH from 10.8 to 8.0 brought about small changes in the optical spectrum over which an isosbestic point is maintained. This data could be treated via a Schwarzenbach analysis where generally:
| (1) |
with Aobsd the measured absorbance, AML the absorbance arising from the unprotonated complex, AMHL that arising from the protonated complex, KMHL the protonation constant, Hn the concentration of hydrogen ions and n the number of protons involved. Here we treat the system as a protonation of the hydrolyzediron siderophore complex proposed to be present at high pH and designated FeLOH2− in eqn 2 which yields a log K value of 9.6(3).
| (2) |
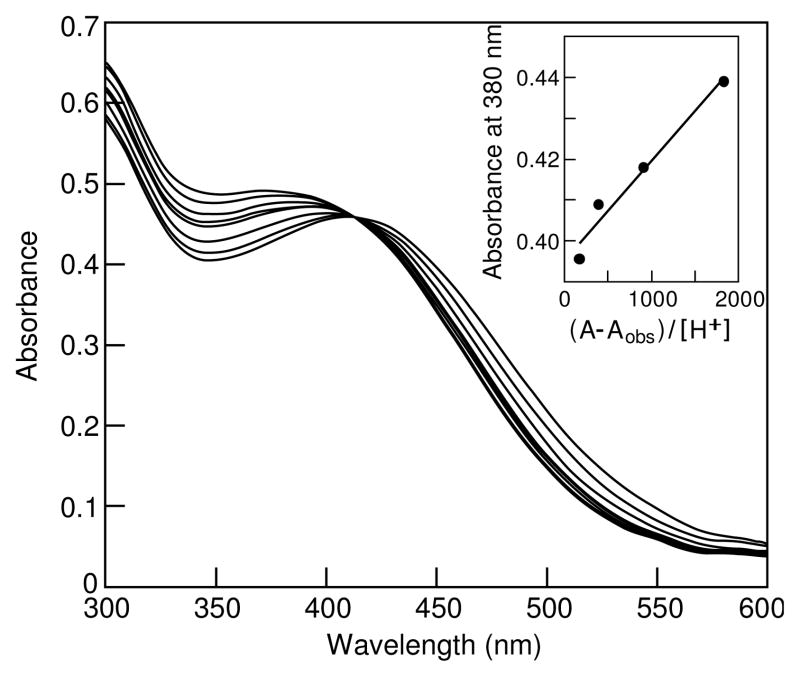
Over the range from pH 6 to 3.7 further spectral changes occur with λmax shifting from 400 to 420 nm with a new isosbestic point indicating only two absorbing species in solution (Figure 4).
Figure 4.
UV-vis spectra of Fe(III)-marinobactin E as a function of pH (μ = 0 M, T = 25°C). Inset: Schwarzenbach plot for the lower pH transition (pH 6 to 3.7).
| (3) |
This data was again treated via Schwarzenbach analysis (Figure 4 inset) and a linear plot is obtained only for n=1 which yields a log KMHL = 4.63(5) for the equilibrium shown in eqn 3. This addition of a single proton to the anionic FeL− complex provides a plausible explanation for the precipitation of a complex below a pH of 3.7 since the neutral FeHL species, containing as it does, a long hydrophobic tail, is expected to be only sparingly soluble.
EDTA Competition
Using a 2–10 fold excess of EDTA over siderophore at pH 6.0 it is possible to set up a measurable competition for Fe(III) between the two ligands. The measured equilibrium constant, Km, of 1.01(12) represents the reaction shown in equation 4.
| (4) |
where siderophore and EDTA represent the ligands in all their protonated forms. The conditional or pH dependent formation constant for the iron siderophore is then given by equation 5.
| (5) |
where K*FeEDTA = KFeEDTA ·αedta, the pKa values and overall pH independent formation constant for EDTA being already known.36 While this is a valid stability constant under the conditions specified, it is difficult to compare to the standard pH independent formation constants which are written in terms of the fully deprotonated ligands. To obtain the pH independent formation constant it is necessary to correct the free siderophore concentration to that of the fully deprotonated form using the appropriate α function. This calculation in turn requires knowledge of all of the protonation constants for the respective ligand. Thus using the four required pKa constants presented above, the overall formation constant, log KML, for Fe(III)-marinobactin-E is determined to be 31.80(5) (Table 3).
Table 3.
Overall Ferric-Siderophore Formation Constants and Metal-Ligand Protonation Constants for some selected Siderophores
| Siderophore | log KML | log KMHL | log KMH2L | log KMH3L | log KMH-1L |
|---|---|---|---|---|---|
| Aquachelin Ca | 31.3 | 5.5(1) | nd | ||
| Marinobactin Ea | 31.80(5) | 4.63(5) | nd | 9.6(3) | |
| Petrobactina | 43(4) | 10.1(1) | 7.81(11) | 6.89(18) | |
| Aerobactin 42 | 27.6(1) | 4.58(8) | 3.62(7) | ||
| Rhizoferrin 39 | 25.3 | 5.5(2) | 4.3(1) | ||
| Ferrioxamine B43, 44 | 30.6 | ||||
| Enterobactin 45, 46 | 49 | 4.89(6) | 3.15 | ||
| Alterobactin A47, 48 | 51(2) |
. this work
Metal Ligand Coordination
Spectrophotometric titration at 420 nm of apo-marinobactin E at near neutral pH (7.4; HEPES buffer) with Fe(III) showed a clean break at 1:1 iron(III)/siderophore stoichiometry. The extinction coefficient of 2000 M−1cm−1 is consistent with dihydroxamate coordination while the blue shifted absorption maximum suggests additional anionic coordination (presumably through the β-hydroxyaspartate) In addition the ESI-MS showed a major peak cluster at m/z of 1041 amu, consistent with a 1:1 Fe(III)-marinobactin E complex. Although the data presented thus far are consistent with a structure where Fe(III) is coordinated to the two hydroxamate groups and both the hydroxyl and carbonyl groups of the β-hydroxyaspartyl amide group, detailed evaluation requires a single crystal X-ray diffraction study. In the absence of suitable single crystals we have utilized NMR spectroscopy as an alternative tool. Although NMR spectroscopy of the paramagnetic Fe(III) complex itself is precluded, data can be obtained for the Ga(III) analog. Gallium(III) is widely used as a structural probe for Fe(III) since it has approximately the same size and charge but is diamagnetic. ESI-MS confirms that Ga(III) also binds to the marinobactins with the same 1:1 stoichiometry as Fe(III) (i.e., m/z of 1025 and 1028 in a 3:2 ratio reflecting the relative abundance of 69Ga and 71Ga coordinated to marinobactin C).
The NMR spectra of the Ga(III) complexes of the marinobactins indicate a number of changes with respect to the free ligand. Most revealing are the 3.3–9.7 ppm coordination induced shifts (CIS) in the resonances for the carbons around the N-hydroxy-N-acetyl groups of the hydroxamates upon Ga(III) coordination (Table 1). The magnitudes of these shifts are similar to those seen with other siderophores 39 and indicate that the hydroxamate groups are coordinated to Ga(III). Of particular note is the lack of significant CIS for the carbons of the β-hydroxyaspartyl amide (i.e., a difference of only 0.7 ppm for Cγ and 0.0 ppm for Cβ). Thus unlike with Fe(III), the hydroxy carboxyamide moiety does not appear to be coordinated to Ga(III) under the experimental conditions. A similar situation has been reported for the Ga(III) complex of the citrate-containing siderophore rhizoferrin.39
Raising the pH of Ga(III)-marinobactin-C from 7 to 9 caused no change in the resonance for Cβ, however at pH 11 it shifted to 72.3 ppm and at pH 12 it shifted to 73.0 ppm. These shifts probably correspond to the deprotonation of the hydroxyl group bound to Cβ in the free ligand and confirm that it is not deprotonated in the Ga(III) complex at physiological pH. In addition, no evidence for coordination of Ga(III) to the β-hydroxyaspartate group could be derived from nOe data (data not shown 40).
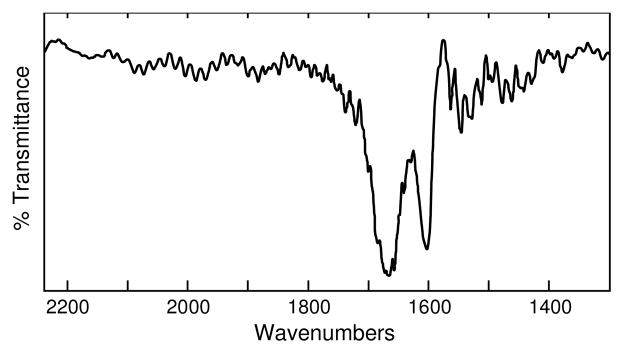
Final support for the difference in coordination between Ga(III) and Fe(III) comes from IR spectroscopy on marinobactin C, and its Ga(III) and Fe(III) complexes. The IR peak at 1609 cm−1 in both Ga(III)-marinobactin-C and apo marinobactin C is downshifted to 1581 cm−1 in the Fe(III) complex (Supplementary Information Figure S1). This peak is assigned as the C=O stretch within the β-hydroxyaspartate moiety. The difference spectrum between Ga(III)-marinobactin-C and Fe(III)-marinobactin-C (Figure 5) shows that the Ga(III) and Fe(III) complexes differ in the 1600–1700 cm−1 region, and indicates that the β-hydroxyaspartate moiety is bound to Fe(III) but not to Ga(III). Thus, contrary to what has been widely assumed, Ga(III) is not always an ideal structural model for iron coordination to siderophores.
Figure 5.
IR difference spectrum between Ga(III)-marinobactin-C and Fe(III)-marinobactin-C.
Aquachelins
The potentiometric titration curve for aquachelin C shows a break at three equivalents base/mole ligand which represents the titration of the two free terminal carboxylates and the presence of one equivalent of TFA thought to be retained from the HPLC purification. The presence of the stoichiometric amount of TFA was confirmed by 19F NMR. Titration of the hydroxamic acid groups occurs above pH 8. Ligand protonation constants were again determined from the nonlinear refinement of the data and the evaluated constants were 3.32(4), 3.79 (10), 8.73(7), and 9.52(20) which represent the β-hydroxyaspartic acid, the C-terminal carboxylic acid and the two hydroxamic acid groups respectively. An additional deprotonation for the β-hydroxyaspartate hydroxyl group was not observed over the pH range studied.
Although the β-hydroxyaspartate hydroxyl is thought to be involved in iron coordination by these ligands and its pKa is therefore important to the determination of the overall formation constant, it could not be determined from the potentiometric data. NMR titration was again chosen as an alternate approach however, unlike the situation in the structurally similar marinobactin series, it failed to reveal the pKa of this group as the protons for the β-hydroxyaspartate group itself were either buried under the D2O resonance or were in a very crowded area of the spectrum precluding their use as titration markers.
The potentiometric titration curve for an equimolar solution of aquachelin C and Fe(III) was not very informative for the same reasons as described for the related marinobactins and thus we used the standard EDTA petrobactin method to obtain the overall Fe(III)-aquachelin-C formation constant. Using a 2–10 fold excess of EDTA over siderophore at pH 6.0, it is possible to set up a measurable competition for Fe(III) between aquachelin and EDTA. The measured equilibrium constant, Km, of 1.47(5) represents the reaction shown in eqn 4. The conditional or pH dependent formation constant for the iron siderophore is then given by eqn 5 where log K*Fesid = 20.30. Again while this is a valid stability constant under the conditions specified, it is difficult to compare to the standard pH-independent formation constants which are written in terms of the fully deprotonated ligands. Since only four of the five required constants have been measured for aquachelin C we have estimated the pKa for the β-hydroxyaspartate hydroxyl group as being near 10.8 based on the value obtained for the hydroxyl proton in the closely related marinobactin E. Given this estimate, the overall formation constant of log KML for aquachelin C is calculated to be 31.3.
Spectrophotometric titrations under certain conditions also allow for quantitation of one of the pertinent metal-ligand protonation equilibria but again only by working at zero ionic strength and allowing for significant time for equilibration between pH changes. Over the range from pH 7 to 3 very small spectral changes occur with an isosbestic point indicating only two absorbing species in solution. This could be treated as a single protonation equilibrium between FeL and FeHL using a standard Schwarzenbach analysis (eqn 1). A linear plot is obtained only for n = 1 and gives log KMHL of 5.50(10).
Petrobactin
There are eight potentially dissociable protons on petrobactin (PB), two phenolic protons from each of the two catechol groups, two secondary amines, and two from the central citrate moiety. Six of these are expected to be displaced upon Fe(III) coordination to satisfy the octahedral six coordination preference for Fe(III). However, the observed potentiometric titration of petrobactin itself shows the dissociation of only three protons, with successive pKa values of 9.77, 7.95, and 3.13. The pKa value of 3.13 can be easily assigned to the central carboxylic acid group. It is more difficult to assign the higher pKa values to specific functional groups, since the intrinsic pKa values of secondary amines, the catechol groups and the citrate hydroxyl overlap. However, it is not necessary to assign the macroscopic pKa values to specific functional groups in order to measure the Fe(III)-PB stability constants.
Given the expected strong binding of Fe(III) to PB, direct measurement of the overall M-L binding constant was precluded, so again we utilized an indirect competition method to determine the ferric affinity constant. Using a 2–10 fold excess of EDTA over petrobactin at pH 7.4, it is possible to set up a measurable competition of Fe(III) between the two ligands. The measured equilibrium constant, Km, of 6.8(3) for PB represents the reaction shown in eqn 4. The conditional or pH-dependent formation constant for Fe(III)-PB is then given by the corresponding version of eqn 5 with a value for log K*FePB= 22.1(2) at pH 7.4. While it is difficult to compare the overall formation constant of iron chelators to one another due to differences in ligand pKa’s and/or stoichiometry, the “pM” value has been proposed as a means for more direct comparison. The pM values express the amount of “free iron” present at equilibrium under particular sets of experimental conditions, typically at a total ligand concentration of 10−5 M, a total iron concentration of 10−6 M, and a pH of 7.4. The pM value calculated from our conditional stability constant for PB is 23.1. The calculation of pM from the conditional constant is in good agreement with that determined by Raymond et al (23.0) using a more direct method.41 To obtain the standard pH-independent formation constant, which is written in terms of the fully deprotonated ligand states, it is again necessary to correct the free siderophore concentration to that of the fully deprotonated form using the appropriate α function. Since we can only measure pKa values for the loss of three protons from fully protonated H8PB2+, it is necessary to estimate five unknown protonation constants (i.e., for two catecholate, two secondary nitrogen and the citrate hydroxyl groups). This makes the overall stability constant calculated here subject to considerable error. Nevertheless using estimated values of 12.0 for the two highest catecholate proton dissociations, 11.0 for the citrate hydroxyl and 10.0 for each of the two secondary nitrogens, we arrive at an overall stability constant, log KML, for Fe(III)-PB of ca. 43(4).
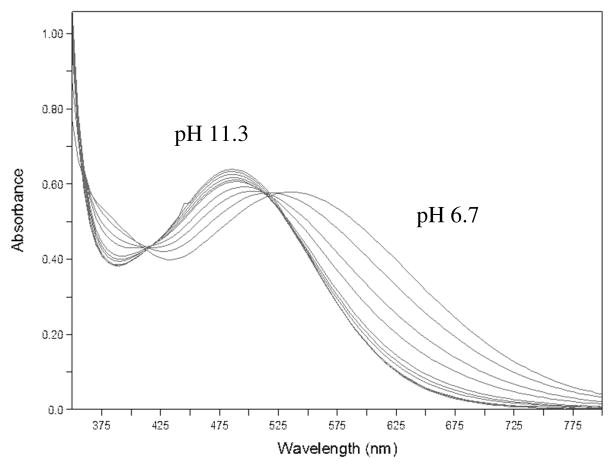
Spectrophotometric titrations could be used for quantitation of several of the pH dependent metal-ligand protonation equilibria observed. Starting at pH 11.3 where the iron siderophore complex is completely soluble and lowering the pH to 6.7 brought about changes in the optical spectrum with a shift in max from around 485 to 520 nm. Over part of that range an isosbestic point is maintained (Figure 6). This regime can be treated as a single proton equilibrium between FeHL2− and FeH2L− giving a value for log KMH2L of 7.65(10). Attempting to lower the pH below 6.2 results in the formation of a purple-blue precipitate and loss of any isosbestic points, thus precluding Schwarzenbach analysis of any further protonation equilibria. However the entire data set can be fit to a three proton model using the program SPECFIT. The SPECFIT model gives protonation constants of 10.1(1), 7.81(11) and 6.89(18) for logK1–3.
Figure 6.
Spectrophotometric titration of Fe-petrobactin from pH 11.3 to 6.7 (Calculated spectra and species distribution diagram based on the global SPECFIT model derived from this data can be found in Supplementary Information, Figures S2 and S3).
Discussion
The ligand protonation constants determined for the marine siderophores in this study (Table 2) correlate well with those of other siderophores containing a citrate-like hydroxyl acid core such as those of the related dihydroxamate aerobactin and rhizoferrin siderophores.
Table 2.
Ligand Protonation Constants
| siderophore | α-COOH of citrate or β–hydroxy Asp | COOH | N-OH | N-OH | α-OH of β–hydroxy Asp | * | * |
|---|---|---|---|---|---|---|---|
| Aquachelin C | 3.32(4) | 3.79(10) | 8.73(7) | 9.52(20) | |||
| Marinobactin E | 3.85(4) | 8.89(2) | 9.52(4) | 10.84 | |||
| Marinobactin D | 3.75(2) | 8.47(15) | 9.40(5) | ||||
| Petrobactin | 3.13 | 7.95 | 9.77 |
macroscopic protonation sites not defined
The overall ferric-siderophore formation constants of 1033.8 for marinobactin E and 1033.4 for aquachelin C are very similar to each other and in the range observed for tris-hydroxamate siderophores such as the ferrioxamines and ferrichromes.40 Although Fe(III)-marinobactin E and aquachelin C contain only two hydroxamate groups, the β-hydroxyaspartate is a functionally similar bidentate ligand, with a pKa of near 10.8. Data from optical spectroscopy, NMR, IR, and the fact that four protons are liberated upon Fe(III) coordination to marinobactin E (and by analogy aquachelin C), strongly suggests that β-hydroxyaspartate coordinates to Fe(III) as a bidentate ligand in the fully deprotonated FeL complex. The only realistic alternative is that the “extra” proton released in the formation of the species designated FeL comes from the deprotonation of a coordinated water molecule to produce a monohydroxo complex. A widely used correlation between the magnitude of the overall formation constant and the magnitude of any hydrolysis constant suggests that the first protonation constants of 4.63 or 5.5 are much too low to be assigned to simple hydrolysis.42 On the other hand the constant we have assigned as the hydrolysis of Fe(III)-marinobactin E, which occurs only above pH 9, has a value exactly as expected given the high overall stability constant. In addition, all the known siderophores in which a citrate hydroxyl group has been implicated as an iron ligand, such as aerobactin (4.6), and rhizoferrin (5.5) among others, show first protonation constants in the same range as Fe(III)-marinobactin E and Fe(III)-aquachelin C suggesting similar coordination.
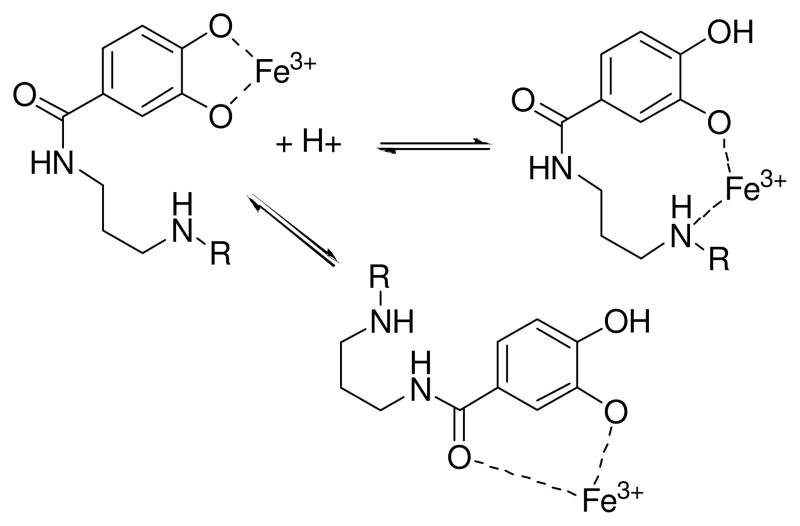
The protonation equilibria for Fe(III)-PB are more difficult to assign. The initial protonation, with a pKa of 10.1 and which results in only very small spectral changes, is reasonably assigned as the protonation of one of the uncoordinated secondary amines. The second protonation (pKa 7.81) results in major spectral changes precluding assigning it to protonation of the remaining secondary amine. In many tris-catecholate systems the first three metal ligand protonation constants typically correspond to the successive protonation of each of the three most basic (meta) catecholate oxygens to form a neutral FeH3L complex.46 This results in a conversion from a tris-catecholate type coordination to a “tris-salicylate” mode (Figure 7).49 However such “tris-salicylate” coordination would seem to be less likely for petrobactin since it contains the 3,4 rather than the 2,3-dihydroxybenzoyl unit resulting in a 7-membered chelate ring rather than the more favored 5-membered ring found with the latter. An alternate possibility is that the addition of a second proton to the FeHPB complex causes a rearrangement to a species where the coordination mode shifts from bis-catecholate to a mixed amino-phenol type coordination (Figure 7). However the exact nature of this or the third protonation (pKa 6.89) remain speculative and requires further investigation. What is clear however is that the stepwise addition of three protons to the completely deprotonated Fe(III)PB3− anion results in a purple colored neutral species that precipitates from solution, phenomenologically similar to what is seen for many triscatecholato siderophores or their analogs.49
Figure 7.
Proposed changes in coordination of iron to petrobactin upon protonation. Only partial iron coordination to one of the 3,4-catecholate groups is shown for clarity.
Although the marinobactins and aquachelins contain Fe(III) chelating groups similar to their terrestrial analogs, clearly they also have unique structural features. The presence of fatty acid tails of variable chain length (both saturated and unsaturated) in these marine systems sees its only analogy with terrestrial siderophores in the mycobactins and carboxymycobactins expressed by mycobacteria.50, 51 Many pathogenic mycobacteria produce both lipophilic membrane-bound siderophores known as mycobactins, which are completely water-insoluble, and a similar set of more hydrophilic siderophores excreted into the environment called carboxymycobactins. The only difference between the carboxymycobactins and the mycobactins is a shortening of the lipophilic tail attached to the lone hydroxamate group from a range of C-16 to C-19 to a range of C-1 to C-7, and the termination of that shorter fatty acid with a more polar group such as an ester or carboxylate. In this regard the marinobactins and aquachelins more closely resemble the mycobactins. It has been demonstrated that the water-soluble carboxymycobactins can deliver iron from the media to the membrane-bound mycobactins that in turn internalizes the iron for use. With the recent discovery of the membrane-bound marinobactin F,13 experiments can now be carried out to investigate Fe(III) transfer between the marinobactins or with other families of amphiphilic siderophores.
Supplementary Material
Acknowledgments
We are grateful for support from NIH GM38130 (AB) and NOAA Grant NA04OAR4170038, California Sea Grant College Program Project # R/CZ-198, through NOAA’s National Sea Grant College Program, U.S. Dept. of Commerce (CJC & FCK). We also thank Prof. Margo Haygood (Oregon Health Science University) for continuing collaboration on iron and Prof. Wes Harris (University of Missouri, St. Louis) for valuable discussions.
Footnotes
Supporting Information Available: Comparison of IR spectra of apo-marinobactin C, Ga(III)-marinobactin C and Fe(III)-marinobactin C; Species distribution diagram for Fe(III)-petrobactin between pH 6.7–11.3; and Calculated spectra from the spectrophotometric titration for the different protonated states of Fe-petrobactin from pH 11.3 to 6.7.
References
- 1.Martin JH, Gordon RM, Fitzwater SE. Limnol and Oceanogr. 1991;36:1793–1802. [Google Scholar]
- 2.Martin JH, Coale KH, Johnson KS, Fitzwater SE, Gordon RM, Tanner SJ, Hunter CN, Elrod VA, Nowicki JL, Coley TL, Barber RT, Lindley S, Watson AJ, Vanscoy K, Law CS, Liddicoat MI, Ling R, Stanton T, Stockel J, Collins C, Anderson A, Bidigare R, Ondrusek M, Latasa M, Millero FJ, Lee K, Yao W, Zhang JZ, Friederich G, Sakamoto C, Chavez F, Buck K, Kolber Z, Greene R, Falkowski P, Chisholm SW, Hoge F, Swift R, Yungel J, Turner S, Nightingale P, Hatton A, Liss P, Tindale NW. Nature. 1994;371:123–129. [Google Scholar]
- 3.Martin JH, Fitzwater SE. Nature. 1988;331:341–343. [Google Scholar]
- 4.Coale KH, Johnson KS, Fitzwater SE, Gordon RM, Tanner S, Chavez FP, Ferioli L, Sakamoto C, Rogers P, Millero F, Steinberg P, Nightingale P, Cooper D, Cochlan WP, Landry MR, Constantinou J, Rollwagen G, Trasvina A, Kudela R. Nature. 1996;383:495–501. doi: 10.1038/383495a0. [DOI] [PubMed] [Google Scholar]
- 5.Tortell PD, Maldonado MT, Price NM. Nature. 1996;383:330–332. [Google Scholar]
- 6.Gledhill M, van den Berg CMG. Mar Chem. 1994;47:41–54. [Google Scholar]
- 7.Rue EL, Bruland KW. Limnol and Oceanogr. 1997;42:901–910. [Google Scholar]
- 8.Wu JF, Luther GW. Limnol and Oceanogr. 1994;39:1119–1129. [Google Scholar]
- 9.Bruland KW, Donat JR, Hutchins DA. Limnol and Oceanogr. 1991;36:1555–1577. [Google Scholar]
- 10.Martinez JS, Zhang GP, Holt PD, Jung HT, Carrano CJ, Haygood MG, Butler A. Science. 2000;287:1245–1247. doi: 10.1126/science.287.5456.1245. [DOI] [PubMed] [Google Scholar]
- 11.Martin JD, Ito Y, Homann VV, Haygood MG, Butler A. J f Biol Inorg Chem. 2006;11:633–641. doi: 10.1007/s00775-006-0112-y. [DOI] [PubMed] [Google Scholar]
- 12.Martinez JS, Carter-Franklin JN, Mann EL, Martin JD, Haygood MG, Butler A. P Nat l Acad Sci USA. 2003;100:3754–3759. doi: 10.1073/pnas.0637444100. [DOI] [PMC free article] [PubMed] [Google Scholar]
- 13.Martinez JS, Butler A. J Inorg Biochem. 2007;101:1692–1698. doi: 10.1016/j.jinorgbio.2007.07.007. [DOI] [PMC free article] [PubMed] [Google Scholar]
- 14.Homann VV, Sandy M, Tincu JA, Templeton AS, Tebo BM, Butler A. J Nat l Prod. 2009;72:884–888. doi: 10.1021/np800640h. [DOI] [PMC free article] [PubMed] [Google Scholar]
- 15.Barbeau K, Rue EL, Bruland KW, Butler A. Nature. 2001;413:409–413. doi: 10.1038/35096545. [DOI] [PubMed] [Google Scholar]
- 16.Barbeau K, Rue EL, Trick CG, Bruland KT, Butler A. Limnol and Oceanogr. 2003;48:1069–1078. [Google Scholar]
- 17.Barbeau K, Zhang GP, Live DH, Butler A. J Amer Chem Soc. 2002;124:378–379. doi: 10.1021/ja0119088. [DOI] [PubMed] [Google Scholar]
- 18.Küpper FC, Carrano CJ, Kuhn JU, Butler A. Inorg Chem. 2006;45:6028–6033. doi: 10.1021/ic0604967. [DOI] [PubMed] [Google Scholar]
- 19.Butler A. BioMetals. 2005;18:369–374. doi: 10.1007/s10534-005-3711-0. [DOI] [PubMed] [Google Scholar]
- 20.Owen T, Pynn R, Martinez JS, Butler A. Langmuir. 2005;21:12109–12114. doi: 10.1021/la0519352. [DOI] [PubMed] [Google Scholar]
- 21.Owen T, Pynn R, Hammouda B, Butler A. Langmuir. 2007;23:9393–9400. doi: 10.1021/la700671p. [DOI] [PubMed] [Google Scholar]
- 22.Owen T, Webb SM, Butler A. Langmuir. 2008;24:4999–5002. doi: 10.1021/la703833v. [DOI] [PMC free article] [PubMed] [Google Scholar]
- 23.Xu GF, Martinez JS, Groves JT, Butler A. J Am Chem Soc. 2002;124:13408–13415. doi: 10.1021/ja026768w. [DOI] [PubMed] [Google Scholar]
- 24.Bergeron RJ, Huang GF, Smith RE, Bharti N, McManis JS, Butler A. Tetrahedron. 2003;59:2007–2014. [Google Scholar]
- 25.Hickford SJH, Küpper FC, Zhang GP, Carrano CJ, Blunt JW, Butler A. J Natl Prod. 2004;67:1897–1899. doi: 10.1021/np049823i. [DOI] [PubMed] [Google Scholar]
- 26.Homann VV, Edwards KJ, Webb EA, Butler A. Biometals. 2009;22:565–571. doi: 10.1007/s10534-009-9237-0. [DOI] [PMC free article] [PubMed] [Google Scholar]
- 27.Liu HC, Hakansson K, Lee JY, Sherman DH. J Am Soc Mass Spectrom. 2007;18:842–849. doi: 10.1016/j.jasms.2007.01.005. [DOI] [PubMed] [Google Scholar]
- 28.Pfleger BF, Lee JY, Somu RV, Aldrich CC, Hanna PC, Sherman DH. Biochem. 2007;46:4147–4157. doi: 10.1021/bi6023995. [DOI] [PubMed] [Google Scholar]
- 29.Lee JY, Janes BK, Passalacqua KD, Pfleger BF, Bergman NH, Liu HC, Hakansson K, Somu RV, Aldrich CC, Cendrowski S, Hanna PC, Sherman DH. J Bacteriol. 2007;189:1698–1710. doi: 10.1128/JB.01526-06. [DOI] [PMC free article] [PubMed] [Google Scholar]
- 30.Abergel RJ, Wilson MK, Arceneaux JEL, Hoette TM, Strong RK, Byers BR, Raymond KN. P Natl Acad Sci UCA. 2006;103:18499–18503. doi: 10.1073/pnas.0607055103. [DOI] [PMC free article] [PubMed] [Google Scholar]
- 31.Wilson MK, Abergel RJ, Raymond KN, Arceneaux JEL, Byers BR. Biochem Biophys Res Communic. 2006;348:320–325. doi: 10.1016/j.bbrc.2006.07.055. [DOI] [PubMed] [Google Scholar]
- 32.Koppisch AT, Browder CC, Moe AL, Shelley JT, Kinke BA, Hersman LE, Iyer S, Ruggiero CE. Biometals. 2005;18:577–585. doi: 10.1007/s10534-005-1782-6. [DOI] [PubMed] [Google Scholar]
- 33.Haygood MG, Holt PD, Butler A. Limnol and Oceanogr. 1993;38:1091–1097. [Google Scholar]
- 34.ZoBell CE. J Mar Res. 1941;4:42–75. [Google Scholar]
- 35.Gran G. Analyst. 1952;77:661–670. [Google Scholar]
- 36.Martell AE, Motekaitis RJ. The Determination and Use of Stability Constants. Wiley-VCH Inc; New York: 1992. [Google Scholar]
- 37.Krezel A, Bal W. J Inorg Biochem. 2004;98:161–166. doi: 10.1016/j.jinorgbio.2003.10.001. [DOI] [PubMed] [Google Scholar]
- 38.Perrin DD, Dempsey B. Buffers for pH and Metal Ion Control. Chapman and Hall; London: 1974. [Google Scholar]
- 39.Carrano CJ, Drechsel H, Kaiser D, Jung G, Matzanke B, Winkelmann G, Rochel N, AlbrechtGary AM. Inorg Chem. 1996;35:6429–6436. doi: 10.1021/ic960526d. [DOI] [PubMed] [Google Scholar]
- 40.Zhang GP. Dissertation. University of California; Santa Barbara: 1999. Marinobactins and petrobactins: Two new sets of siderophores from marine bacteria. [Google Scholar]
- 41.Abergel RJ, Zawadzka AM, Raymond KN. J Am Chem Soc. 2008;130:2124-+. doi: 10.1021/ja077202g. [DOI] [PubMed] [Google Scholar]
- 42.Harris WR, Carrano CJ, Raymond KN. J Am Chem Soc. 1979;101:2722–2727. [Google Scholar]
- 43.Cooper SR, McArdle JV, Raymond KN. Proc Natl Acad Sci USA. 1978;75:3551–3554. doi: 10.1073/pnas.75.8.3551. [DOI] [PMC free article] [PubMed] [Google Scholar]
- 44.Schwarzenbach G, Schwarzenbach K. Helv Chim Acta. 1963;46:1390–1400. [Google Scholar]
- 45.Loomis LD, Raymond KN. Inorg Chem. 1991;30:906–911. [Google Scholar]
- 46.Harris WR, Carrano CJ, Raymond KN. J Am Chem Soc. 1979;101:2213–2214. [Google Scholar]
- 47.Reid RT, Live DH, Faulkner DJ, Butler A. Nature. 1993;366:455–8. doi: 10.1038/366455a0. [DOI] [PubMed] [Google Scholar]
- 48.Lewis BL, Holt PD, Taylor SW, Wilhelm SW, Trick CG, Butler A, Luther GW. Mar Chem. 1995;50:179–188. [Google Scholar]
- 49.Pecoraro VL, Wong GB, Kent TA, Raymond KN. J Am Chem Soc. 1983;105:4617–4623. [Google Scholar]
- 50.Lane SJ, Marshall PS, Upton RJ, Ratledge C. Biometals. 1998;11:13–20. [Google Scholar]
- 51.Vergne AF, Walz AJ, Miller MJ. Natl Prod Reports. 2000;17:99–116. doi: 10.1039/a809397k. [DOI] [PubMed] [Google Scholar]
Associated Data
This section collects any data citations, data availability statements, or supplementary materials included in this article.


