

Abstract
A dual frequency excitation method for simultaneous translation and selective real-time imaging of microbubbles is presented. The method can distinguish signals originating from free flowing and static microbubbles. This method is implemented on a programmable scanner with a broadband linear array. The programmable interface allows for dynamic variations in the acoustic parameters and aperture attributes, enabling application of this method to large blood vessels located at varying depths. The performance of the method was evaluated in vitro (vessel diameter 2 mm) by quantifying the sensitivity of the method to various acoustic, microbubble, and fluid flow parameters. It was observed that the static microbubble response maximized at the approximate resonance frequency of the microbubble population (estimated from a coulter counter measurement), thus signifying the need for dual frequency excitation. The static microbubble signal declined from 25 to 12 dB with increasing centerline flow velocities (2.65-15.9 cm/s); indicating applicable range of flow velocities. The maximum intensity of the static microbubbles signal scaled with variations in the microbubble concentration. The rate of increment of static microbubble signal was independent of microbubble concentration. It was deduced that the rate of increment of the static microbubble signal is primarily a function of the pulse frequency, whereas the maximum static microbubble signal intensity is dependent on three parameters: a) the pulse frequency, b) the flow velocity, and c) the microbubble concentration. The proposed dual frequency sequence may enable application of radiation force for optimizing the effect of targeted imaging and modulating drug delivery in large blood vessels with high flow velocities.
Keywords: Dual frequency imaging, Radiation force, real-time imaging, arteries, arterial flows, microbubbles, drug delivery, targeted imaging
Introduction
Cardiovascular diseases are the leading cause of deaths in the developed world. Atherosclerosis is responsible for more than 60% of the deaths from cardiovascular diseases (Rosamond et al. 2008). Blood vessels such as coronary or carotid artery are at a greater risk of developing atherosclerosis, especially at bifurcations. Current techniques for characterizing atherosclerosis include: Intravascular Ultrasound (IVUS), angiography or their combination. Both IVUS and angiography are generally limited to detecting atherosclerosis at anatomic scale and are not sensitive enough to detect variations at molecular or cellular level
Phenotype changes in a diseased tissue are preceded by structural and functional changes that take place at a cellular level. These alterations at a cellular level precede the macroscopic manifestation of the pathology that may enable its early detection. Inflammation in endothelial cells of an artery may participate in initiation and progression of plaque (Kaufmann 2007). Also, in later stages of development the molecular characteristics of an atherosclerotic plaque may provide cues in assessing its vulnerability. A sensitive technique that can effectively guide flowing targeted microbubbles and selectively image static microbubbles may help not only in providing information on the presence or extent of a disease, but also on the future risk of disease progression.
Ultrasound contrast agents are perflurocarbon gas filled microbubbles with compressibility several orders of magnitude greater than that of blood or the surrounding tissue, thereby resulting in significantly greater backscatter and increased sensitivity (De Jong et al. 1992). Research in the past decade has explored the potential of targeted ultrasound contrast agents as molecular imaging probes (Villanueva et al 1998. Lindner et al. 2001, Klibanov 2007). Microbubbles can be conjugated to ligands precursor to different diseases such as: transplant rejection (Denger and Pober 2005), ischemia reperfusion (Sheridan et al. 1996), and atherosclerosis (Ross 1990). Targeted microbubbles travel through the blood vessels and selectively adhere to the site of inflammation by forming a molecular bond with the molecular targets present on the vessel wall. The rheological behavior of the microbubbles is similar to that of the red blood cells (Jayaweera et al. 1994). This characteristic causes microbubbles to preferentially travel along the center of the blood vessels which can result in low targeting efficiency and lower retention at the target site. Recent research by Dayton et al. (1999, 2002), Zhao et al. (2004), and Rychak et al. (2005, 2007) has proposed the use of acoustic radiation force for guiding the targeted microbubbles to the vessel wall. The efficacy of radiation force has been successfully demonstrated in capillary size micro vessels (200 microns diameter) and at low centerline flow velocities (tens of millimeters/ second). However, blood vessels such as arteries have diameters ranging from few millimeters to few centimeters and flow velocities in range of several centimeters/ second (Kiviniemi et al. 2008). This may pose a major challenge in applying targeted imaging and drug delivery in arteries. In addition, real-time clinical tools for simultaneously pushing, imaging, and distinguishing stuck microbubbles from free microbubbles are broadly unavailable. Current imaging approaches require clearance of freely flowing agents and/or destruction to visualize static agents (Lindner et al. 2001). These approaches have low specificity and require long waiting periods. Hence, a real-time imaging approach that can simultaneously push and selectively image microbubbles may provide clinicians with a valuable tool in diagnosing vascular diseases.
In more recent work, Zhao et al. (2005) and Vos et al. (2007) have reported experimental observations that demonstrate asymmetric oscillations of adherent contrast agents, such boundary effects may alter the monopole scattering from microbubbles or induce spherical harmonics. Characterization of these phenomena may aid in selectively imaging signals from static microbubbles. Zhao et al. (2007) have proposed two distinct methods for selective imaging of microbubbles. While their first approach (Image-push-image) provides images with high contrast-to-noise ratio (CNR =30 dB), it requires a waiting period, and provides two images before and after the application of radiation force. In their second approach, Zhao et al. (2007) proposed the use of a single pulse and a mechanically scanned dual element transducer for pushing and imaging microbubbles. For real-time implementation this method will require a very high bandwidth transducer if short single cycle pulses are used for imaging and radiation force. This method could potentially be used in real-time, though application of such an approach in large blood vessels may demand longer pulses and/or higher pulse repetition frequency (PRF) that may compromise temporal and spatial resolution. In this paper, we address these outstanding issues with a real-time dual frequency excitation technique suitable for simultaneously translating free flowing microbubbles and selectively imaging static microbubbles in large blood vessels with high velocities.
Methods
Resonance Stimulation-pulse inversion based bubble specific imaging (RSPI)
Figure 1a is a flow diagram illustrating the proposed scheme. A high PRF composite sequence consisting of a long radiation force pulse followed by two single cycle pulse inversion (PI) pulses is used to push and image microbubbles (Figure 1b). The sequence is transmitted along adjacent A-lines encompassing widths of acquisition ranging from 2 to 4 cm. In this work, the radiation force pulses were centered at frequencies ranging from 1.6 to 10 MHz, whereas the pulse inversion (PI) pulses were centered at 8 MHz.
Figure 1.

a) Resonance stimulation-Pulse inversion imaging scheme. b) Composite imaging sequence used for simultaneously imaging and pushing microbubbles. c) Schematic of the apparatus.
A radiation force pulse modulates (Cherin et al. 2008, Bouakaz et al. 2007) the microbubble behavior by stimulating the microbubble at its resonance frequency. It performs a dual role of increasing microbubble backscatter, and maximizing microbubble displacement (Dayton et al. 2002). Pulse inversion sequence cancels any linear tissue signal, while specifically retaining the microbubble signal. Mechanical Index of the radiation force pulse is always maintained in the range of 0.15 to 0.2. Since, equal peak negative pressure is used for both imaging and pushing pulses, the mechanical index at this imaging frequency is correspondingly small. This minimizes non-linear tissue response and increases specificity. During receive processing; the backscatter data obtained from positive and negative pulses are summed to create a PI-mode image. As illustrated in Figure 1, the non-linear imaging mode or PI radio frequency (RF) data are “slow time” averaged to retain signals from bound microbubbles. This technique refers to temporal averaging over several transmitted pulses (de Ana et al. 2003). It eliminates high frequency variations in a data set acquired over several temporally spaced observation windows. “Slow time” averaging of the acquired RF frames results in incoherent summation of the moving bubble signal resulting from random phases, and coherent summation of static bubble signal due to constant phases. Alternately, successive RF image frames can be temporally differentiated (high pass filter) to selectively obtain the flowing bubble signal. The microbubble dynamics are extracted from the RF data. The data are then envelope detected and log compressed for display.
Wall-less flow phantom
A wall-less gelatin based flow phantom was fabricated to test the proposed hypothesis. Acoustic and elastic properties of the gelatin phantom, for the ratios used in this work, are close to that of normal tissue (Hall et al. 1997). Nine hundred milliliters of degassed deionized water was heated to 80° C on a hot plate. The water was constantly stirred using a magnetic stirrer to ensure a uniform distribution of heat. Food grade gelatin (Kroger, Cincinnati, OH) approximately 6% by weight was slowly added to the heated water, while simultaneously stirring it. Agar (Bacto, Sparks, MD) approximately 1% by weight was added to the liquid mass. Agar particles act as scatterers generating a speckle pattern in the image of the fabricated phantom, whereas gelatin provides stiffness to the phantom. Bores of diameter 2 mm were drilled at the diametrically opposite end of a 1000 cc plastic container. A soft elastic tube of an external diameter of 2 mm was passed between these bores. The ends of the elastic tube were glued to the outer side of the container to prevent any kink or bending of the elastic tube in the plastic container. The liquid mass containing gelatin and agar was cooled to approximately 40° C and poured in the plastic container. The container was then refrigerated at 4° C for 24 hours. After refrigeration, the embedded elastic tube was slowly withdrawn to create a wall-less flow phantom. The embedded channel was 2 cm from the surface of the gelatin phantom.
Programmable scanner
A programmable Ultrasonix Research Platform (RP) Scanner (Ultrasonix, Richmond, BC, Canada) was used in all our experiments. The Ultrasonix RP allows for a transmit sampling of 80 MHz, and a receive sampling of 40 MHz. The scanner enables generation of random pulse sequences with Gaussian only pulses, dynamic transmit-receive focus, and provides with unfiltered and/or filtered received data (focused or unfocused). A high bandwidth (BW) transducer array that provides a -6 dB fractional bandwidth of approximately 110% at 8 MHz was used in these experiments. Transmit and receive frequencies could be varied from 1.6 MHz-10% -6 dB BW to 14 MHz-20% -6dB BW. A Mechanical Index (MI) of approximately 0.2 was maintained for all radiation force sequences. It should be noted that given the bandwidth limitations of the transducer, it is not feasible to perform imaging below 4 MHz or above 12 MHz. However, narrow band pulses can be easily generated at these frequencies. When using research interface, the Ultrasonix RP scanner stores the data to hard disk and does not use the cyclic buffer. As a result, for an acquisition depth of approximately 40 mm, and acquisition width in range of 24-38 mm, the frame rate varied approximately from 7-20 Hz.
Phantom experiments
Experiments were conducted to assess the ability of this imaging sequence to simultaneously translate, and image microbubbles in blood vessels of size similar to those in plaque prone arteries. A vessel diameter similar to that of a human coronary artery or a dog carotid (∼2 mm) was chosen for these experiments (Orsi et al. 2006, Kiviniemi et al. 2008). Physiologically relevant flow velocities from 5-30 ml/min (2.65-15.9 cm/s for 2 mm diameter vessel) were considered in this work (Kiviniemai et al. 2008). Targestar-B (Targeson Inc, Charlottesville, VA) lipid shell microbubbles were used in these experiments. Initial microbubble concentration was approximately 880×106/ml with average microbubble diameter of 2.2 μm (linear resonance frequency ∼ 4.4 MHz). The resonant frequency of the microbubbles was calculated using the formulation published in Morgan et al. (2000). The schematic view of the experimental apparatus used in this work is illustrated in Figure 1c. The microbubbles were diluted in deionized water and continuously stirred using a magnetic stirrer. A syringe pump (Harvard Apparatus, Holliston, MA) was used to withdraw microbubbles from the beaker. The channel in the wall-less phantom was insonated using the proposed dual frequency excitation technique programmed on a linear array. Experiments were conducted to: a) Quantify the sensitivity of this technique to varying frequency of the radiation force pulse, b) Quantify sensitivity to varying flow in large blood vessels and c) Observe the effect of variations in microbubble concentration on the methods performance.
Tables 1, 2, and 3 outline the bubble and acoustic parameters used in these experiments. As illustrated in Table 1, the radiation force pulse frequency was varied from 1.6-10 MHz while keeping the imaging frequency constant at 8 MHz. The flow velocity, microbubble concentration, and focus were maintained at 2.65 cm/s, 2.2 ×10⁶/ml, and 2 cm, respectively. Table 2 lists the experimental parameters varied in the flow sensitivity experiment. The radiation force and imaging frequencies were constant at 4 and 8 MHz, respectively. The microbubble flow velocities were varied from 2.65 to 15.9 cm/s. For constant acoustic and flow conditions, the microbubble concentration was varied to quantify any changes in the static microbubble signal as a function of concentration. Each experiment was repeated 20 times to obtain a proper statistical estimate of the variations in the static microbubble signal.
Table 1. Parameters for studying sensitivity to radiation force pulse frequency.
| Radiation Force | fr= 1.6, 2, 3 ,4, 6, 8,and 10 MHz , 10 cycle pulses, MI=0.2 |
| Imaging | fc = 8 MHz single cycle inverted pulses |
| Flow velocity | 2.65 cm/s ( 5 ml/min) |
| Bubble concentration | 2.2×10⁶/ ml |
| Focus | 2 cm |
| Depth, and Width of acquisition | 4 cm, and 2.4 cm |
Table 2. Parameters for studying sensitivity to various flow conditions.
| Radiation Force | fr= 4 MHz , 10 cycle pulses, MI =0.2 |
| Imaging | fc = 8 MHz single cycle inverted pulses |
| Flow velocity | 2.65, 5.3, and 15.9 cm/s (5,10, and 30 ml/min) |
Table 3. Parameters for studying sensitivity to various microbubble concentration.
| Radiation Force | fr= 4 MHz , 10 cycle pulses, MI= 0.2 |
| Imaging | fc = 8 MHz single cycle inverted pulses |
| Flow velocity | (5.3 cm/s (10 ml/min) |
| Concentration | 2.2 and 22 ×106/ ml |
Results
Figure 2a illustrates the normal and pulse inversion images acquired using the research interface of Ultrasonix RP scanner. The imaging frequency was 8 MHz, and the MI was 0.2. The linear signal originating from the gel phantom is canceled by pulse inversion, whereas the signal scattered by the vessel is retained. Figure 2b illustrates an image acquired using pulse inversion imaging sequence. The image was obtained without applying “slow time” averaging. A strong signal from buoyant microbubbles is visible at the upper wall of the vessel, with a smaller signal produced by microbubbles throughout the lumen of the vessel. The image was acquired before the application of radiation force, and after incubating the microbubbles in the vessel for 2 minutes which allowed buoyancy to force most microbubbles at the top of the vessel. Figure 3 illustrates the images obtained over the duration of the 12 seconds when the hybrid sequence was applied. In Figure 3, the microbubbles are flowing from left to the right of the image. The left column and right columns display images obtained without and with “slow time” averaging, respectively. Imaging was performed at 10 MHz, and the radiation force pulse was applied at 4 MHz. The microbubbles were infused (from left of the channel) at a rate of 15.9 cm/s; the concentration of microbubbles was 2.2 ×10⁶/ml. In Figure 3, the static signal originates from downstream of the vessel rather than upstream. Microbubbles travel along a trajectory towards the distal wall before coming in contact with the vessel wall. This trajectory is a function of both the microbubble velocity and the applied radiation force. Since the flow in the vessel was approximately 15.9 cm/s, statistically most of the microbubble adhesion took place downstream rather than upstream. Figure 4a illustrates the temporal variations in the static microbubble signal from the distal wall of the vessel as a function of radiation force pulse frequencies (1.6-10 MHz). The error bars indicate one standard deviation of the intensity values off the distal vessel wall for twenty independent measurements. It can be observed that after an initial steep increment in the static microbubble signal, the signal reaches an asymptotic value over the rest of the duration of application of radiation force-imaging sequence. The rise time of the static microbubble signal is defined as the total time over which the microbubble signal increases from 0 to 63% of its saturation value. In Figure 4a:
is defined as the rate of change in the static microbubble signal, and
ΔI is the absolute change in the amplitude of a given signal.
It may be observed that the maximum rate of change and the absolute change in intensity of the static microbubble signal are greatest at 4 MHz. An exponential model was fitted to all curves, and was chosen because it minimized the min-max and the rms error. For all curves, r2 > 0.99. Figure 4b illustrates the plot of normalized maximum rate of change and normalized variations in absolute intensities of model fitted curves in Figure 4a. The maximum rate of change and the absolute change in intensity of every curve (1.6, 3, 4, 6, 8 and 10 MHz) in Figure 4a were normalized by that of the curve where the signal was highest (4 MHz). The normalized intensity and normalized rate plots peak at 4 MHz. The plots also display a secondary peak at 8 MHz, clearly signifying the contribution of the radiation pulse excitation frequency. Figure 5a illustrates the temporal change in the static microbubble signal at different linear flow velocities. The flow velocity decreases the rate of increment and maximum variation in the static bubble signal. It should be noted, however, that significant (12 dB) increase in static microbubble signal is observed even at higher flow regimes, indicating the potential for radiation force to arrest circulating microbubbles in rapid arterial flow. Figure 5b illustrates the normalized rate of change and the normalized absolute intensity plots corresponding to the model fitted data in Figure 5a. Flow velocities greater than 15.9 cm/s were not considered in this work as the gelatin vessel wall ruptured at higher flow velocities.
Figure 2.

a) B-mode and Pulse inversion images obtained using Ultrasonix RP scanner. The imaging was performed at 10 MHz. The depth of acquisition was 8 cm. The vessel with flowing microbubbles was at a depth of 3 cm. The dynamic range cutoff was at -30 dB. b) Magnified image of a flow phantom in pulse-inversion mode. The dynamic range cut off is -25 dB. The FOV of the image is 18×18 mm. The floating microbubbles are evident at the top end the vessel.
Figure 3.

Images obtained using the proposed sequence without (L) and with “slow time”(R) filtering. The flow velocity is 15.9 cm/s, microbubble concentration is 2.2×10⁶/ml, radiation force was applied at 4 MHz, and imaging was performed at 10 MHz. FOV of the image is (18×18 mm). Dynamic range of the images was 20 dB. The direction of flow is from left to the right of the figure.
Figure 4.

a) Temporal variation in the stationary microbubble signal at the distal wall as a function of radiation force pulse frequency-experimental data with exponential model superimposed, b) Normalized absolute intensities and maximum rate of change of the model fitted to the stationary microbubble signal. Error bars indicate one standard deviation over twenty independent trials.
Figure 5.

a) Temporal changes in the intensity of stationary microbubble signal at the distal wall as a function of time, obtained at varying flow conditions. A radiation force pulse was applied at 4 MHz, and imaging was performed at 8 MHz. Microbubble concentration was 2.2 ×10⁶/ml. The fitted exponential model superimposed on the experimental data. b) Normalized absolute intensities, and average rate of change of the model fitted to the stationary microbubble signal curves in Figure 5b. Error bars indicate one standard deviation over twenty independent trials.
Figure 6 illustrates the temporal changes in the intensity of the static microbubble signal as a function of microbubble concentration. Exponential model fitted to the data is superimposed on the experimental dataset in Figure 6. Though higher microbubble concentration does not alter the rate of increment in the static bubble signal, it scales with the original trend. Hence higher microbubble concentrations can be used at greater flow velocities to compensate for reduction in the static microbubble signal. Figures 7a and 7b illustrate the variation in the mean signal intensity of the proximal wall, lumen, and the distal wall of the vessel in the wall-less phantom at MI 0.15 and 0.1, respectively. The threshold behavior of the radiation force is apparent from these graphs. The threshold behavior clearly signifies the role played by the dual frequency excitation sequence in translating microbubbles and enhancing the static microbubble signal.
Figure 6.
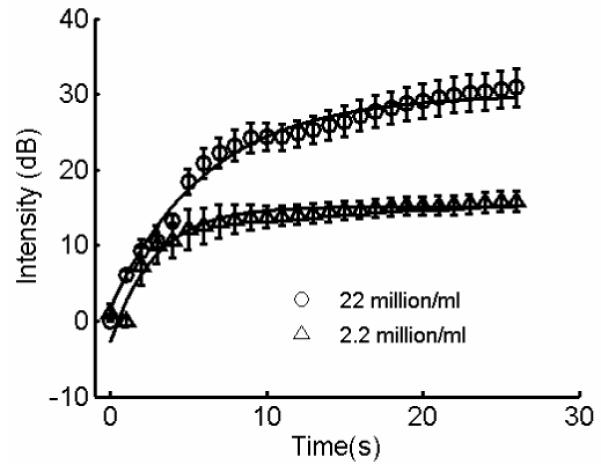
Temporal changes in the intensity of the stationary microbubble signal, scaled by microbubble concentration. The imaging frequency was 8 MHz; radiation force pulse was applied at 4 MHz. The flow velocity was 5.3 cm/s. Experimental data with fitted model superimposed. Error bars indicate one standard deviation over twenty independent trials.
Figure 7.
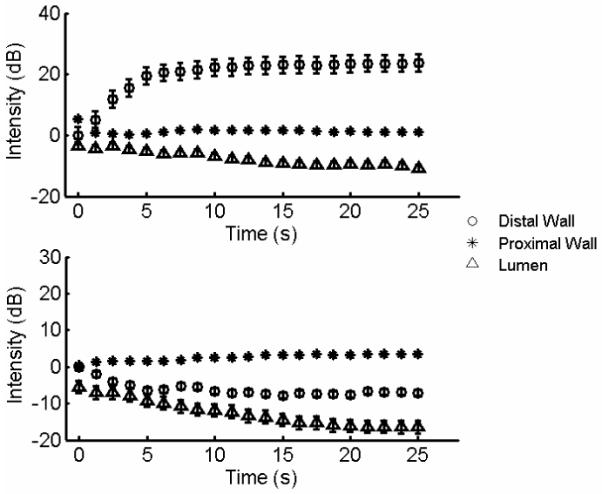
Threshold behavior of the radiation force, MI = 0.15 (a), MI = 0.1 (b). Temporal changes in the intensity of the lumen (triangle), distal (circle), and proximal wall (square). Flow velocity 2.65 cm/s, microbubble concentration 2.2 ×10⁶/ml, radiation force frequency 4 MHz, imaging frequency 8 MHz. Error bars indicate one standard deviation over twenty independent trials.
Discussion
In this work, we described a technique for simultaneously pushing and selectively imaging microbubbles in a large vessel. As demonstrated in these results, pulse inversion canceled most of the background signals from the surrounding tissue-mimicking gel, whereas “slow time” averaging of the ultrasound RF frames canceled flowing microbubble signal. Many filtering techniques or pulse sequences (e.g. CPS, Phillips 2001) may be used for selectively imaging microbubbles. PI was primarily used in this work because of the ease of implementation. Our results show that for an increase in the pushing pulse frequency from 1-10 MHz, the mean static microbubble signal increased to peak at ∼4 (Figure 4b). The mean resonance frequency of the microbubble population used in this work was ∼4 MHz. The radiation force experienced by a microbubble in an oscillating pressure field is a time average product of the volumetric microbubble oscillations and the pressure gradient as experienced by the microbubble (Crum 1965). Hence at resonance frequency and its harmonics, we note three important phenomena: a) the microbubble response is highly non-linear and results in large time average microbubble expansions, b) the phase lag between the radial oscillations of the microbubble and the oscillatory pressure field is small, and c) the maximal microbubble excursion is large. All of these factors contribute to greater displacements (Dayton et al. 2002). At frequencies above 4 MHz, the coupled oscillatory-translational relationship of the microbubbles becomes weaker, thereby reducing the effect of radiation force (Allen et al. 1997).
From Figure 4b, it can be observed that the variations in the normalized average rate of change in static microbubble signal are sharper than those in normalized absolute intensity. It is concluded that for the microbubble concentration levels used in this work, the rise time of the static microbubble signal curve is strongly influenced by the resonance response of the microbubble, whereas the absolute change in the intensity is dependent on the microbubble concentration, the resonance behavior of the microbubble, and the rate at which the microbubbles flow through the vessel. In Figure 4b, the secondary peak at 8 MHz can be attributed to a subharmonic effect. The centroid (diameter) of the microbubble population, used in the work, was at 2.2 μm. This corresponds to a linear resonance frequency of approximately 4.4 MHz (Morgan et al. 2000). The secondary peak (8 MHz) in Figure 4b appears due to a subharmonic resonance response (Chomas et al. 2002). The subharmonic response takes time to develop which corresponds to the rise time of the curve at 8 MHz (Figure 4a). The 8 MHz curve emerges from below the 6 MHz curve and overtakes the 6 MHz curve at ∼16s.
As illustrated in the Figure 5b, the reduction in the normalized absolute intensity of the microbubble signal, as a function of microbubble flow velocities, is sharper than the reduction in the normalized rate of change in static microbubble signal. It is deduced that at constant pulse pressure, frequency and microbubble concentration, increased flow rates contribute towards two distinct factors: a) fewer microbubbles are present under the cross-section of the radiation force pulse at any instant, and b) the lateral force on the microbubble at the vessel wall increases sharply as the function of flow rate. Both factors contribute towards reduced static microbubble signal. From Figure 6 it can be observed that for constant acoustic and flow parameters, an increase in microbubble concentration results in a scaling of the static microbubble signal. At the two different concentrations examined here, the rate of change in static microbubble signal remained constant and the intensity of the static microbubble increased by 15 dB with 10 folds increase in microbubble concentration. This observation validates our hypothesis that the pulse frequency primarily controls the rate of change in static microbubble signal.
MI’s (∼0.15-0.2) reported in this work are higher than those suggested by Rychak et al. (2005), i.e. 0.08. However, it should be noted that Rychak et al. conducted experiments in a capillary flow chamber with negligible attenuation, while experiments in this work were conducted in a wall-less gelatin phantom. Acoustic attenuation in gelatin phantoms is closer to that in normal tissue, which accounts for higher MI’s reported in this work. Another consideration is the role of attenuation from increasing agent concentration. For the experimental set-up in this study, we believe this is a secondary consideration to the overall results. However, this effect should be examined in more detail in future work as it may be of particular importance for flows near vessel bifurcations at which agents might accumulation at low velocity regions.
Based on the results in Figure 4 through Figure 7, it can be concluded that for increasing flow velocities (> 15.9 cm/s) and optimal acoustic parameters, the rate of reduction (Figure 5b) in static microbubble signal cannot be altered, but the rate of fall in the absolute intensity (reduction in total number of static microbubbles) of microbubble can be modulated by altering the administered microbubble concentration. This implies that at greater flow velocities (> 15.9 cm/s), the performance of this approach can be boosted by increasing microbubble concentration. Monodisperse microbubbles population may further assist in improving the performance of this approach by maximizing the microbubble population in a desired range (Talu et al. 2007).
Conclusion
In summary, we have proposed and implemented an approach for simultaneously pushing and imaging microbubbles in a real-time environment. We have also demonstrated that for blood vessels of large size (∼ 2mm), and flow velocities in the range of 2.65-15.9 cm/s, radiation force produced using a customized dual frequency sequences (within diagnostic limits) can translate microbubbles across the vessel to accumulate the microbubbles at the distal wall.
Acknowledgments
A. V. Patil and J. A. Hossack acknowledge support from NIBIB grants EB002185 and NHBLI HL090700. J.S. Allen acknowledges support from the NIH 2 P20 RR016453-05A1 and 2 G12 RR0030161-21.
Footnotes
Publisher's Disclaimer: This is a PDF file of an unedited manuscript that has been accepted for publication. As a service to our customers we are providing this early version of the manuscript. The manuscript will undergo copyediting, typesetting, and review of the resulting proof before it is published in its final citable form. Please note that during the production process errors may be discovered which could affect the content, and all legal disclaimers that apply to the journal pertain.
References
- Allen JS, Roy R, Church CC. On the role of shear-viscosity in mediating inertial cavitation from short pulses, megahertz frequency ultrasound. IEEE transactions on UFFC. 1997;44:743–51. [Google Scholar]
- Boukaz A, Versluis M, Boorsboom J, de Jong N. Radial modulation of microbubbles for ultrasound contrast imaging. IEEE transactions on UFFC. 2007;54(11):2283–90. doi: 10.1109/tuffc.2007.532. [DOI] [PubMed] [Google Scholar]
- Cherin E, Brown J, Masey S, Shariff M, Karshaffian R, Williams R, Burns PN, Foster SF. Radial modulation imaging of microbubble contrast agents at high frequency. Ultrasound in Medicine and Biology. 2008;34(6):949–62. doi: 10.1016/j.ultrasmedbio.2007.11.017. [DOI] [PubMed] [Google Scholar]
- Chomas J, Dayton P, May D, Ferrara K. Non destructive Subharmonic imaging. IEEE transactions on UFFC. 2002;49(7):883–92. doi: 10.1109/tuffc.2002.1020158. [DOI] [PubMed] [Google Scholar]
- Crum LA. Bjerkness forces on bubbles in a stationary sound field. Journal of Acoustic society of America. 1965;57(6):1363–70. [Google Scholar]
- Dayton P, Morgan KE, Klibanov AL, Brandenburger G, Ferrara K. Acoustic radiation force invivo: a mechanism to assist targeting of microbubbles. IEEE transactions on UFFC. 1999;25(8):1195–1201. doi: 10.1016/s0301-5629(99)00062-9. [DOI] [PubMed] [Google Scholar]
- Dayton PA, Allen JS, Ferrara KW. The magnitude of radiation force on ultrasound contrast agents. Journal of Acoustic society of America. 2002;112:2183–192. doi: 10.1121/1.1509428. [DOI] [PubMed] [Google Scholar]
- De Ana FJ, O’Donnell M. Blood flow estimation error with intravascular ultrasound due to in-plane component of flow. Ultrasonic Imaging. 2003;3:193–212. doi: 10.1177/016173460302500306. [DOI] [PubMed] [Google Scholar]
- De Jong N, Hoff L, Skotland T, Bom N. Absorption and scatter of encapsulated gas filled microspheres; theoretical considerations and some measurements. Ultrasonics. 1992;30(2):95–103. doi: 10.1016/0041-624x(92)90041-j. [DOI] [PubMed] [Google Scholar]
- Denger TJ, Pober TS. Cellular and molecular biology of cardiac transplant rejection. J. Nucl. Cardiol. 2000;7:669–685. doi: 10.1067/mnc.2000.111128. [DOI] [PubMed] [Google Scholar]
- Hall TJ, Bilgen M, Insana MF, Krouskop TA. Phantom materials for elastography. IEEE Transactions on UFFC. 1997;44(6):1355–65. [Google Scholar]
- Jayaweera AR, Edwards N, Glasheen WP, Villanueva FS, Abbot RD, Kaul S. In vivo myocardial kinetics of air filled albumin microbubbles during myocardial contrast echocardiography: Comparison with radiolabeled red blood cells. Circul. Res. 1994;74:1157–1165. doi: 10.1161/01.res.74.6.1157. [DOI] [PubMed] [Google Scholar]
- Kaufmann BA, Sanders JM, Davis C, Xie A, Aldred P, Sarembock IJ, Lindner JR. Molecular imaging of inflammation in atherosclerosis with targeted detection of vascular cell adhesion molecule. Circulation. 2007;116:276–84. doi: 10.1161/CIRCULATIONAHA.106.684738. [DOI] [PubMed] [Google Scholar]
- Kivinemi T. Assessment of coronary blood flow and reactivity of the microcirculation non-invasively with trans-thoracic coronary artery. Clinical Physiology and functional imaging. 2008;28(3):145–55. doi: 10.1111/j.1475-097X.2008.00794.x. [DOI] [PubMed] [Google Scholar]
- Klibanov AL. Ultrasound molecular imaging with targeted ultrasound contrast agents. American Society of Nuclear Cardiology. 2007;14(6):876–884. doi: 10.1016/j.nuclcard.2007.09.008. [DOI] [PubMed] [Google Scholar]
- Lindner JR, Song J, Christiansen J, Klibanov AL, Xu F, Ley K. Ultrasound assessment of inflammation and renal tissue injury with microbubbles targeted to P-selectin. Circulation. 2001;104:2107–2112. doi: 10.1161/hc4201.097061. [DOI] [PubMed] [Google Scholar]
- Morgan KE, Allen JS, Dayton PA, Chomas JE, Klibanov AL, Ferrara KW. Experimental and theoretical evaluation of microbubble behavior: Effect of transmitted phase and bubble size. IEEE transactions on UFFC. 2000;47(6):1494–1509. doi: 10.1109/58.883539. [DOI] [PubMed] [Google Scholar]
- Orsi AM, Domeniconi RF, Artoni SMB, Filho JG. Carotid arteries in Dog: Structure and Histopathology. International Journal of Morphology. 2006;24(2):239–244. [Google Scholar]
- Phillips PJ. Contrast pulse sequence (CPS): Imaging non-linear microbubbles. IEEE Ultrasonic Symposium. 2001;1:1739–45. [Google Scholar]
- Rosamond W, Katherine F, Furie K, Go A, Greenlund K, Haase N, Hailpern SM, Ho M, Howard V, Kissela B, Kittner S, Lloyd-Jones D, McDermott M, Meigs J, Moy C, Nichol G, O’Donnell C, Roger V, Sorlie P, Steinberger J, Thom T, Wilson M, Hong Y. Heart disease and stroke statistics-2008 update. 2008;26(4):329–35. doi: 10.1161/CIRCULATIONAHA.107.187998. [DOI] [PubMed] [Google Scholar]
- Rychak JJ, Klibanov AL, Hossack JA. Acoustic radiation force enhances targeted delivery of ultrasound contrast microbubbles: In Vitro verification. IEEE Transactions on UFFC. 2005;52(3):421–33. doi: 10.1109/tuffc.2005.1417264. [DOI] [PubMed] [Google Scholar]
- Rychak JJ, Klibanov AL, Ley KF, Hossack JA. Enhanced targeting of ultrasound contrast agents using acoustic radiation force. Ultrasound in Medicine and Biology. 2007;33(7):1132–39. doi: 10.1016/j.ultrasmedbio.2007.01.005. [DOI] [PubMed] [Google Scholar]
- Ross R. The pathogenesis of atherosclerosis: A perspective for the 1990s. Nature. 1993;362:801–809. doi: 10.1038/362801a0. [DOI] [PubMed] [Google Scholar]
- Sheridan FM, Cole PG, Ramage D. Leukocyte adhesion to the coronary microvasculature during ischemia and reperfusion in an in vivo canine model. Circulation. 1996;93:1784–1787. doi: 10.1161/01.cir.93.10.1784. [DOI] [PubMed] [Google Scholar]
- Talu E, Hettiarachchi K, Zhao S, Powell RL, Lee AP, Longo ML, Dayton PA. Tailoring the size of distribution of ultrasound contrast agents: Possible method for improving sensitivity in molecular imaging. Molecular Imaging. 2007;6(6):384–92. [PMC free article] [PubMed] [Google Scholar]
- Villaneuva FS, Jankowski RJ, Klibanov AL, Pina ML, Alber SM, Watkins SC, Brandenburger GH, Wagner WR. Microbubbles targeted to intracellular adhesion molecule 1 bind to activated coronary artery endothelial cells. Circulation. 1998;98:1–5. doi: 10.1161/01.cir.98.1.1. [DOI] [PubMed] [Google Scholar]
- Vos HJ, Versluis M, de Jong N. Orthogonal observation of vibrating microbubbles. IEEE Ultrasonic Symposium. 2007;1:765–68. [Google Scholar]
- Zhao S, Borden M, Bloch S, Kruse D, Ferrara KW, Dayton PA. Radiation force assisted targeting facilitates ultrasonic molecular imaging. Molecular Imaging. 2004;3:135–48. doi: 10.1162/1535350042380317. H. [DOI] [PMC free article] [PubMed] [Google Scholar]
- Zhao S, Ferrara KW, Dayton PA. Asymmetric oscillations of adherent Ultrasound contrast agents. Applied Physics Letters. 2005;87:134103–6. doi: 10.1063/1.2061872. [DOI] [PMC free article] [PubMed] [Google Scholar]
- Zhao S, Kruse DE, Ferrara KW, Dayton PA. Selective imaging of adherent targeted ultrasound contrast agents. Physics in Medicine and Biology. 2007;52:2055–72. doi: 10.1088/0031-9155/52/8/002. [DOI] [PMC free article] [PubMed] [Google Scholar]