Abstract
Loss of fixation at cement-bone interface is known to contribute to aseptic loosening, but very little is known about the mechanical damage response of this interface. An in vitro study using cement-bone specimens subjected to shear fatigue loading was performed and the progression of stiffness and creep damage at the interface was measured using digital image correlation techniques. Stiffness and creep damage localized to the contact interface between cement and bone. Interface creep damage followed a three-phase response with an initial rapid increase in creep, followed by a steady state increase, concluding in a final rapid increase in creep. The initial creep phase was accompanied by an increase in interface stiffness suggesting that there was an initial locking-in affect at the interface. There was a decrease in interface stiffness as further creep damage progressed. Power law models were reasonably successful in describing the creep and stiffness damage response and were a function of loading magnitude, number of loading cycles, and contact area at the cement-bone interface. There was more micro-crack damage to the cement when compared to the bone and this localized along the interface. These findings indicate that damage to the cement-bone interface could be minimized by improving cement-bone contact and by strengthening the fatigue resistance of the cement.
Keywords: Aseptic loosening, joint replacement, micromechanics, interface mechanics, damage
Introduction
Poly(methylmethacrylate) cement is commonly used to fix total joint replacement components and relies on good interlock between the cement and bone. A great deal is known about the mechanical response of cement and bone to mechanical loading and a large body of work exists regarding factors that affect the strength of the cement-bone interface (3, 6, 7, 9, 15, 17). From a clinical perspective, the loosening process is often accompanied by a degeneration of the cement-bone interface resulting in extensive fibrous tissue formation or loss of bone (5, 16). These phenomena trigger subsequent excessive interface motion (24) and excessive migration of the prosthetic components (12) ultimately leading to aseptic loosening of the implant (24). Improved mechanical fixation of the cement-bone interface could postpone mechanical loosening and is therefore one of the key factors involved in the survival of cemented components.
The relationship between mechanical loading and the motion at the cement-bone interface is not well understood. Micromotion is widely used to describe the mechanical response of the interfaces to loading, usually referring to a small magnitude of motion (1, 8, 11). The location of micromotion measurement is often far away from the interface, with the actual interface motion inferred from global measurements. Hence, it is very difficult to use these studies to deduce the local mechanical behavior in a reliable way. Recently, the micromechanics of the cement bone interface loaded in quasi-static tension and compression was explored with the finding that motion localizes at the contact interface between cement and bone (18). Furthermore, the interface was found to be quite compliant, with interface motions on the order of 5 microns for a 1 MPa applied stress in both tension and compression.
While quasi-static loading conditions are of interest, fatigue loading, with the potential for progressive damage would be much more relevant as a possible loosening mechanism in total joint replacements. In addition, efforts to model the damage response of cemented implant systems (10, 19, 20, 22) could be further enhanced by a better understanding of the fatigue damage micromechanics of the cement-bone interface. In this research, a series of shear fatigue experiments was performed on cement-bone interface specimens and the mechanical response at the cement bone interface was monitored using digital image correlation techniques. From this, three research questions were developed. First, what is the interface damage response of the cement-bone interface when subjected to shear fatigue loading? Second, can we the damage response be predicted based on loading magnitude or morphology? Third, is there more damage to the cement or to the bone and can this be related to interfacial creep or stiffness damage?
Methods
Specimen Preparation
Specimens of rectangular-prism shape containing bone, cement and the interface between cement and bone were prepared from proximal, fresh frozen human femurs (seven donors, mean age 75, range 50 to 90, three male). The femurs were cemented using thermal and haemodynamic conditions that simulate the surgical implantation of a cemented femoral hip component in total joint replacement (21). The femoral neck was cut at the calcar, a broach was used to prepare the canal followed by brush lavage with irrigation, insertion of a distal plug, pressurization of the cement, and immersion of femur into a 37°C blood analog solution. PMMA bone cement was introduced (Surgical Simplex P, Stryker Corp., Mahwah, NJ) at room temperature (21°C) into the canal using a cement gun. As the cement mantle could be thin in places (1–3 mm), a replica Exeter stem, fabricated from PMMA was inserted instead of a metal stem to allow for adequate cement for mechanical gripping following sectioning. Following cement cure, the femurs were soaked in a blood analog solution for four days before sectioning to create rectangular-prism shaped specimens with cross sections of 3.98 ± 0.17 mm by 7.93 ± 0.16 mm.
Determination of Contact Area Between Cement and Bone
Specimens were scanned in a micro-CT scanner (SCANCO Medical AG, Basserdorf, Switzerland) at 12 micron isotropic resolution. Interface contact area (CA) was estimated using an image processing technique that included segmentation of cement and bone into discrete 3D bodies, dilation of the cement body by two voxels (24 microns), followed by determination of the Boolean intersection between the cement and bone. This intersected volume was then divided by the amount of the dilation operation (24 microns) to result in an estimate of contact area between cement and bone. Further details of this approach have previously been presented (18).
Experimental Apparatus and Digital Image Correlation Measurements
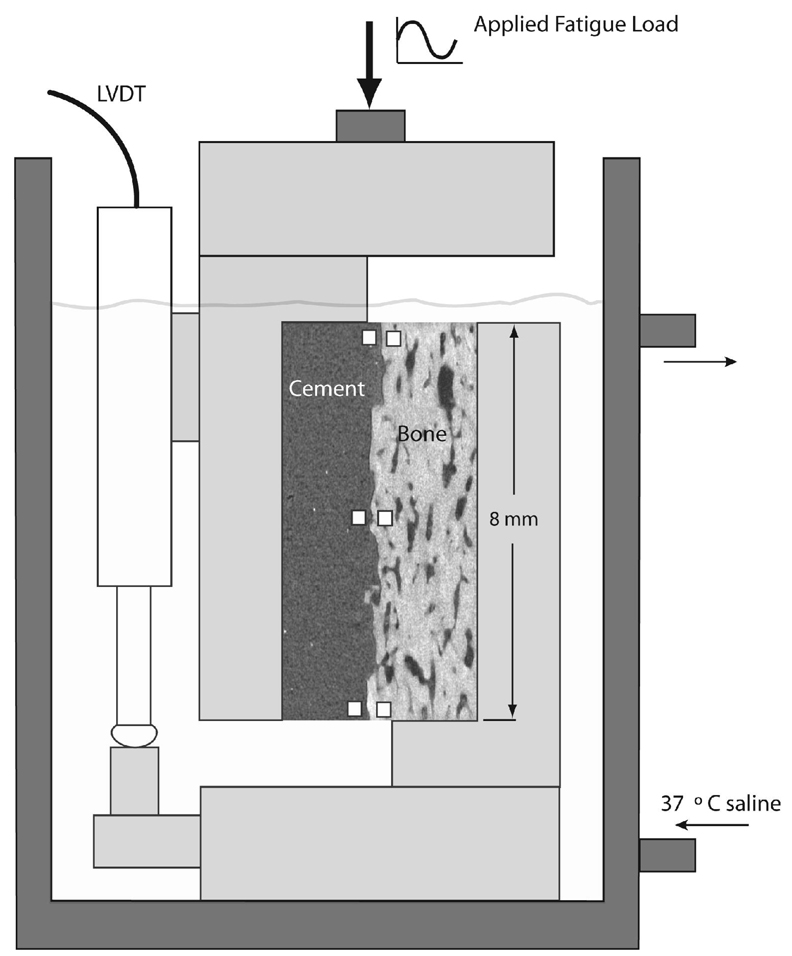
The shear loading apparatus consisted of an environmental chamber with calcium buffered physiologic saline (37°C), shear loading grips, and a CCD camera (7.3 micron/pixel) to capture motion during loading (Figure 1). Digital image correlation (DIC) was used to measure motion at six discrete zones along the interface between the cement and bone. Sample locations were 40 by 40 pixels (0.085 mm2) and RMS error for the DIC system was 0.000395 mm (18). The vertical motions of the cement and bone sampling zones were averaged (three for cement and three for bone), and the difference between cement and bone vertical motion, defined here as interface shear displacement, was used as the primary outcome measure of cement-bone interface shear motion. The applied apparent stress was calculated as the applied load divided by the nominal interface area (~32 mm2).
Figure 1.
Experimental apparatus used for loading of the shear fatigue specimens. Digital image correlation measurements were made at discrete points on each side of the interface, indicated here as white squares.
Shear Fatigue Testing and Analysis
Fatigue testing was performed in load control using a sinusoidal loading regime with R-ratio of 0.1 and a loading frequency of 3 Hz. DIC image data were collected at 10, 100, 1000, 3000, 10000, 33000, and 50000 cycles or until an external LVDT limit reached 0.185 mm. The LVDT limit on motion was chosen to impart damage to the specimens without causing complete fracture. At each designated sampling cycle (n), the loading rate was reduced to 0.25 Hz, and the CCD camera was synchronized with the mechanical test frame with images captured at 5Hz to result in approximately 20 DIC image sequences at each sampling cycle. If the specimens reached the external LVDT limit, the test was stopped, and a final low-load test was attempted to determine the final mechanical response.
Fatigue load magnitude was based on the initial stiffness of the specimen (ki), from which an estimate of single-cycle shear strength was determined (from a series of preliminary static tests to relate specimen stiffness to shear strength). Applied fatigue stress was then chosen as 50% of the estimated shear strength, so that specimens with greater initial stiffness had a higher applied load. A total of 25 specimens were used for fatigue testing.
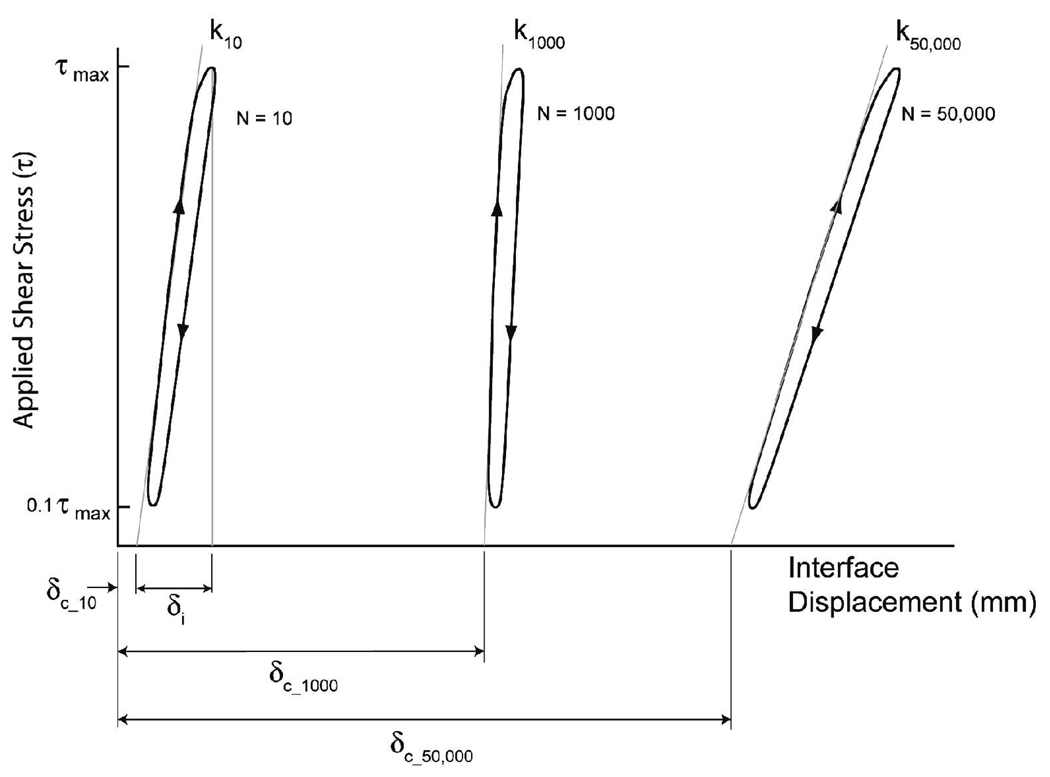
The interface shear stiffness (kn) was determined at each sampling cycle (n) by determining the slope through the rising shear stress versus DIC-based interface displacement data (Figure 2). The interface creep displacement at each sampling cycle (δc_n) was then calculated as the intersection of the shear stiffness line with the x-axis. The interface displacement (δi) during loading was determined for each sampling cycle as the difference between the peak displacement and the creep displacement (see Figure 2).
Figure 2.
Definitions used to describe shear fatigue response of the cement-bone interface.
Measuring Fatigue Induced Cement-Bone Damage
The initial (pre-test) and final damage to the cement and bone was determined for each fatigue loaded test specimen. Prior to fatigue loading, to document bone damage, specimens were immersed in 0.1% calcein for 12 hours followed by a 10 minute rinse in deionized water. Specimen surfaces were then sanded to remove surface stain, revealing any microcracks in bone. Next, specimens were immersed in a fluoresecent dye penetrant (Aquackeck, Sherwin Inc, South Gate, CA) for 10 minutes followed by a 10 minute rinse. Epifluorescence image capture was performed at 5.8 micron resolution for all four faces of the specimen containing the interface between cement and bone. Following fatigue testing, this same procedure was repeated to document post-test damage to cement and bone.
Cement and bone cracks were manually traced and measured for length (Image Pro, Media Cybernetics, Bethesda, MD). Crack number, average length, and length sum were determined from the four exposed faces of each specimen. The initial and final image sets were superimposed to allow for discrimination of new crack versus growth from pre-existing cracks. Measurements were divided into pre-existing cracks (before loading), growth from preexisting cracks, new cracks, and total crack growth. Total crack growth was the sum of growth from preexisting cracks and new cracks.
Statistical analysis and development of power-law models
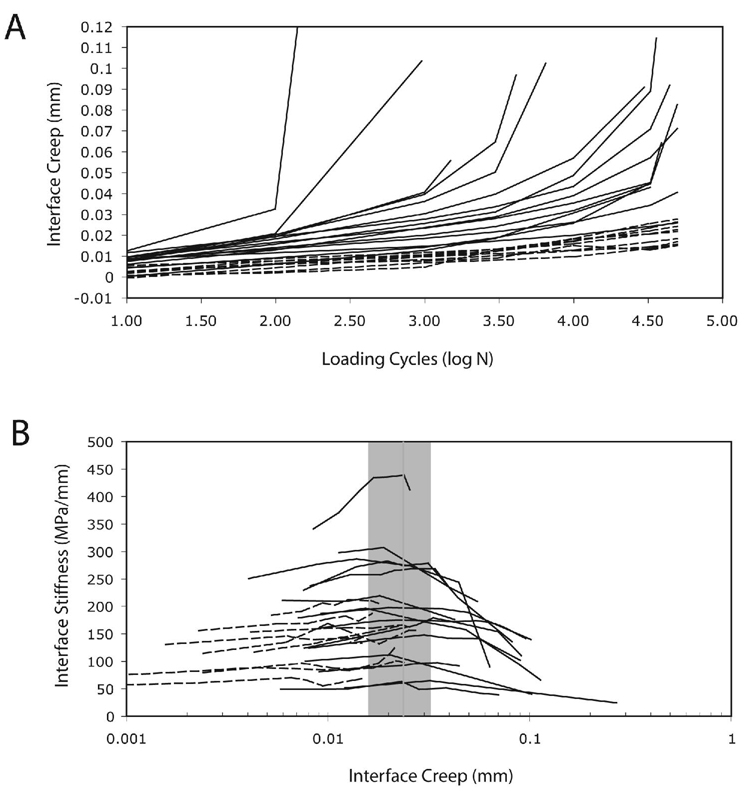
Based on the observation that there was often a maxima in the stiffness response during shear fatigue loading (see Figure 5B), the relationship between interface stiffness and interface creep was fit to a cubic curve and the interface creep at the maximum stiffness for each specimen was estimated by finding the maxima along this curve. This was defined as the interface creep at the stiffness maxima. Step-wise power-law regression models were used to relate the interface creep response (dependent variable) with normalized applied displacement (δI = τmax/ki), number of loading cycles (n) and interface contact area (CA) as shown in Equation 1.
| Eqn 1 |
Figure 5.
Interface creep as a function of loading cycles for the shear fatigue loaded specimens (A). Straight lines are drawn between individual DIC data points. Interface stiffness as a function of interface creep for the fatigue loaded shear specimens (B). Mean (vertical line) and standard deviation limits (bounds of box) for the interface creep that corresponds to the stiffness maxima point is included. Solid data lines represent specimens with clear reductions in stiffness during the later stages of loading. Dashed data lines represent specimens that did not have a clear reduction in stiffness during the later stages of fatigue loading.
Additional step-wise regression models were used to relate changes in interface stiffness (k) with interface creep damage response (δc) and interface contact area (CA) as shown in Equation 2. This response was divided into rising stiffness and falling stiffness components.
| Eqn 2 |
Finally, paired t-tests were used to compare damage to the cement and the bone (length sum measurements) with Bonferroni corrections for multiple sampling.
Results
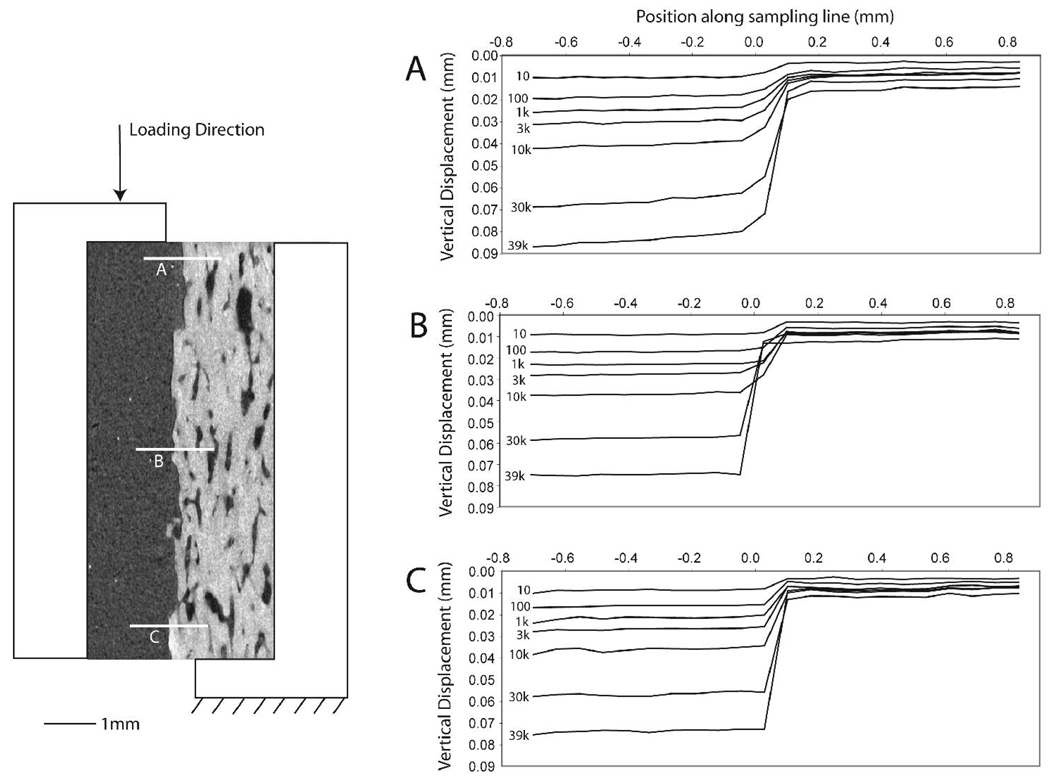
Of the 25 fatigue test specimens, 13 completed the 50,000 cycle loading protocol, 9 reached the LVDT limit and the test was suspended, and three specimens reached the LVDT limit, but fractured prior to the final DIC measurement set. General descriptive statistics for the experiments are listed in Table 1. The DIC response (Figure 3) illustrated a clear discontinuity in the displacement field at the cement-bone interface during the fatigue loading process. In addition, the response at the top, middle, and bottom sampling regions indicated that there was a near uniform shear displacement response along the interface. The shear displacements of the bulk cement and bone were negligible.
Table 1.
Descriptive statistics of the experiment test parameters from the cement-bone shear fatigue tests (24 specimens).
| Test Parameter | Mean | Standard Deviation | Minimum | Maximum |
|---|---|---|---|---|
| Estimated strength (MPa) | 4.86 | 3.07 | 0.59 | 11.60 |
| Interface stiffness (kI, MPa/mm) | 147.9 | 77.8 | 47.9 | 340.2 |
| Applied stress (τmax, MPa) | 2.43 | 1.53 | 0.28 | 5.82 |
| Number of loading cycles (n) | 36,800 | 19,700 | 259 | 50,000 |
| Initial interface displacement (δi, mm) | 0.016 | 0.005 | 0.004 | 0.024 |
| Contact area (CA, mm2) | 46.1 | 27.5 | 6.94 | 100.7 |
| Interface creep at stiffness maxima (mm) | 0.024 | 0.009 | 0.014 | 0.04 |
| Interface creep at end of test (mm) | 0.079 | 0.055 | 0.015 | 0.272 |
Figure 3.
Digital image correlation (DIC) measure of vertical displacement at three sampling lines across the cement-bone interface (A, B, and C) for a representative sample. The large jump in displacement occurs at the interface between cement and bone in each case. The number of loading cycles for each line is indicated and data are shown for the beginning of the loading cycle (10% of maximum load) in each instance.
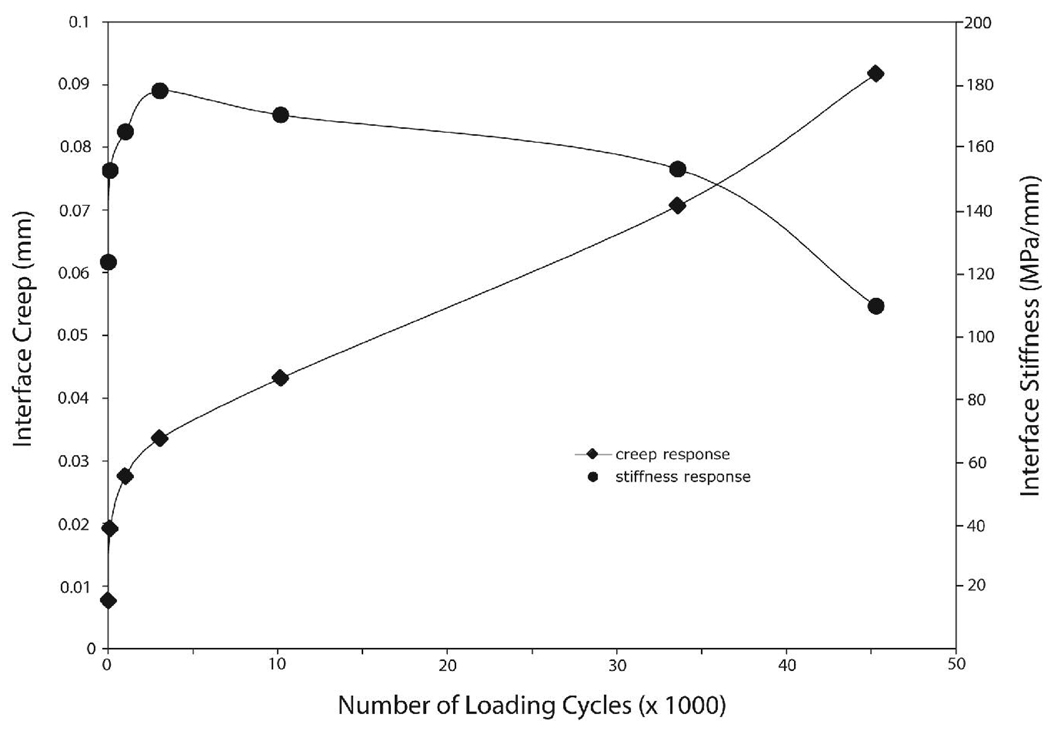
The general shear fatigue response (Figure 4) was characterized by changes in both the interface creep response and interface stiffness response. The creep damage response followed the traditional power-law type response with an initial large early creep response, followed by a steady creep rate; this response represents the first two phases of the three phase failure response (14). The stiffness response followed an early increase in stiffness to a peak in stiffness, followed by a gradual decrease in stiffness suggesting an accumulation of mechanical damage with the number of loading cycles. In many specimens the maxima of the interface stiffness corresponded to the inflection of the creep response (e.g. Figure 4).
Figure 4.
Example of interface creep and stiffness response as a function of loading cycles measured by DIC for shear fatigue loaded specimens.
There was a wide range of interface creep responses (Figure 5A). Interface stiffness plotted as a function of interface creep (Figure 5B) revealed a maxima in the stiffness response for 15 of the 25 shear fatigue specimens. The interface creep at the maxima of stiffness occurred over a relatively small range of creep magnitudes (0.024 mm ± 0.009 standard deviation). Hence, there seemed to be a creep limit beyond which the specimen deteriorated leading to a reduction in stiffness. Note that the specimens that did not have a maxima in stiffness generally did not reach the 0.024 mm interface creep level.
Using the regression models, the creep damage response followed a power-law response with significant contributions from the normalized applied displacement (δI = τmax/ki), number of loading cycles (n), and interface contact area (CA) (Table 2). Greater initial applied interface displacement (p<0.0001), greater number of loading cycles (p<0.0001), and lesser interface contact areas (p<0.0001) contributed to greater interface creep magnitudes. Overall, 68% of the interface creep response could be explained by these three parameters (r2=0.68, p<0.0001). The third and final phase of rapid increases in creep damage with continued cyclic loading was noted in a number of the specimens (Figure 5A), suggesting that failure was imminent in specimens that had interface creep magnitudes in the 50 to 100 micron range.
Table 2.
Power law regression parameters for interface creep and interface stiffness response. For each regression coefficient, mean and standard error of the mean are shown along with regression coefficient p-values. The overall regression summary is shown in the right column.
| Damage Response | J | K | L | M | Regression Correlation |
|---|---|---|---|---|---|
| Interface creep response | 0.57 ± 0. 34 | 1.35 ± 0.14 | 0.24 ± 0.02 | −0.40 ± 0.08 | R2 = 0.68 |
| (mm) | (p=0.100) | (p<0.0001) | (p<0.0001) | (p<0.0001) | (p<0.0001) |
| Rising interface stiffness | 1.77 ± 0.14 | 0.12 ± 0.05 | 0.40 ± 0.05 | R2 = 0.46 | |
| response | (p<0.0001) | (p=0.0155) | (p<0.0001) | (p<0.0001) | |
| (δc<0.024 mm, MPa/mm) | |||||
| Falling interface stiffness | 0.52 ± 0.15 | −0.46 ± 0.09 | 0.63 ± 0.07 | R2 = 0.73 | |
| response | (p=0.0011) | (p<0.0001) | (p<0.0001) | (p<0.0001) | |
| (δc>0.024 mm, MPa/mm) |
The regression model for the stiffness response was divided into two components using the interface creep at the stiffness maxima (24 microns of creep) as a dividing point (Table 2; Figure 5.B). For the rising interface stiffness response, we found that greater interface stiffness (r2=0.46, p<0.0001) was associated with increasing interface creep (p=0.0155) and greater contact area (p<0.0001). For the falling interface stiffness response, we found that greater interface creep (p<0.0001) and lower contact area (p<0.0001) contributed to decreased interface stiffness (p<0.0001, r2=0.73).
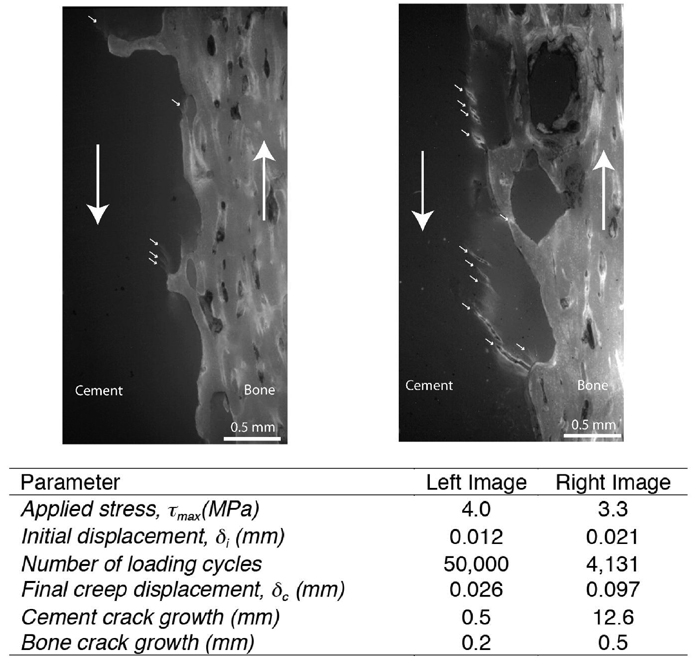
Fatigue damage (Figure 6) resulted in cracks in the cement that were orientated at 45 degrees to the loading direction, consistent with a shear damage response (4). Cracks in the cement and bone occurred close to the interface in all cases. Significantly more pre-existing damage was found in the cement when compared to the bone (p=0.0003) as measured by crack length sum (Table 3). The majority of crack growth was from new cracks (83% of length sum for cement and 77% for bone). There were significantly more new cracks and total crack growth in the cement when compared to the bone (p=0.0052). Cracks were generally short (average less than 0.10 mm in length) and were much more numerous in the cement when compared to the bone. There was a weak, but significant correlation (r2=0.33, p=0.01) between interface creep at the end of the test and crack growth in the cement. There was no correlation between interface creep at the end of the test and crack growth in the bone (r2=0.02, p=0.60).
Figure 6.
Examples of post-fatigue loaded specimens reveal micro-damage to the cement (small arrows) for a specimen with minimal damage (left) and extensive damage (right). The large arrows indicate shear loading direction.
Table 3.
Micro-crack data for the cement and bone. Mean and standard deviation values (in parentheses) are shown for 19 cement-bone fatigue specimens. The Bonferroni corrected p-values are for paired t-tests of length sums between cement and bone.
| Pre-existing cracks |
Growth from pre-existing cracks |
New Cracks | Total Crack Growth |
||
|---|---|---|---|---|---|
| Crack Number (N) | Cement | 93 (62) | 40 (34) | ||
| Bone | 11 (16) | 5 (4) | |||
| Average Length (mm) | Cement | 0.09 (0.03) | 0.07 (0.02) | ||
| Bone | 0.08 (0.06) | 0.09 (0.06) | |||
| Length Sum (mm) | Cement | 9.28 (7.27) | 0.59 (2.25) | 2.96 (2.55) | 3.54 (3.66) |
| Bone | 1.05 (1.72) | 0.13 (0.22) | 0.43 (0.40) | 0.56 (0.56) | |
| Bonferroni Corrected P-value | 0.0003 | 0.399 | 0.0009 | 0.0052 |
Discussion
The damage response of the cement-bone interface was characterized by creep damage that localized to the contact interface between cement and bone. Initial creep damage was associated with stiffening of the structure suggesting that early in the loading process there was a locking-in effect. As creep damage continued to accumulate, beyond some limit, there was a decrease in interface stiffness. This limit level was confined to a relatively constant magnitude suggesting that there was some physical interface displacement level above which the damage response changes from a locking-in effect to a loss of stiffness combined with a greater creep damage response. It is possible that this initial rise in stiffness is due to initial closing of gaps at the cement-bone interface. It is also possible that the creep response of the bulk cement or bone contribute to the increase in stiffness by allowing for better conformity at the interface. Computational modeling efforts that include the microstructure of the interface and relevant damage and creep models of the bulk materials will be crucial to aid our understanding of the physical phenomena measured in these experiments.
We found that the interface creep damage response could be related positively to loading magnitude, number of loading cycles, and for interface morphologies that had reduced contact between the cement and bone. The finding that loading magnitude and number of loading cycles contribute to interface creep response has been previously reported (14), although interface motion was inferred from global specimen response. The greater interface creep response for specimens with less cement-bone contact suggests that the creep behavior is related to the size and distribution of gaps at the interface. The results of the present study also show that the changes in interface stiffness could be related to the progression of interface creep and the interface contact area. Higher interface stiffness was associated with increased contact area which is consistent with previous work relating interface contact area and interface stiffness (18).
There was more micro-crack damage to the cement when compared to the bone and this was focused at the contact interface. Away from the interface there was not appreciable damage. Further, specimens with a larger final interface creep displacement also tended to have more cement damage. The amount of cement damage was quite variable and there are likely many other factors that contribute to the amount of cement damage including details of the interface morphology, load level, and number of loading cycles. But these factors likely interact in ways that cannot be captured by simple regression relationships. Models that can incorporate cement damage from fatigue loading (23) may be very useful in understanding these interactions and also how the damage is related to changes in interface stiffness and creep.
There are several limitations to this work, with lack of a biological response to accompany the fatigue process as a primary limitation. It is likely that bony remodeling changes based on stress and local fluid pressure levels would effect the damage response of the interface (2). This work was based on laboratory prepared specimens and that these specimens may not represent the full spectrum of cement-bone interfaces prepared in clinical practice. Specifically, these specimens were prepared with ideal conditions for bone preparation, distal plugging and cement pressurization. Therefore, these specimens likely represent optimal cement-bone interface conditions. The shear loading conditions, while relevant, were restricted to one plane of motion (longitudinal), and other complex mixed-mode loading conditions would certainly alter the fatigue damage response.
The contact estimates made here using micro CT likely overestimate the true contact area between the cement and bone. In a preliminary study, the CT dilation/intersection approach was compared to a stereology approach on the same CT data sets. While there was a strong correlation between the two approaches (r = 0.87), the CT dilation/intersection approach resulted in 36% greater average contact areas when compared to a stereology approach. Because both techniques are limited to the 12 micron resolution of the CT scanner, it is likely that small gaps (< 10 microns) between cement and bone are not included in these measurements.
There has been substantial interest in developing pre-clinical models to understand the loosening mechanisms of joint replacements. Waide and coworkers (25, 26) have developed a mechanical analog of loosened cement-bone interfaces through inclusion of a silicone elastomer at the interface. While this approach provides information regarding the end stages of the biological process to loosening, it cannot fully describe the loosening process. Efforts have been made to develop finite element based damage models (19, 20) for the cement-bone interface using existing experimental data (13, 14). The modeling approaches appear promising and could be improved further through the data produced in this study that does not have the confounding effects of micromotion measurements away from the interface. Indeed, when we compared the external LVDT measurements with local interface motions measured using digital image correlation, we found average errors in the measurement of final creep damage of 53%. That is, the LVDT measurement was always larger than the actual interface motion (average: 0.018mm; range: 0 to 0.060mm). This is likely due to micromotions that can occur at the specimen grips.
The results from this study suggest that if creep damage could be limited to below approximately 24 microns at the cement-bone interface, there would be little chance of loss of fixation at this interface. Functionally this could be achieved by reducing stress magnitudes at the cement-bone interface through optimization of stem design and stem placement, reduction in patient weight, reducing number of loading cycles (although this would generally be impractical), and by improving interlock between cement and bone. The mechanical interlock is perhaps the only factor in which the surgeon has control via improved cementing techniques that encourage cement apposition with the bone. Migrations of this low level (24 microns) would be difficult to measure clinically, even with the higher resolution capabilities of radiostereometric (RSA) analysis. Therefore, failure of this interface in the early stages would be difficult to detect. In addition, the fact the cement damage was prevalent at the cement-bone interface from fatigue loading suggests that cement is not fully optimized to support realistic loading conditions. Efforts to improve fatigue crack propagation characteristics of the bulk cement could also improve the strength of the cement-bone interface.
In summary, for the cement-bone interface subjected to shear fatigue loading we found that stiffness and creep damage were localized to the contact interface between cement and bone. Interface creep damage followed a three-phase response with an initial rapid increase in creep, followed by a steady state increase, concluding in a final rapid increase in creep. The initial creep phase was accompanied by an increase in interface stiffness suggesting that there was an initial locking-in affect at the interface. Following this, there was decrease in interface stiffness as further creep damage to the interface progressed. Power law models were reasonably successful in describing the creep and stiffness damage response and were found to be a function of loading magnitude, number of loading cycles, and contact area at the cement-bone interface. Finally, there was more damage to the cement when compared to the bone and this was localized along the interface.
Acknowledgements
This work was funded by NIH AR42017.
Contributor Information
Kenneth A. Mann, Department of Orthopaedic Surgery, SUNY Upstate Medical University, Syracuse, New York, USA
Mark A. Miller, Department of Orthopaedic Surgery, SUNY Upstate Medical University, Syracuse, New York, USA
Amos Race, Department of Orthopaedic Surgery, SUNY Upstate Medical University, Syracuse, New York, USA
Nico Verdonschot, Orthopaedic Research Laboratory, Radboud University Nijmegen Medical Centre, Nijmegen, The Netherlands
References
- 1.Aspenberg P, Goodman S, Toksvig-Larsen S, Ryd L, Albrektsson T. Intermittent micromotion inhibits bone ingrowth. Titanium implants in rabbits. Acta Orthop Scand. 1992;63:141–145. doi: 10.3109/17453679209154809. [DOI] [PubMed] [Google Scholar]
- 2.Aspenberg P, Van der Vis H. Migration, particles, and fluid pressure. A discussion of causes of prosthetic loosening. Clin Orthop Relat Res. 1998:75–80. [PubMed] [Google Scholar]
- 3.Bean DJ, Convery FR, Woo SL-Y, Lieber RL. Regional variations in shear strength of the bone-polymethylmethacrylate interface. J Arthroplasty. 1987;2:293–298. doi: 10.1016/s0883-5403(87)80062-1. [DOI] [PubMed] [Google Scholar]
- 4.Boresi AP, Schmidt RJ, Sidebottom OM. Advanced Mechanics of Materials. New York: Wiley; 1993. [Google Scholar]
- 5.Boss JH, Shajrawi I, Dekel S, Mendes DG. The bone-cement interface: histological observations on the interface of cemented arthroplasties within the immediate and late phases. J Biomater Sci Polym Ed. 1993;5:221–230. doi: 10.1163/156856293x00311. [DOI] [PubMed] [Google Scholar]
- 6.Bugbee WD, Barrera DL, Lee AJC, Convery FR. Variations in shear strength of the bone-cement interface in the proximal femur. Trans Orthop Res Soc. 1992;17:22. [Google Scholar]
- 7.Dohmae Y, Bechtold JE, Sherman RE. Reduction in cement-bone interface shear strength between primary and revision arthroplasty. Clin. Orthop. 1988;236:214–240. [PubMed] [Google Scholar]
- 8.Goodman S, Aspenberg P. Effect of amplitude of micromotion on bone ingrowth into titanium chambers implanted in the rabbit tibia. Biomaterials. 1992;13:944–948. doi: 10.1016/0142-9612(92)90118-8. [DOI] [PubMed] [Google Scholar]
- 9.Hori RY, Lewis JL. Mechanical properties of the fibrous tissue found at the bone-cement interface following total joint replacement. J Biomed Mat Res. 1982;16:911–927. doi: 10.1002/jbm.820160615. [DOI] [PubMed] [Google Scholar]
- 10.Jeffers JR, Browne M, Lennon AB, Prendergast PJ, Taylor M. Cement mantle fatigue failure in total hip replacement: Experimental and computational testing. J Biomech. 2007;40:1525–1533. doi: 10.1016/j.jbiomech.2006.07.029. [DOI] [PubMed] [Google Scholar]
- 11.Karrholm J, Borssen B, Lowenhielm G, Snorrason F. Does early micromotion of femoral stem prostheses matter? 4–7-year stereoradiographic follow-up of 84 cemented prostheses. J Bone Joint Surg Br. 1994;76:912–917. [PubMed] [Google Scholar]
- 12.Karrholm J, Herberts P, Hultmark P, Malchau H, Nivbrant B, Thanner J. Radiostereometry of hip prostheses. Review of methodology and clinical results. Clin Orthop Relat Res. 1997:94–110. [PubMed] [Google Scholar]
- 13.Kim D-G, Miller MA, Mann KA. Creep dominates tensile fatigue damage of the cement-bone interface. J Orthop Res. 2004;22:633–640. doi: 10.1016/j.orthres.2003.09.007. [DOI] [PubMed] [Google Scholar]
- 14.Kim D-G, Miller MA, Mann KA. A fatigue damage model for the cement-bone interface. J Biomech. 2004;37:1505–1512. doi: 10.1016/j.jbiomech.2004.01.011. [DOI] [PubMed] [Google Scholar]
- 15.Kusleika R, Stupp SI. Mechanical strength of poly(methyl methacrylate) cement-human bone interfaces. J of Biomedical Mat Res. 1983;17:441–458. doi: 10.1002/jbm.820170305. [DOI] [PubMed] [Google Scholar]
- 16.Kwong LM, Jasty M, Mulroy RD, Maloney WJ, Bragdon C, Harris WH. The histology of the radiolucent line. J Bone Joint Surg Br. 1992;74:67–73. doi: 10.1302/0301-620X.74B1.1732269. [DOI] [PubMed] [Google Scholar]
- 17.MacDonald W, Swarts E, Beaver R. Penetration and shear strength of cement-bone interfaces in-vivo. Clin Ortho Rel Res. 1993;286:283–288. [PubMed] [Google Scholar]
- 18.Mann KA, Miller MA, Cleary RJ, Janssen D, Verdonschot N. Experimental micromechanics of the cement-bone interface. J Orthop Res. 2008 doi: 10.1002/jor.20575. [DOI] [PMC free article] [PubMed] [Google Scholar]
- 19.Moreo P, Garcia-Aznar JM, Doblare M. A coupled viscoplastic rate-dependent damage model for the simulation of fatigue of cement-bone interfaces. Int J Plasticity. 2007;23:2058–2084. [Google Scholar]
- 20.Moreo P, Pérez MA, García-Aznar JM, Doblaré M. Modelling the mixed-mode failure of cement-bone interfaces. Engineering Fracture Mechanics. 2006;73:1379–1395. [Google Scholar]
- 21.Race A, Miller MA, Clarke MT, Mann KA, Higham PA. The effect of low-viscosity cement on mantle morphology and femoral stem micromotion: A cadaver model with simulated blood flow. Acta Orthop. 2006;77:6007–6616. doi: 10.1080/17453670610012683. [DOI] [PubMed] [Google Scholar]
- 22.Stolk J, Maher SA, Verdonschot N, Prendergast PJ, Huiskes R. Can finite element models detect clinically inferior cemented hip implants? Clin Ortho Rel Res. 2003;409:138–150. doi: 10.1097/01.blo.0000058882.03274.5e. [DOI] [PubMed] [Google Scholar]
- 23.Stolk J, Verdonschot N, Murphy BP, Pendergast PJ, Huiskes R. Finite element stimulation of anisotropic damage accumulation and creep in acrylic bone cement. Engr Fract Mech. 2004;71:513–528. [Google Scholar]
- 24.Sundfeldt M, Carlsson LV, Johansson CB, Thomsen P, Gretzer C. Aseptic loosening, not only a question of wear: a review of different theories. Acta Orthop. 2006;77:177–197. doi: 10.1080/17453670610045902. [DOI] [PubMed] [Google Scholar]
- 25.Waide V, Cristofolini L, Stolk J, Verdonschot N, Boogaard GJ, Toni A. Modeling the fibrous tissue layer in cemented hip replacements: experimental and finite element methods. J Biomech. 2004;37:13–26. doi: 10.1016/s0021-9290(03)00258-6. [DOI] [PubMed] [Google Scholar]
- 26.Waide V, Cristofolini L, Toni A. An experimental analogue to model the fibrous tissue layer in cemented hip replacements. J Biomed Mater Res B Appl Biomater. 2004;69:232–240. doi: 10.1002/jbm.b.30004. [DOI] [PubMed] [Google Scholar]


