Abstract
Heme-a, is the heme prosthetic group of cytochrome c oxidase (COX), the terminal complex of the mitochondrial electron transport chain. We measured heme-a levels in postmortem brain tissue from nine patients diagnosed with dementia: Alzheimer’s disease (AD) was the primary diagnosis in five, AD/Diffuse Lewy body disease (DLBD) was diagnosed in two, DLBD was diagnosed in one, and DLBD (severe)/AD (mild) was diagnosed in one. Eight non-demented patients who died from non-neurological causes served as controls. When the primary diagnosis was AD (AD and AD/DLBD), levels of cerebral heme-a were increased almost two-fold on a protein basis compared to controls (p<0.001). Using perfused and unperfused rats we showed that measured levels of cerebral heme-a were unaffected by the presence of blood in brain tissue. In mice we showed that levels of cerebral heme-a were unaffected by 24 hours of storage at 4°C prior to freezing. These animal studies suggest that increased levels of cerebral heme-a in AD were not due to blood in postmortem brain or variation in postmortem interval.
Keywords: heme, heme-a, heme-b, Alzheimer’s disease, cytochrome c oxidase, cytochrome oxidase subunit 1, Cox-1
INTRODUCTION
Heme-a, is the heme prosthetic group of cytochrome c oxidase (COX) (ferrocytochrome c: oxygen oxidoreductase; EC 1.9.3.1), which is the terminal enzyme complex of the mitochondrial electron transport chain [22]. During mitochondrial heme-a synthesis, the porphyrin ring of iron protoporphyrin IX (referred to here as heme-b) is modified by addition of a farnesyl group at C-2 and oxidation of a methyl group at C-8 to a formyl group [17]. Mammalian COX contains thirteen protein subunits [4, 10, 11]. COX subunit 1 (Cox-1), which is part of the catalytic core of COX, contains two noncovalently bound molecules of heme-a [10, 11]. Previously, Atamna and Frey suggested that heme-a biosynthesis may be impaired in AD [1]. A finding of decreased cerebral heme-a in AD would be consistent with other data that indicate mitochondrial damage and dysfunction is involved in AD pathophysiology [2, 18]. Here we investigated whether cerebral heme-a is decreased in AD. In contrast to Atamna and Frey who reported no difference in levels of cerebral heme-a between AD and controls [1], we found that cerebral heme-a was increased in AD.
MATERIALS AND METHODS
Human brain tissue was obtained at autopsy by the Case Western Reserve University Brain Bank under an IRB-approved protocol, from clinically and pathologically confirmed cases of AD using criteria established by the National Institute of Aging (NIA) and Consortium to Establish a Registry for Alzheimer’s Disease (CERAD) [13]. Samples of frontal cortex were shipped on dry ice to the VA Medical Center and stored at -80°C until used. The brain samples had been coded prior to shipment to keep laboratory personnel blinded as to diagnosis. Investigators at the VA Medical Center were blind to the clinical status of the samples until analysis was complete. Young adult C57BL/6 mice and Fisher 344 rats were purchased from Charles River Laboratories, Inc. (Wilmington, MA). Procedures involving animals were carried out under an approved Institutional Animal Care and Use Committee protocol.
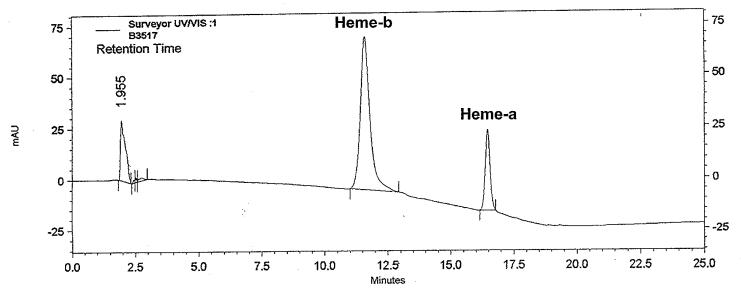
Measurement of heme-a and heme-b was performed as described by Tzagoloff et al [23], and Sinclair, and Gorman [21]. Brain tissue was homogenized in 4 volumes ice-cold 0.1M sodium phosphate, pH 7.4, containing 1mM EDTA, 0.5% Tween-20 and 10μl/ml protease inhibitor cocktail set III (Calbiochem, San Diego, CA). Hemes were extracted from brain tissue with five volumes of concentrated HCl/acetone (2.5 / 97.5; v/v). Extracts were clarified by centrifugation at 12,000 × g for 10 minutes and supernatants were diluted with an equal volume of Buffer A, pH 3-4 [21]. Hemin (Calbiochem, San Diego, CA) was dissolved in DMSO. The concentration of this stock solution was determined from its absorbance at 400 nm using a millimolar extinction coefficient of 180 [21]. Working standards were prepared by diluting hemin stock solution with Buffer A [21]. Heme-a was separated from heme-b with a 70-100% linear gradient of methanol in phosphate buffer, pH 3.15 (15 min) on a 0.4 × 30cm C18 μBondapak reverse phase column (Waters Corp., Milford, MA) using a ThermoFinnigan Surveyor HPLC system [21]. Hemes were detected and quantified by absorbance at 405 nm. Figure 1 shows a typical separation. The symmetrical peaks for heme-a and heme-b suggest any modified (partially degraded) forms of either heme-a or heme-b are present in negligible amounts. The statistical significance of differences between AD and controls was determined by Student’s t-test using SigmaStat 3.1 statistical analysis software.
Figure 1.
HPLC separation of cerebral heme-a and heme-b. Chromatogram depicts typical HPLC separation of heme-a and heme-b extracted from brain.
RESULTS
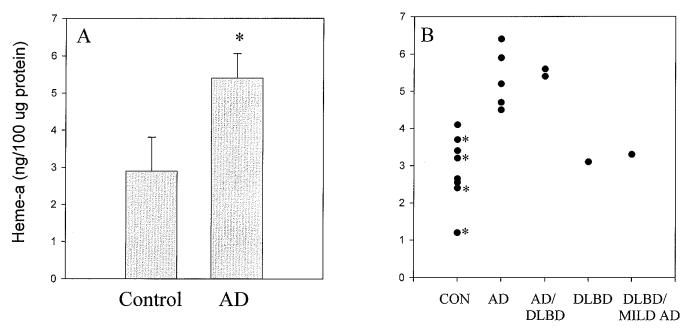
We obtained post-mortem brain tissue from nine patients diagnosed with dementia (mean age 78.4±5 years): AD was the primary diagnosis in five, AD/Diffuse Lewy body disease (DLBD) was diagnosed in two, DLBD was diagnosed in one, and DLBD (severe)/AD (mild) was diagnosed in one. Eight non-demented patients who died from non-neurological causes served as controls. Their mean age was 46.8±21 years, which included four cases over the age of 64. The postmortem interval ranged from 3-10 hours for demented cases and from 3-22 hours for control cases. When the primary diagnosis was AD (AD and AD/DLBD), cerebral heme-a was increased almost two-fold on a protein basis compared to controls (p<0.001) (Figure 2A). Figure 2B shows values for cerebral heme-a in a scatter plot that indicates the ages of the subjects. The difference in heme-a might be accounted for by the relatively lower ages of the controls. However, the Spearman rank order correlation coefficient comparing heme-a levels and ages of control subjects was -0.70 (p<0.05), which indicates that cerebral heme-a levels decreased with increasing age.
Figure 2.
Cerebral heme-a is increased in frontal cortex in AD. Alzheimer’s disease was the primary diagnosis in five cases (AD), AD/Diffuse Lewy body disease (AD/DLBD) was diagnosed in two cases, DLBD was diagnosed in one case, and DLBD (severe)/AD (mild) (DLBD/MILD AD) was diagnosed in one case. Controls (CON) were eight non-demented individuals who died from non-neurological causes. Heme-a is expressed as ng/100μg protein (mean ± S.D.). 2A. Heme-a content was increased in cortex from individuals whose primary diagnosis was AD (AD and AD/DLBD, 5.4±0.66, n=7) compared to non-demented controls (2.9±0.91, n=8): p<0.001. 2B. Scatter plot shows cerebral heme-a in individual samples. * indicates samples obtained from individuals aged over 64 years.
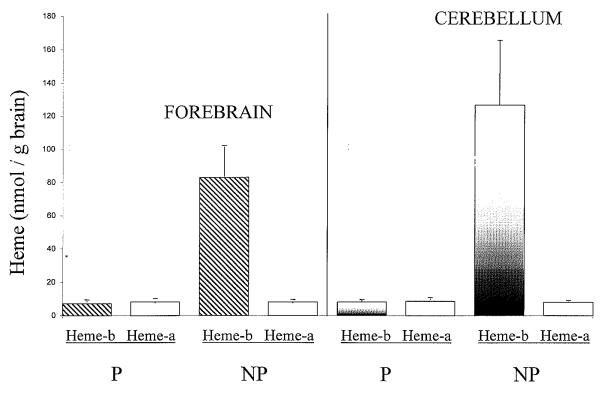
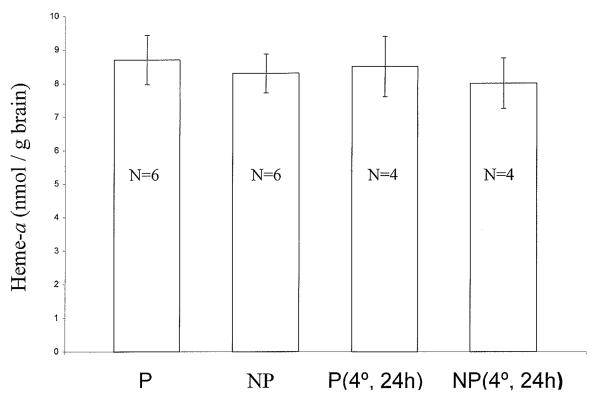
We examined two factors that might affect the measurement of cerebral heme-a: unavoidable contamination of postmortem human brain tissue with blood, and the postmortem interval until tissue is frozen. In blood, heme-a is present only in white cells and platelets [1]. Figure 3 shows that the same levels of heme-a were measured in forebrains of perfused and non-perfused rats, indicating that blood contamination of human postmortem brain samples did not affect the measurement of cerebral heme-a levels. In this experiment, rats were used because of the relative ease of perfusion to remove blood from brain. We also measured heme-b in the same samples of rat forebrain. Blood contamination affects estimates of levels of cerebral heme-b because heme-b is also the prosthetic group of hemoglobin. Figure 3 shows that the levels of cerebral heme-b were 10-15 times greater in non-perfused rats compared to perfused rats (Figure 3). This result indicates that when cerebral heme-b is to be measured, it is essential to correct brain heme-b levels for blood-derived heme-b [1]. We also investigated whether heme-a is stable in postmortem brain tissue because the postmortem interval for control samples in this study was relatively longer than for AD samples. Unperfused, anesthetized mice were decapitated. Forebrains were removed and were either frozen at -80°C immediately or refrigerated for 24 hours at 4°C before freezing. The level of heme-a in mouse brain was unchanged by 24 hours of refrigeration before freezing, compared to immediate freezing (Figure 4). This suggests that variation in postmortem interval for human autopsy material did not affect levels of heme-a in AD and control brain samples.
Figure 3.
Blood contamination of brain does not affect measurement of rat cerebral heme-a. Rats were perfused with heparinized saline, followed by saline alone. Effectiveness of cerebral perfusion was confirmed by visual examination of dissected brain for residual blood. Hemes were extracted from forebrain of perfused (P) and non-perfused (NP) rats. Heme-a and heme-b were separated by HPLC and quantified as described in Materials and Methods. Heme-a and heme-b are expressed as nmol/g brain wet weight (mean ± S.D., n=3).
Figure 4.
Cerebral heme-a is stable in postmortem mouse forebrain. Forebrains dissected from perfused (P) and nonperfused (NP) mice were either immediately frozen at -80°C [P and NP], or were refrigerated 24 hours before freezing [P(4°, 24h) and NP(4°, 24h)]. Extracted heme-a was separated by HPLC and quantified as described in Materials and Methods. Heme-a is expressed as nmol/g brain wet weight ± S.D. Group size is indicated within the data columns.
DISCUSSION
Heme-a, the heme prosthetic group of COX, was increased almost two-fold in human frontal cortex when AD was the major diagnosis. This increase cannot be explained by the relatively lower age of the control cases compared to AD cases or by the relatively longer postmortem interval before freezing of control cases. However, it appears that when DLBD was the major diagnosis, (2 of 9 cases studied), the level of heme-a in frontal cortex was not different from controls. This finding needs to be replicated since there were only 2 cases studied Previously, Atamna and Frey reported that levels of cerebral heme-a were not significantly different in samples of AD temporal lobe compared to controls [1]. The present study, in contrast, found levels of heme-a were increased in AD frontal cortex. Whether these different results reflect differences in heme-a levels in different brain regions in AD, is unknown.
The significance of a two-fold increase in heme-a in AD frontal cortex is also not known. Cox-1, which is part of the catalytic core of COX (mitochondrial respiratory complex IV) binds heme-a. Thus, increased levels of cerebral heme-a in AD would be consistent with observations that expression of Cox-1 protein and mRNA are increased in AD [12, 15]. Nevertheless, with a few exceptions [5], COX activity has been found to be decreased in AD brain [6, 8, 9, 14, 16, 19, 20, 24, 25]. In AD brain, accumulation of Cox-1 protein and other mitochondrial markers in cell cytoplasm, and in autophagocytic vesicles associated with lipofuschin, has been reported [12, 26]. Autophagic vesicles of the type reported are associated with mitochondrial turnover [3]. Possibly, cerebral heme-a released from degraded COX complex accumulates because of increased mitochondrial damage in AD brain [7, 12, 26]. Whether metabolic turnover of heme-a is impaired in AD brain is unknown. Moreover, the mechanism of heme-a degradation is unknown (Mahin Maines, personal communication). If changes in heme-a in peripheral tissues mimic changes in brain, heme-a may be a useful biomarker in AD. Future studies will determine whether levels of cerebral heme-a distinguish AD from DLBD and from other conditions demonstrating AD-like pathology such as Down syndrome.
ACKNOWLEDGEMENTS
Supported by the Office of Research & Development, Medical Research Service, the Department of Veterans Affairs (BED, MLS, NG, and PRS), the National Institutes of Health (AG026151 to MAS and AG024028 to XWZ) and the Alzheimer’s Association (MAS, GP, XWZ). The authors also acknowledge Nicholas Jacobs and Judith Jacobs for valuable discussions on heme and heme metabolism, and the assistance of Jennifer R. Bean in preparation of the manuscript.
Abbreviations
- Aβ
amyloid beta peptide
- AD
Alzheimer’s disease
- COX
cytochrome c oxidase (mitochondrial respiratory complex IV)
- Cox-1
cytochrome c oxidase subunit 1
- DLBD
diffuse Lewy body disease
- heme-b
iron protoporphyrin IX (also called heme)
Footnotes
Publisher's Disclaimer: This is a PDF file of an unedited manuscript that has been accepted for publication. As a service to our customers we are providing this early version of the manuscript. The manuscript will undergo copyediting, typesetting, and review of the resulting proof before it is published in its final citable form. Please note that during the production process errors may be discovered which could affect the content, and all legal disclaimers that apply to the journal pertain.
REFERENCES
- [1].Atamna H, Frey WH. A role for heme in Alzheimer’s disease: Heme binds amyloid β and has altered metabolism. Proc. Natl. Acad. Sci. U.S.A. 2004;101:11153–11158. doi: 10.1073/pnas.0404349101. [DOI] [PMC free article] [PubMed] [Google Scholar]
- [2].Blass JP. The mitochondrial spiral. An adequate cause of dementia in the Alzheimer’s syndrome. Ann. N. Y. Acad. Sci. 2000;924:170–183. doi: 10.1111/j.1749-6632.2000.tb05576.x. [DOI] [PubMed] [Google Scholar]
- [3].Brunk UT, Jones CB, Sohal RS. A novel hypothesis of lipofuscinogenesis and cellular aging based on interactions between oxidative stress and autophagocytosis. Mutat. Res. 1992;275:395–403. doi: 10.1016/0921-8734(92)90042-n. [DOI] [PubMed] [Google Scholar]
- [4].Carr HS, Winge DR. Assembly of cytochrome c oxidase within the mitochondrion. Acc. Chem. Res. 2003;36:309–316. doi: 10.1021/ar0200807. [DOI] [PubMed] [Google Scholar]
- [5].Casademont J, Rodriguez-Santiago B, Miro O, Beato A, Lopez S, Nunes V, Cardellach F. Mitochondrial respiratory chain in brain homogenates: activities in different brain areas in patients with Alzheimer’s disease. Aging Clin. Exp. Res. 2004;17:1–7. doi: 10.1007/BF03337713. [DOI] [PubMed] [Google Scholar]
- [6].Chagnon P, Betard C, Robitaille Y, Cholette A, Gauvreau D. Distribution of brain cytochrome oxidase activity in various neurodegenerative diseases. NeuroReport. 1995;6:711–715. doi: 10.1097/00001756-199503270-00002. [DOI] [PubMed] [Google Scholar]
- [7].Castellani R, Hirai K, Aliev G, Drew KL, Nunomura A, Takeda A, Cash AD, Obrenovich ME, Perry G, Smith MA. Role of mitochondrial dysfunction in Alzheimer’s disease. J. Neurosci. Res. 2002;70:357–360. doi: 10.1002/jnr.10389. [DOI] [PubMed] [Google Scholar]
- [8].Cottrell DA, Blakely EL, Johnson MA, Ince PG, Turnbull DM. Mitochondrial enzyme-deficient hippocampal neurons and choroidal cells in AD. Neurology. 2001;57:260–264. doi: 10.1212/wnl.57.2.260. [DOI] [PubMed] [Google Scholar]
- [9].Cottrell DA, Borthwick GM, Johnson MA, Ince PG, Turnbull DM. The role of cytochrome c oxidase deficient hippocampal neurones in Alzheimer’s disease. Neuropathol. Appl. Neurobiol. 2001;28:390–396. doi: 10.1046/j.1365-2990.2002.00414.x. [DOI] [PubMed] [Google Scholar]
- [10].Fontanesi F, Soto IC, Horn D, Barrientos A. Assembly of mitochondrial cytochrome c oxidase, a complicated and highly regulated cell process. Am. J. Physiol. Cell Physiol. 2006;291:C1129–C1147. doi: 10.1152/ajpcell.00233.2006. [DOI] [PubMed] [Google Scholar]
- [11].Herrmann JM, Funes S. Biogenesis of cytochrome c oxidase — Sophisticated assembly lines in the mitochondrial inner membrane. Gene. 2005;354:43–52. doi: 10.1016/j.gene.2005.03.017. [DOI] [PubMed] [Google Scholar]
- [12].Hirai K, Aliev G, Nunomura A, Fujioka H, Russell RL, Atwood CS, Johnson AB, Kress Y, Vinters HV, Tabaton M, Shimohama S, Cash AD, Siedlak SL, Harris PLR, Jones PK, Petersen RB, Perry G, Smith MA. Mitochondrial abnormalities in Alzheimer’s disease. J. Neurosci. 2001;21:3017–3023. doi: 10.1523/JNEUROSCI.21-09-03017.2001. [DOI] [PMC free article] [PubMed] [Google Scholar]
- [13].Khachaturian ZS. Diagnosis of Alzheimer’s disease. Arch. Neurol. 1985;42:1097–1105. doi: 10.1001/archneur.1985.04060100083029. [DOI] [PubMed] [Google Scholar]
- [14].Kish SJ, Bergeron C, Rajput A, Dozic S, Mastrogiacomo F, Chang L-J, Wilson JM, DiStefano LM, Nobrega JN. Brain cytochrome oxidase in Alzheimer’s disease. J. Neurochem. 1992;59:776–779. doi: 10.1111/j.1471-4159.1992.tb09439.x. [DOI] [PubMed] [Google Scholar]
- [15].Manczak M, Park BS, Jung Y, Reddy PH. Differential expression of oxidative phosphorylation genes in patients with Alzheimer’s disease. Neuromolecular Med. 2004;5:147–162. doi: 10.1385/NMM:5:2:147. [DOI] [PubMed] [Google Scholar]
- [16].Maurer I, Zierz S, Moller H-J. A selective defect of cytochrome c oxidase is present in brain of Alzheimer disease patients. Neurobiol. Aging. 2000;21:455–462. doi: 10.1016/s0197-4580(00)00112-3. [DOI] [PubMed] [Google Scholar]
- [17].Moraes CT, Diaz F, Barrientos A. Defects in the biosynthesis of mitochondrial heme c and heme a in yeast and mammals. Biochim. Biophys. Acta. 2004;1659:153–159. doi: 10.1016/j.bbabio.2004.09.002. [DOI] [PubMed] [Google Scholar]
- [18].Moreira PI, Cardoso SM, Santos MS, Oliveira CR. The key role of mitochondria in Alzheimer’s disease. J. Alzheimers Dis. 2006;9:101–110. doi: 10.3233/jad-2006-9202. [DOI] [PubMed] [Google Scholar]
- [19].Mutisya EM, Bowling AC, Beal MF. Cortical cytochrome oxidase activity is reduced in Alzheimer’s disease. J. Neurochem. 1994;63:2179–2184. doi: 10.1046/j.1471-4159.1994.63062179.x. [DOI] [PubMed] [Google Scholar]
- [20].Parker WD, Parks J, Filley CM, Kleinschmidt-DeMasters BK. Electron transport chain defects in Alzheimer’s disease brain. Neurology. 1994;44:1090–1096. doi: 10.1212/wnl.44.6.1090. [DOI] [PubMed] [Google Scholar]
- [21].Sinclair PR, Gorman N. Measurement of heme concentration. Curr. Protocols Toxicol. 1999;1:8.3.1–8.3.7. doi: 10.1002/0471140856.tx0803s00. [DOI] [PubMed] [Google Scholar]
- [22].Smeitink J, van den Heuvel L, DiMauro SS. The genetics and pathology of oxidative phosphorylation. Nat. Rev. Genet. 2001;2:342–352. doi: 10.1038/35072063. [DOI] [PubMed] [Google Scholar]
- [23].Tzagoloff A, Nobrega M, Gorman N, Sinclair PR. On the functions of the yeast COX10 and COX11 gene products. Biochem. Mol. Biol. Int. 1993;31:593–598. [PubMed] [Google Scholar]
- [24].Valla J, Berndt JD, Gonzalez-Lima F. Energy hypometabolism in posterior cingulate cortex of Alzheimer’s patients: Superficial laminar cytochrome oxidase associated with disease duration. J. Neurosci. 2001;21:4923–4930. doi: 10.1523/JNEUROSCI.21-13-04923.2001. [DOI] [PMC free article] [PubMed] [Google Scholar]
- [25].Wong-Riley M, Antuono P, Khang-Cheng H, Egan R, Hevner R, Liebl W, Huang Z, Rachel R, Jones J. Cytochrome oxidase in Alzheimer’s disease: Biochemical, histochemical, and immunohistochemical analyses of the visual and other systems. Vision Res. 1997;37:3593–3608. doi: 10.1016/S0042-6989(96)00210-6. [DOI] [PubMed] [Google Scholar]
- [26].Zhu X, Perry G, Moreira PI, Aliev G, Cash AD, Hirai K, Smith MA. Mitochondrial abnormalities and oxidative imbalance in Alzheimer disease. J. Alzheimers Dis. 2006;9:147–153. doi: 10.3233/jad-2006-9207. [DOI] [PubMed] [Google Scholar]


