Abstract
Wave aberrations degrade the optical quality of the eye relative to the diffraction limit, but there are situations in which having slightly aberrated optics can provide some relative visual benefits. This fact led us to consider whether interactions among aberrations in the eye's wavefront produce an advantage for image quality relative to wavefronts with randomized combinations of aberrations with the same total RMS error. Total ocular wave aberrations from two experimental groups and corneal wave aberrations from one group were measured and expressed as Zernike polynomial expansions through the seventh-order. In a series of Monte Carlo simulations, modulation transfer functions (MTFs) for the measured wave aberrations were compared to distributions of artificial MTFs for wavefronts created by randomizing the sign or orientation of the aberrations, while maintaining the RMS error within each Zernike order. In a control condition, “synthetic” model eyes were produced by choosing each individual aberration term at random from individuals in the experimental group, and again MTFs were compared for original and randomized signs. Results were summarized by the MTF ratio: real MTF/mean simulated MTF, as a function of spatial frequency. For a 6 mm pupil, the mean MTF ratio for total ocular aberrations was greater than 1.0 up to 60 cycles per degree, suggesting that the eye's aberrations are not independent and that there may be a positive functional consequences to their interrelations. This positive relation did not hold for corneal aberrations alone, or for the synthetic eyes.
Keywords: Wave aberrations, Optical quality, Monte Carlo simulation
1. Introduction
Wave aberrations are distortions in the phase of light entering the eye, caused by non-optimal surface shapes, irregularities, and misalignments in the eye's optical elements, that produce image formation errors at the retina. Much of the recent research on the wave aberrations of the human eye has been directed toward eliminating the effects of aberrations either for improved retinal imaging through the use of adaptive optics (Burns, Marcos, Elsner, & Bara, 2002; Hofer et al., 2001; Liang, Williams, & Miller, 1997; Prieto, Fernandez, Manzanera, & Artal, 2004; Roorda, 2000; Roorda & Williams, 1999) or improved spatial acuity through customized refractive surgery procedures (Charman & Chateau, 2003; MacRae, Krueger, & Applegate, 2001; MacRae & Williams, 2001). Nevertheless, there is a growing understanding that aberrations may provide some benefit to the visual system under natural viewing conditions where high resolution may not always be the system's most important function. For example, though aberrations attenuate the modulation transfer function (MTF) relative to the diffraction limit, they increase depth of focus in monochromatic light (Marcos, Moreno, & Navarro, 1999; Nio et al., 2002). Similarly, in polychromatic light, wave aberrations counteract retinal image blur from longitudinal chromatic aberration (LCA). In the absence of wave aberrations, the two Dioptre range of LCA would produce severe attenuation of the MTFs for short and long wavelengths if the eye were focused in the middle of the visual spectrum. However, wave aberrations limit this effect by decreasing the variability in MTF across wavelengths, degrading the MTF for in-focus wavelengths while improving the MTF at other wavelengths (McLellan, Marcos, Prieto, & Burns, 2002). Such effects suggest that the eye's aberrations might represent a biological trade-off between excellent performance at a single distance or single wavelength and degraded but more constant performance across a range of viewing distances or across the visible spectrum.
It has become standard to express the eye's wave aberrations at the pupil plane as the weights, or coefficients, of the Zernike polynomials, which provide an orthogonal basis set describing aberrations at different spatial scales and orientations. The wavefront can be reconstructed from the weighted sum of the Zernike polynomials. Previous studies have investigated the distributions of aberrations in the population and have used principal component analyses to explore the correlations between aberrations (Porter, Guirao, Cox, & Williams, 2001; Thibos, Hong, Bradley, & Cheng, 2002). Their distribution results agree: most higher-order aberrations are roughly normally distributed around a mean close to zero; spherical aberration is a notable exception, having a positive mean value; and the magnitudes of aberrations generally decrease with increasing Zernike order. However, these studies differ in their conclusions about the correlations. Porter et al. (2001) found “almost no correlation between Zernike modes” across the population, while Thibos, Hong et al. (2002) identified a number of significant correlations and suggested that these correlations may have an effect on image quality. Recent models of population aberration statistics assume that each eye's aberrations are either completely independent (Canales & Cagigal, 2004) or that they have some covariance (Thibos, Bradley, & Hong, 2002).
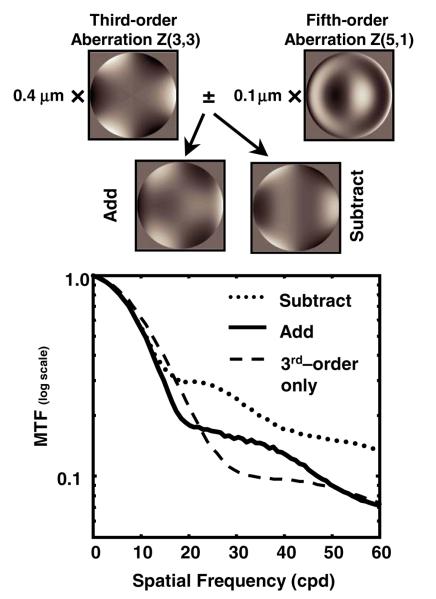
The concepts of correlation and independence are, of course, closely linked. While significant correlation implies dependence, the lack of correlation does not imply independence. To further explore the question of whether the eye's aberrations are independent, we employed an approach that does not rely on correlations across the population, but instead uses a within-subjects design to investigate the relations between an eye's wavefront and its optical quality. The RMS error of the wavefront is the square root of the sum of the squared Zernike polynomial coefficients. In general, RMS error is a measure of the flatness of the wavefront, and in general flatter wavefronts produce better MTFs. However, while these measures are strongly correlated, because the transform from wavefront to MTF is non-linear, the correlation of RMS to MTF is not perfect. For example, wavefronts with aberrations of the same magnitudes (equal RMS) but different signs can sometimes produce very different MTFs and an increase in aberrations (greater RMS error) can improve the MTF, as illustrated in Fig. 1. In an aberrated eye, the interrelations between aberrations can become very complicated, and as a result, the MTF is strongly dependent upon the relative magnitudes and signs of all of the Zernike coefficients.
Fig. 1.
The relative signs of aberrations in the wavefront can have a large effect on the MTF, even when the RMS errors are equal. In this example, a fifth-order term is either added or subtracted from a third-order term to produce two wavefronts. The subtractive wavefront produces the better MTF. Both MTFs are better at some frequencies than the MTF for the third-order term alone.
To test whether the complex relations between aberrations has a net effect on the image quality of eyes, we ran a series of Monte Carlo simulations. MTFs for measured aberrations in real eyes were compared to MTFs for simulated sets of aberrations with the same total RMS error but with randomized values, to address the following questions: are the MTFs for real aberrations different from those for the simulated aberrations; and do the aberrations balance in a way that limits their detrimental effects on image quality for a given degree of total error?
2. Methods
2.1. Apparatus
Aberration data were collected at two sites, Boston, MA and Madrid, Spain, using different experimental procedures that have been previously shown to produce similar results (Moreno-Barriuso, Marcos, Navarro, & Burns, 2001). In the Boston laboratory, wave aberration data were collected psychophysically with a spatially resolved refractometer (SRR) described in detail previously (He, Marcos, Webb, & Burns, 1998). For an array of pupil entry locations, the subject visually aligns a monochromatic test spot to a stationary reference location on the retina that enters through the pupil center. Moving the test spot on the retina corresponds to a change in its angle of incidence at the pupil. The angle needed to align the spot to the reference position for each pupil entry location provides an estimate of the wavefront slope at that location. The SRR has three optical channels. The first channel consists of an oscilloscope to provide the test spot and a rotating wheel with 37 apertures (1 mm in diameter) used to sample the pupil at 1-mm intervals. The effective diameter of the entire pupil sampling array is 7.32 mm. The positioning of the wheel is motor driven and computer controlled. The wheel is optically conjugate to the observer's pupil. A 530-nm interference filter (10-nm half-width) is placed in the test channel to limit the spectral bandwidth of the oscilloscope image. In the second channel, an image of a cross and high spatial frequency information (text) are displayed through a small, centered pupil. The cross is used as the fixation target and as the reference point for aligning the test spot and the text acts as an accommodative cue. A Wratten 58 (green) filter is used in this channel to limit the illumination spectrum of a fluorescent source and to maintain accommodation in the mid-spectral range. The third channel provides an infrared (IR) video image of the subject's pupil used to align the pupil center to the optical axis of the apparatus. All channels pass through a translatable focusing block (Badal optometer) to correct for the subject's spherical refractive error. Each experimental run took approximately 4 min and all data are based on at least three runs. The subject's head was stabilized with a dental impression bite bar on a three-dimensional translating stage. The experimenter monitored the subject's pupil position to align the pupil center to the optical axis of the apparatus to correct the position during experimental runs.
In the Madrid laboratory, aberration data were collected using laser ray tracing (Marcos, Barbero, Llorente, & Merayo-Lloves, 2001; Navarro & Losada, 1997). A narrow laser beam (543 nm) is scanned across the pupil and a CCD camera captures retinal spot images for each of 37 pupil entry locations (hexagonal pattern with 1 mm spacing). The effective diameter of the sampled pupil area was 6.51 mm. Deviations of the centroids of each spot image from the principal ray are proportional to the slope of the wave aberration. The subject's head was stabilized with a bite bar, spherical refractive errors were corrected with trial lenses, and pupil position was monitored by the experimenter. Results are based on five measurements. Corneal topography data were also collected using a standard commercial system (Atlas Mastervue, Humphrey Instruments-Zeiss), and corneal aberrations were determined through ray-tracing simulations fit to corneal topography data using custom software (Matlab, Natick, MA) and an optical design program (ZEMAX) as described by Marcos et al. (2001).
2.2. Subjects
Boston data were collected from 44 eyes (42 OD and 2 OS) of 22 female and 22 male observers, mean age = 40.9 years. Data from 38 of these eyes have been previously published (McLellan, Marcos, & Burns, 2001). Subjects' pupils were dilated with 0.5% tropicamide solution to ensure that all test spots would be visible. Madrid data were collected from left and right eyes of six observers (five female and one male, mean age = 28.3 years). All of these individuals were myopes intending to undergo LASIK surgery. Pre-operative spherical errors ranged from −2.5 to −13 D. Pupils were dilated with 1% Tropicamide. Both total aberration and corneal aberration data were collected. These data have been previously published (Marcos et al., 2001). All subjects gave informed consent before participation. The research protocols adhered to the tenets of the Declaration of Helsinki.
2.3. Data analysis
For both procedures, the raw data are estimates of the local slope of the wave aberration at different pupil locations. Zernike polynomial coefficients through the seventh-order (35 Zernike terms) were determined by least-squares fits of the derivatives of the Zernike polynomials to these data (7.3 mm pupil for Boston data and 6.51 mm pupil for Madrid data). For each subject, each run was fit individually, and the mean Zernike coefficients across runs were used to reconstruct the wavefront. These reconstructed wavefronts were then used to compute the point spread function (PSF) and two-dimensional modulation transfer function (MTF) for 3, 4, or 6 mm pupils. One-dimensional MTFs were calculated as the radial average of the two-dimensional MTFs. Corneal aberrations were computed for the same pupil center as total aberrations as described previously (Barbero, Marcos, Merayo-Lloves, & Moreno-Barriuso, 2002; Marcos et al., 2001).
2.4. Computational methods: Monte Carlo simulations
Modulation transfer functions produced by measured aberrations in real eyes were compared to the MTFs for randomized sets of aberrations. In each simulation, 50 randomized sets of aberrations were produced for each eye by manipulating the value of each Zernike coefficient (second through seventh-order), except for spherical aberration, z (4, 0). These manipulations included randomizing the sign of each term, while preserving its magnitude, or randomizing the orientation of aberrations, which could change both the sign and magnitude of each term. The randomization methods are described in more detail in Section 3. Because spherical aberration is generally positive in the population, its value was not randomized. Also, because RMS error within Zernike orders generally decreases with increasing order, the RMS error within each order was always kept constant, and total RMS was also maintained. Second-order defocus was set to zero unless otherwise noted. The radial average MTF was calculated for each of the 50 randomizations for each eye. The mean MTF was computed for the distribution containing these 50 MTFs and the MTF for the real aberrations. Two summary statistics, the MTF ratio and the MTF area Ratio were then computed
| (1) |
| (2) |
The MTF area was calculated on a linear scale over the range of 0–60 cycles per degree.
3. Results
The mean high-order RMS wavefront error for the Boston group of 44 eyes was 0.78 μm for a 7.3 mm pupil. The mean RMS wavefront error for the Madrid group of 12 myopic eyes was 0.61 μm for a 6.51 μm pupil. The mean corneal RMS for these eyes was 0.56 μm. For direct comparison of RMS values, the coefficients were scaled to a common pupil size of 6 mm using a matrix method (Campbell, 2003), resulting in respective RMS values of 0.41, 0.48, and 0.42 μm.
3.1. Simulation I. Aberration sign and orientation randomizations
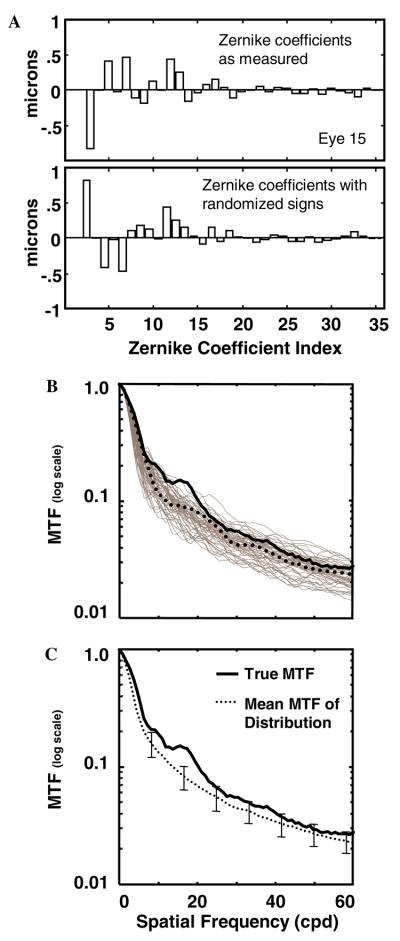
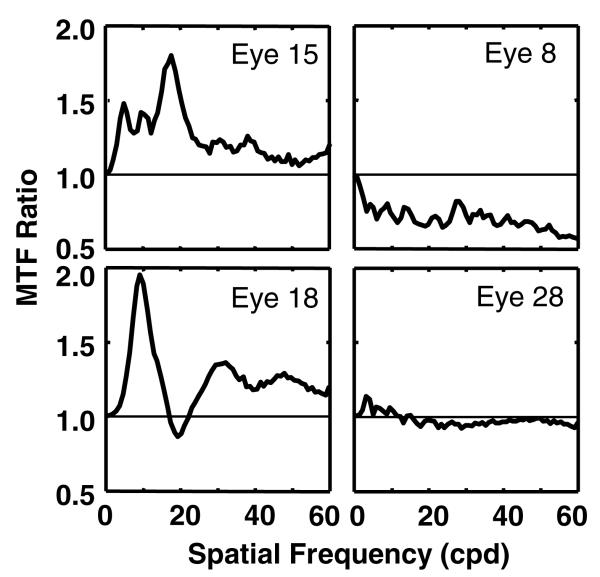
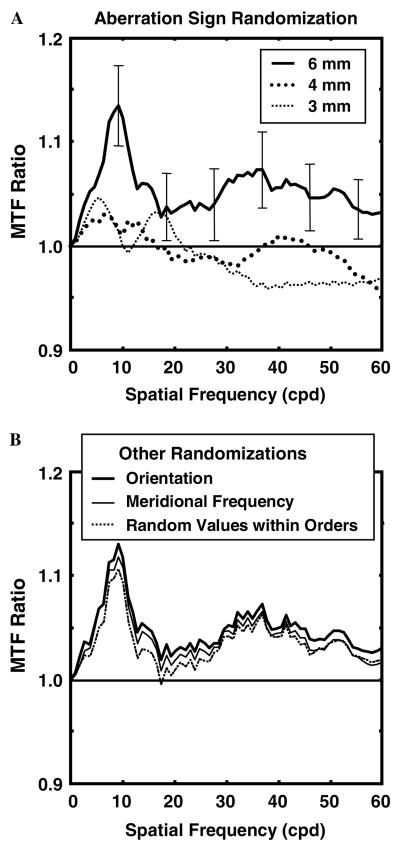
In the first simulation, the signs of each eyes' aberrations were randomized to produce a family of MTFs derived from wavefronts with equal RMS for each term. A unique set of 50 randomized-sign vectors was generated and applied to each eye's aberrations. Fig. 2A shows the measured aberrations and one set of randomized aberrations for one eye in the group of 44 eyes. In Fig. 2B, the thick curve is the MTF for the measured aberrations, the dotted curve is the MTF for the randomized aberrations shown above, and the gray curves are the rest of the MTFs from the distribution, all calculated for a 6 mm pupil. Fig. 2C compares the real MTF to the mean MTF of the distribution. The error bars represent standard deviations at different spatial frequencies. The top left panel in Fig. 3 shows the MTF ratio for this eye. An MTF ratio greater than 1.0 indicates that the true MTF is better than the mean MTF of the randomized distribution. The other panels in Fig. 3 show the MTF ratios for three additional eyes. Some true MTFs are better, some worse, and some about equal to the distribution mean. The thick solid curve in Fig. 4A shows the mean MTF ratio for the entire group of 44 eyes with standard errors. At all spatial frequencies up to 60 cpd, the mean MTF ratio is greater than 1.0, i.e., the MTFs for real aberrations are better than would be expected if the aberrations were combined with random signs.
Fig. 2.
Results for one example subject. (A) Measured aberrations (top panel) and one example of randomized aberrations (bottom). (B) The distribution of MTFs resulting from aberration randomization. The thick solid curve is the MTF for the measured aberrations; the dotted curve is the MTF for the randomized aberrations shown above. The gray curves are the rest of the MTFs from the distribution. (C) Comparison of the true MTF to the mean MTF of the distribution. Error bars represent standard deviations.
Fig. 3.
MTF ratios as a function of spatial frequency for four individual subjects. The upper left panel shows the same subject as in Fig. 2.
Fig. 4.
(A) MTF ratios for aberration sign randomizations three pupil sizes, 6 mm with standard errors (thick solid), 4 mm (thick dotted), and 3 mm (thin dotted). (B) MTF ratios for additional simulations for 6 mm pupils. The thick solid curve is the MTF ratio resulting from randomizing aberration orientations. The randomization schemes for the other two curves are described in the text.
Additional randomization simulations were computed for this group of 44 eyes with MTFs calculated for 3 and 4 mm pupils. All MTFs were calculated for subapertures of the original 7.3 mm wavefronts; aberrations were not re-calculated for different pupil sizes. The thick and thin dotted curves in Fig. 4A shows the MTF ratios for 4 and 3 mm pupils, respectively. The MTF ratio approaches 1.0 as the pupil size decreases. (Note that each curve is based on a unique set of 50 sign-randomizations.) MTF area ratio is significantly greater than 1.0 for 6 mm pupils (μ = 1.04, t = 2.65, df = 43, p = 0.011), but not for the smaller pupils.
Except for the circularly symmetric aberrations, each aberration can be expressed as the vector sum of sine and cosine Zernike mode components, with a magnitude and orientation. Sign randomization allows each of these oriented aberrations to assume just four orientations: the original and its reflections over the horizontal or vertical axis or both. To produce greater variability in the simulated wavefronts, each composite aberration can be randomly rotated to a new orientation and then decomposed into its new constituent Zernike terms, still maintaining the total RMS of each aberration. The thick solid curve in Fig. 4B shows the MTF ratios for orientation randomizations for 6 mm pupils. The results are very similar to those of the original sign randomization simulation for the 6 mm pupil. Again, MTF area ratio is significantly greater than 1.0 for 6 mm pupils (μ = 1.03, t = 2.18, df = 43, p = 0.030) but not for the smaller pupils.
Additional simulations employing other randomization schemes were also performed for 6 mm pupils and the results of two of these are shown in Fig. 4B. In the first, represented by the thin solid curve, both the meridional frequency and the sign of the aberrations were independently randomized within each order. (For example, a trefoil value in the real data might become a horizontal coma value in a randomization.) In the second, represented by the dashed curve, each individual term within a given order was allowed to take on a random value (magnitude and sign), with the restriction that the total RMS for that order remain constant. As above, spherical aberration was held constant. The results of these simulations are qualitatively very similar to those described above with an MTF ratio peak in the range of 5–15 cycles per degree, near the peak of the contrast sensitivity function. The mean MTF area ratios for these simulations are 1.04 and 1.03, respectively, but neither is significantly greater than 1.0.
3.2. Simulation II. Offset defocus for MTF optimization
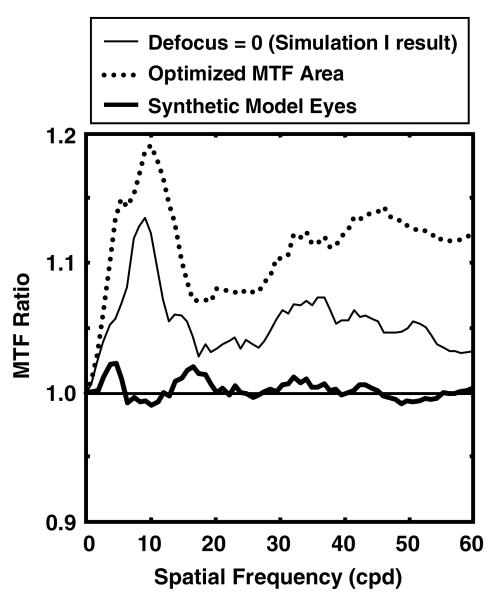
As shown in Fig. 1, the relative magnitudes of different aberrations can have a large effect on the MTF. This is true for second-order defocus as well as for other aberrations. In the simulations above, defocus was always set to 0, but adding some defocus can increase the area under the MTF. In this simulation, the defocus term, z (2, 0), was offset from zero to optimize the area under the MTF (from 0 to 60 cycles per degree) independently for the true aberrations and for each of 25 randomized sign aberration sets for each eye. The mean defocus offset for the real eyes was −0.35 Dioptres and mean offset of the simulations was −0.32 Dioptres. Again, the sign of spherical aberration was held constant. The defocus offset was not significantly correlated with spherical aberration. The thin solid curve in Fig. 5 represents the MTF ratio result from simulation I for 6 mm pupils. The dotted curve shows the MTF ratio when all MTFs are computed with a defocus offset that optimizes the MTF area. This optimization results in an even greater advantage for the true aberrations over randomized aberrations.
Fig. 5.
The thin solid curve is the MTF ratio for 6 mm pupils as in Fig. 4A with second-order defocus arbitrarily set to 0. The dotted curve is the MTF ratio that results from independently adjusting the defocus for the measured aberrations and for each randomization to optimize MTF area from 0 to 60 cpd. The thick solid curve is the MTF ratio for a set of 100 “synthetic” model eyes produced by randomly selecting and combining aberration terms from the population data of 44 eyes.
3.3. Simulation III. Control condition: Synthetic eyes
As a control condition, we produced 100 “synthetic” model eyes, for which the value of each Zernike coefficient was drawn randomly from our population data of 44 eyes for that same coefficient. The mean high-order RMS error for this new set of model eyes was 0.78 lm, equal to the mean RMS of the original sample. The same MTF ratio analysis as for real eyes was performed for 6 mm pupils. As shown by the thick solid curve in Fig. 5, the results for these model eyes with randomly sampled coefficients are very different from those of the real eyes: the MTF ratio is very close to 1.0 at all spatial frequencies. Orientation randomization for these synthetic eyes produced very similar results with ratios close to 1.0 (not shown).
3.4. Simulation IV. Total and corneal aberrations
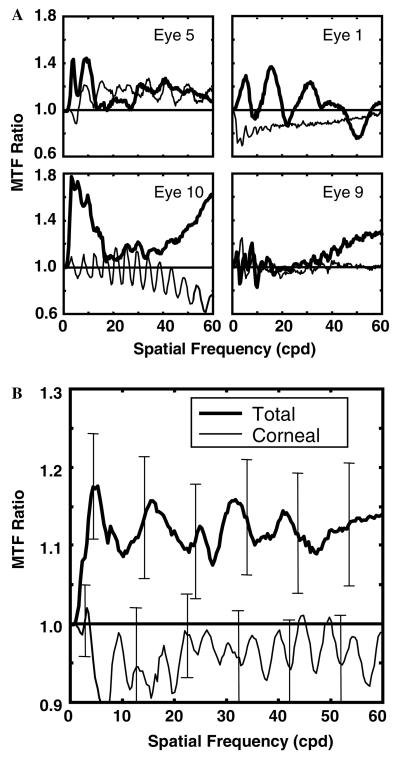
From these results, there is an apparent advantage for the eye's true aberrations over random sign aberrations. Does this effect represent a property of any biological optical surface in isolation, perhaps due to mechanical constraints, or does it occur only for the system as a whole? To address this question, we performed the MTF ratio analysis on both the total aberrations and the corneal aberrations alone from the Madrid group of 12 eyes. The aberrations of both the cornea and the internal surfaces of the eye are generally greater than the eye's total aberrations; that is, the internal aberrations compensate for the corneal aberrations to produce a flatter overall wavefront for the whole eye (Artal, Guirao, Berrio, & Williams, 2001). If there is a tuning process between the cornea and the internal optics that improves overall image quality relative to that of the individual components, then the true corneal aberrations may show no MTF advantage relative to randomized corneal aberrations. Fig. 6A shows the MTF ratios for total and corneal aberrations for four individual eyes. In each case, the MTF ratio for the corneas (thin curves) is close to 1.0, while the MTF ratios for total aberrations (thick curves) are more likely to differ from 1.0. Fig. 6B shows the mean MTF ratios for 12 eyes. For the corneas alone, the MTF ratio tends to be slightly below, but is not significantly different from 1.0. In this respect the corneal results resemble the results for the synthetic model eyes in Fig. 5. For total aberrations, the mean MTF ratio is well above 1.0 at all spatial frequencies, as for the larger Boston group, but there is only a marginal effect of MTF area ratio (μ = 1.08, t = 2.15, df = 11, p = 0.054).
Fig. 6.
(A) MTF ratios for total aberrations (thick) and corneal aberrations (thin) for four individual subjects. (B) Mean total and corneal MTF ratios for group of 12 subjects, with standard errors.
4. Discussion
These results support the idea that the eye's wave aberrations are interdependent in ways that improve the eye's MTF. This positive interaction is present for the total aberrations of real eyes, but it does not occur for corneal aberrations alone and it does not occur for “synthetic” model eyes, which have aberrations drawn randomly from the experimental population. The relative advantage for the MTF of the true aberrations is prominent for larger pupils, but disappears for small pupils. Though we do not expect that all randomization schemes would produce the same results, our randomizations were chosen to maintain not just overall RMS error, but also the eye's general pattern of decreasing aberration magnitudes with increasing order. Allowing the errors to be distributed completely randomly across orders (radial frequencies) would result in unrealistic aberrations that could produce very different results.
This analysis does not directly address the question of whether aberrations are correlated in the population, nor does it rely on the existence of correlations across eyes to account for the effect described. Even in the presence of consistent correlations among aberrations in the population, it is not a priori required that real aberrations should produce better image quality than randomized aberrations. Nevertheless, there is the possibility that different eyes will show the MTF advantage effect due to qualitatively similar combinations of co-varying aberrations. This is consistent with the suggestion of Thibos, Hong et al. (2002) that positive correlations among Zernike terms are beneficial to image quality. There tends to be a strong correlation between first-order terms (vertical and horizontal tilt) and third-order coma terms as noted by Thibos, Hong et al. (2002) and also found in our sample; however, because the tilts do not contribute to the MTF, this relation cannot account for our results. A comparison of the correlation matrices of our data and those of Porter et al. (2001, personal communication) to the Thibos, Hong et al. (2002) results shows that no sets of positive correlations, but two sets of strong negative correlations were shared among all three samples, the first between terms z (3, −3) and z (3, −1) and the second between terms z (4, 2), and z (4, 4). To test whether these specific relations were important to our results, we performed another set of sign randomization simulations that preserved the signs of these four terms. The difference in the MTF ratio from the original simulation was negligible. Obviously, however, as more terms are held constant, the effect must diminish. This suggests that the MTF ratio effect is due to interactions among the entire ensemble of aberrations and not due to relations between a few pairs.
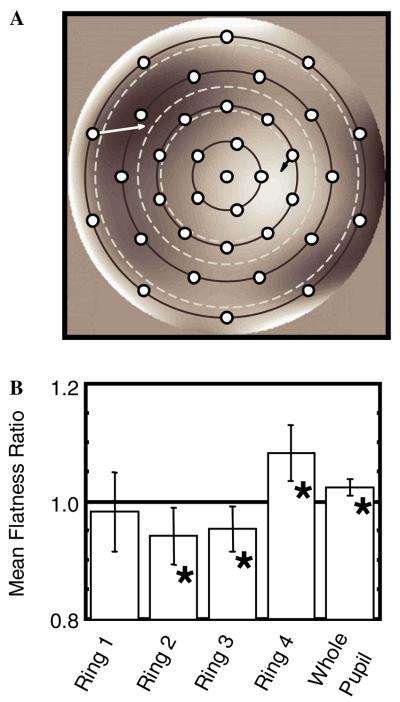
Because the sign randomization procedure preserves the RMS error of the wavefront, the MTF ratio effect suggests that the error in the true wavefronts must be distributed across the pupil differently from the error in the wavefronts with randomized-sign aberrations. To test this supposition, we sampled horizontal and vertical 2nd derivative vectors and calculated vector lengths, |D″|, for both the true wavefronts and each randomized-aberration wavefront from Simulation 1. These samples were taken at 36 locations in concentric rings, as shown in Fig. 7A. A short vector length (black arrow in ring 2) represents a slowly changing or relatively flatter area in the wavefront (i.e., a more planar local region, regardless of tilt), while a long vector length (white arrow in ring 4) represents a rapidly changing or less planar area in the wavefront. More rapid changes are associated with poorer optical quality. The vector lengths were arithmetically added together for each sample ring individually and for the pupil as a whole to produce a new statistic
| (3) |
For this measure, a ratio < 1.0 indicates that the true wavefront is flatter than the mean of the randomized wavefronts. As shown in Fig. 7B, the true wavefronts tend to be flatter near the center of the pupil, and less flat near the pupil edge. Thus, aberrations seem to interact in real eyes to produce a wavefront shape that is relatively flatter toward the pupil center and more curved toward the pupil edge as compared to the randomized wavefronts.
Fig. 7.
(A) Locations of the 36 2nd derivative samples. The white and black arrows indicate areas of rapid and slow change, respectively. The dark circles indicate rings 1–4 from the center outward. Ring 1 includes the pupil center. The white dashed circles indicate 3, 4, and 6 mm pupil diameters. (B) Wavefront Flatness Ratios across the pupil. True aberrations produce a flatter wavefront near the pupil center, and less flat wavefront closer to the pupil edge compared to the randomized wavefronts. Ring 1: μ = 0.98, t = 0.53, p = 0.60. Ring 2: μ = 0.94, t = 2.39, p = 0.02. Ring 3: μ = 0.95, t = 2.41, p = 0.02. Ring4: μ = 1.08, t = 3.38, p = 0.001. Total pupil: μ = 1.02, t = 3.13, p = 0.003. Asterisks indicate ratios that are significantly different from 1.0.
Whether this wavefront shape is the result of an active, feedback-guided developmental process or just a byproduct of the physical stresses and pressures that shape the eye's optics cannot be determined from these simulations. This question could be related to the compensation between cor-neal and internal aberrations, whose mechanisms remain under debate. For example, Kelly, Mihashi, and Howland (2004) suggests that the compensation between corneal and internal spherical aberration is a passive result of the inherent, evolutionarily determined shapes of the lens and cornea, while the values of coma and astigmatism could be developmentally fine-tuned in each eye by an active mechanism controlling lens decentration and tilt. Artal, Benito, and Tabernero (2006) also studied the compensation of corneal and internal coma, and while they conclude that it is likely due to a passive process, they do not exclude the possibility that it is visually guided.
These simulations suggest that the Zernike components of an eye's wave aberrations are not independent and that they tend to interact in ways that produce generally flatter wavefronts toward the center of the pupil than they would if they were independent. As a result, the eye's optical quality for a given RMS error is better than it would be with independent aberrations. This effect occurs for the total aberrations of real eyes, but it was not found for corneal aberrations alone or for “synthetic” eyes, with aberrations drawn randomly from the experimental population. The relative advantage for the MTF of the true aberrations appears to occur only for larger pupils and reaches a maximum near the peak of the contrast sensitivity function.
Acknowledgments
Thanks to the Editor and to an anonymous reviewer for their extensive comments and helpful criticisms during the preparation of this manuscript. Financial support was provided by National Institute of Health Grant EYO4395 to S.A. Burns.
References
- Artal A, Benito A, Tabernero J. The human eye is an example of robust optical design. Journal of Vision. 2006;6:1–7. doi: 10.1167/6.1.1. [DOI] [PubMed] [Google Scholar]
- Artal P, Guirao A, Berrio E, Williams DR. Compensation of corneal aberrations by the internal optics in the human eye. Journal of Vision. 2001;1:1–8. doi: 10.1167/1.1.1. [DOI] [PubMed] [Google Scholar]
- Barbero S, Marcos S, Merayo-Lloves JM, Moreno-Barriuso E. Validation of the estimation of corneal aberrations from videokeratography in keratoconus. Journal of Refractive Surgery. 2002;18:263–270. doi: 10.3928/1081-597X-20020501-09. [DOI] [PubMed] [Google Scholar]
- Burns SA, Marcos S, Elsner AE, Bara S. Contrast improvement of confocal retinal imaging by use of phase-correcting plates. Optics Letters. 2002;27:400–402. doi: 10.1364/ol.27.000400. [DOI] [PMC free article] [PubMed] [Google Scholar]
- Campbell CE. Matrix method to find a new set of Zernike coefficients from an original set when the aperture radius is changed. Journal of the Optical Society of America A. 2003;20:209–217. doi: 10.1364/josaa.20.000209. [DOI] [PubMed] [Google Scholar]
- Canales VF, Cagigal MP. Monte Carlo simulation of irradiance distribution on the retina after refractive surgery. Journal of Refractive Surgery. 2004;20:384–390. doi: 10.3928/1081-597X-20040701-13. [DOI] [PubMed] [Google Scholar]
- Charman WN, Chateau N. The prospects for super-acuity: limits to visual performance after correction of monochromatic ocular aberration. Ophthalmic and Physiological Optics. 2003;23:479–493. doi: 10.1046/j.1475-1313.2003.00132.x. [DOI] [PubMed] [Google Scholar]
- He JC, Marcos S, Webb RH, Burns SA. Measurement of the wavefront aberration of the eye by a fast psychophysical procedure. Journal of the Optical Society of America A. 1998;15:2449–2456. doi: 10.1364/josaa.15.002449. [DOI] [PubMed] [Google Scholar]
- Hofer H, Chen L, Yoon GY, Singer B, Yamauchi Y, Williams DR. Improvement in retinal image quality with dynamic correction of the eye's aberrations. Optics Express. 2001;8:631–643. doi: 10.1364/oe.8.000631. [DOI] [PubMed] [Google Scholar]
- Kelly JE, Mihashi T, Howland HC. Compensation of corneal horizontal/vertical astigmatism, lateral coma, and spherical aberration by internal optics of the eye. Journal of Vision. 2004;4:262–271. doi: 10.1167/4.4.2. [DOI] [PubMed] [Google Scholar]
- Liang J, Williams DR, Miller DT. Supernormal vision and high-resolution retinal imaging through adaptive optics. Journal of the Optical Society of America A. 1997;14:2884–2892. doi: 10.1364/josaa.14.002884. [DOI] [PubMed] [Google Scholar]
- MacRae S, Krueger RR, Applegate RA, editors. Customized Corneal Ablations. Slack; Thorofare, NJ: 2001. [Google Scholar]
- MacRae SM, Williams DR. Wavefront guided ablation. American Journal of Ophthalmology. 2001;132:915–919. doi: 10.1016/s0002-9394(01)01319-8. [DOI] [PubMed] [Google Scholar]
- Marcos S, Barbero S, Llorente L, Merayo-Lloves J. Optical response to LASIK surgery for myopia from total and corneal aberration measurements. Investigative Ophthalmology and Vision Science. 2001;42:3349–3356. [PubMed] [Google Scholar]
- Marcos S, Moreno E, Navarro R. The depth-of-field of the human eye from objective and subjective measurements. Vision Research. 1999;39:2039–2049. doi: 10.1016/s0042-6989(98)00317-4. [DOI] [PubMed] [Google Scholar]
- McLellan JS, Marcos S, Burns SA. Age-related changes in monochromatic wave aberrations of the human eye. Investigative Ophthalmology and Vision Science. 2001;42:1390–1395. [PubMed] [Google Scholar]
- McLellan JS, Marcos S, Prieto PM, Burns SA. Imperfect optics may be the eye's defence against chromatic blur. Nature. 2002;417:174–176. doi: 10.1038/417174a. [DOI] [PubMed] [Google Scholar]
- Moreno-Barriuso E, Marcos S, Navarro R, Burns SA. Comparing laser ray tracing, the spatially resolved refractometer, and the Hartmann–Shack sensor to measure the ocular wave aberration. Optometry and Vision Science. 2001;78:152–156. doi: 10.1097/00006324-200103000-00007. [DOI] [PubMed] [Google Scholar]
- Navarro R, Losada MA. Aberrations and relative efficiency of light pencils in the living human eye. Optometry and Vision Science. 1997;74:540–547. doi: 10.1097/00006324-199707000-00023. [DOI] [PubMed] [Google Scholar]
- Nio YK, Jansonius NM, Fidler V, Geraghty E, Norrby S, Kooijman AC. Spherical and irregular aberrations are important for the optimal performance of the human eye. Ophthalmic and Physiological Optics. 2002;22:103–112. doi: 10.1046/j.1475-1313.2002.00019.x. [DOI] [PubMed] [Google Scholar]
- Porter J, Guirao A, Cox IG, Williams DR. Monochromatic aberrations of the human eye in a large population. Journal of the Optical Society of America A. 2001;18:1793–1803. doi: 10.1364/josaa.18.001793. [DOI] [PubMed] [Google Scholar]
- Prieto PM, Fernandez EJ, Manzanera S, Artal P. Adaptive optics with a programmable phase modulator: applications in the human eye. Optics Express. 2004;12:4059–4071. doi: 10.1364/opex.12.004059. [DOI] [PubMed] [Google Scholar]
- Roorda A. Adaptive optics ophthalmoscopy. Journal of Refractive Surgery. 2000;16:S602–S607. doi: 10.3928/1081-597X-20000901-23. [DOI] [PubMed] [Google Scholar]
- Roorda A, Williams DR. The arrangement of the three cone classes in the living human eye. Nature. 1999;397:520–522. doi: 10.1038/17383. [DOI] [PubMed] [Google Scholar]
- Thibos LN, Bradley A, Hong X. A statistical model of the aberration structure of normal, well-corrected eyes. Ophthalmic and Physiological Optics. 2002;22:427–433. doi: 10.1046/j.1475-1313.2002.00059.x. [DOI] [PubMed] [Google Scholar]
- Thibos LN, Hong X, Bradley A, Cheng X. Statistical variation of aberration structure and image quality in a normal population of healthy eyes. Journal of the Optical Society of America A. 2002;19:2329–2348. doi: 10.1364/josaa.19.002329. [DOI] [PubMed] [Google Scholar]


