

Abstract
How predictable are human eye movements during search in real world scenes? We recorded 14 observers’ eye movements as they performed a search task (person detection) in 912 outdoor scenes. Observers were highly consistent in the regions fixated during search, even when the target was absent from the scene. These eye movements were used to evaluate computational models of search guidance from three sources: saliency, target features, and scene context. Each of these models independently outperformed a cross-image control in predicting human fixations. Models that combined sources of guidance ultimately predicted 94% of human agreement, with the scene context component providing the most explanatory power. None of the models, however, could reach the precision and fidelity of an attentional map defined by human fixations. This work puts forth a benchmark for computational models of search in real world scenes. Further improvements in modeling should capture mechanisms underlying the selectivity of observer’s fixations during search.
Keywords: eye movement, visual search, real world scene, computational model, contextual guidance, saliency, target feature
Daily human activities involve a preponderance of visually-guided actions, requiring observers to determine the presence and location of particular objects. How predictable are human search fixations? Can we model the mechanisms that guide visual search? Here, we present a dataset of 45,144 fixations recorded while observers searched 912 real-world scenes and evaluate the extent to which search behavior is (1) consistent across individuals and (2) predicted by computational models of visual search guidance.
Studies of free viewing have found that the regions selected for fixation vary greatly across observers (Andrews & Coppola, 1999; Einhauser, Rutishauser, Koch, 2008; Parkhurst & Neibur, 2003; Tatler, Baddeley, Vincent, 2006). However, the effect of behavioral goals on eye movement control has been known since the classic demonstrations by Buswell (1935) and Yarbus (1967) showing that observers’ patterns of gaze depended critically on the task. Likewise, a central result emerging from studies of oculomotor behavior during ecological tasks (driving, e.g. Land & Lee, 1994; food preparation, e.g. Hayhoe, Shrivastava, Mruczek, & Pelz, 2003; sports, e.g. Land & McLeod, 2000) is the functional relation of gaze to one’s momentary information processing needs (Hayhoe & Ballard, 2005).
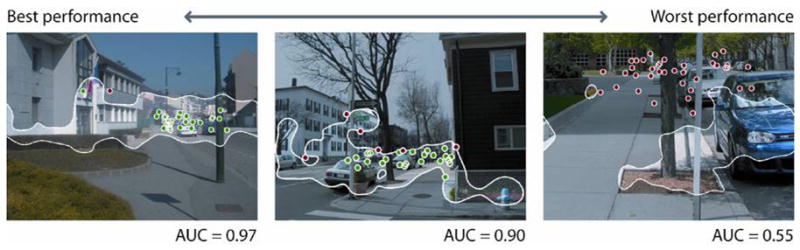
In general, specifying a goal can serve as a referent for interpreting internal computations that occur during task execution. Visual search – locating a given target in the environment – is an example of a behavioral goal which produces consistent patterns of eye movements across observers. Figure 1 shows typical fixation patterns of observers searching for pedestrians in natural images. Different observers often fixate remarkably consistent scene regions, suggesting that it is possible to identify reliable, strategic mechanisms underlying visual search and to create computational models that predict human eye fixations.
Figure 1.
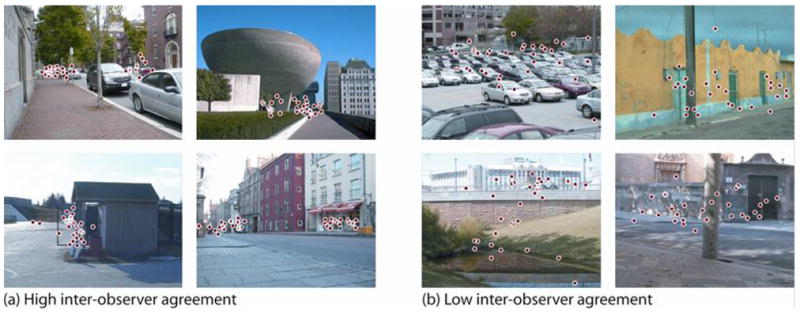
Examples of target absent scenes with (a) high and (b) low inter-observer agreement. Dots represent the first 3 fixations from each observer.
Various mechanisms have been proposed which may contribute to attention guidance during visual search. Guidance by statistically unexpected, or salient, regions of a natural image has been explored in depth in both modeling and behavioral work (e.g., Bruce, & Tsotsos, 2005; Itti, Koch & Niebur, 1998; Koch & Ullman, 1985; Li, 2002; Rosenholtz, 1999; Torralba, 2003). Numerous studies have shown that regions where the local statistics differ from the background statistics are more likely to attract an observer’s gaze: distinctive color, motion, orientation, or size constitute the most common salient attributes, at least in simple displays (for a review, Wolfe & Horowitz, 2004). Guidance by saliency may also contribute to early fixations on complex images (Bruce & Tsotsos, 2005; Harel, Koch & Perona, 2006; Itti & Koch, 2000; Parkhurst, Law & Niebur, 2002; van Zoest, Donk, & Theeuwes, 2004), particularly when the scene context is not informative (Parkhurst et al., 2002; Peters, Iyer, Itti & Koch, 2005) or during free viewing. In natural images, it is interesting to note that objects are typically more salient than their background (Torralba, Oliva, Castelhano, & Henderson, 2006; Elazary & Itti, 2008), so oculomotor guidance processes may use saliency as a heuristic to fixate objects in the scene rather than the background.
In addition to bottom-up guidance by saliency, there is a top-down component to visual attention that is modulated by task. During search, observers can selectively attend to the scene regions most likely to contain the target. In classical search tasks, target features are an ubiquitous source of guidance (Treisman & Gelade, 1980; Wolfe, Cave & Franzel, 1998; Wolfe, 1994, 2007; Zelinsky, 2008): for example, when observers search for a red target, attention is rapidly deployed towards red objects in the scene. Although a natural object, such as a pedestrian, has no single defining feature, it still has statistically reliable properties (upright form, round head, straight body) that could be selected by visual attention. In fact, there is considerable evidence for target-driven attentional guidance in real world search tasks (Einhauser et al, 2008; Pomplun, 2006; Rao, Zelinsky, Hayhoe, & Ballard, 2002; Rodriguez-Sanchez, Simine & Tsotsos, 2007; Tsotsos, Culhane, Wai, Lai, Davis & Nuflo, 1995; Zelinsky, 2008).
Another top-down component which applies in ecological search tasks is scene context. Statistical regularities of natural scenes provide rich cues to target location and appearance (Eckstein, Drescher & Shimozaki, 2006; Hoiem, Efros, & Hebert, 2006; Torralba & Oliva, 2002; Torralba & Oliva, 2003; Oliva & Torralba, 2007). Within a glance, global information can provide useful information about spatial layout and scene category (Joubert, Rousselet, Fize & Fabre-Thorpe, 2007; Greene & Oliva, 2009; Renninger & Malik, 2004; McCotter, Gosselin, Sowden, & Schyns, 2005; Rousselet, Joubert, & Fabre-Thorpe, 2005; Schyns & Oliva, 1994). Categorical scene information informs a viewer of which objects are likely to be in the scene and where (Bar, 2004; Biederman, Mezzanotte, & Rabinowitz, 1982; De Graef, 1990; Friedman, 1979; Henderson, Weeks & Hollingworth, 1999; Loftus & Mackworth, 1978). Furthermore, global features can be extracted quickly enough to influence early search mechanisms and fixations (Castelhano & Henderson, 2007; Chaumon, Drouet & Tallon-Baudry, 2008; Neider & Zelinky, 2006; Torralba et al., 2006; Zelinsky & Schmidt, this issue).
In the present work, we recorded eye movements as observers searched for a target object (a person) in over 900 natural scenes and evaluated the predictive value of several computational models of search. The purpose of this modeling effort was to study search guidance, that is, where observers look while deciding whether a scene contains a target. We modeled three sources of guidance: bottom-up visual saliency, learned visual features of the target’s appearance, and a learned relationship between target location and scene context. Informativeness of these models was assessed by comparing the regions selected by each model to human search fixations, particularly in target absent scenes (which provide the most straightforward and rigorous comparison).
The diversity and size of our dataset (14 observers’ fixations on 912 urban scenes)1 provides a challenge for computational models of attentional guidance in real world scenes. Intelligent search behavior requires an understanding of scenes, objects and the relationships between them. Although humans perform this task intuitively and efficiently, modeling visual search is challenging from a computational viewpoint. The combined model presented here achieves 94% of human agreement on our database, however a comprehensive understanding of human search guidance will benefit from mutual interest by cognitive and computer vision scientists alike.
Experimental Method
Participants
14 observers (18–40 years old with normal acuity) were paid for their participation ($15/hour). They gave informed consent and passed the eyetracking calibration test.
Apparatus
Eye movements were recorded at 240 Hz using an ISCAN RK-464 video-based eyetracker. Observers sat at 75 cm from the display monitor, 65 cm from the eyetracking camera, with their head centered and stabilized in a headrest. The position of the right eye was tracked and viewing conditions were binocular. Stimuli were presented on a 21″ CRT monitor with a resolution of 1024 by 768 pixels and a refresh rate of 100 Hz. Presentation of the stimuli was controlled with Matlab and Psychophysics Toolbox (Brainard, 1997; Pelli, 1997). The following calibration procedure was performed at the beginning of the experiment and repeated following breaks. Participants sequentially fixated 5 static targets positioned at 0° (center) and at 10° of eccentricity. Subsequently, the accuracy of the calibration was tested at each of 9 locations evenly distributed across the screen, including the 5 calibrated locations plus 4 targets at +/− 5.25° horizontally and vertically from center. Estimated fixation position had to be within 0.75° of visual angle for all 9 points, otherwise the experiment halted and the observer was re-calibrated.
Stimuli
The scenes consisted of 912 color pictures of urban environments, half containing a pedestrian (target present) and half without (target absent). Images were of resolution 800 by 600 pixels, subtending 23.5° by 17.7° of visual angle. When present, pedestrians subtended on average 0.9° by 1.8° (corresponding to roughly 31 by 64 pixels). For the target present images, targets were spatially distributed across the image periphery (target locations ranged from 2.7° to 13° from the screen center; median eccentricity was 8.6 o), and were located in each quadrant of the screen with approximately equal frequency 2.
Procedure
Participants were instructed to decide as quickly as possible whether or not a person was present in the scene. Responses were registered via the keyboard, which terminated the image presentation. Reaction time and eye movements were recorded. The first block consisted of the same 48 images for all participants, and was used as a practice block to verify that the eyes could be tracked accurately. The experiment was composed of 19 blocks of 48 trials each and 50% target prevalence within each block. Eyetracking calibration was checked after each block to ensure tracking accuracy within 0.75° of each calibration target. Each participant performed 912 experimental trials, resulting in an experiment duration of 1 hour.
Eye movement analysis
Fixations were identified on smoothed eye position data, averaging the raw data over a moving window of 8 data points (33 ms). Beginning and end positions of saccades were detected using an algorithm implementing an acceleration criterion (Araujo, Kowler, & Pavel, 2001). Specifically, the velocity was calculated for two overlapping 17 ms intervals; the onset of the second interval was 4.17 ms after the first. The acceleration threshold was a velocity change of 6 °/s between the two intervals. Saccade onset was defined as the time when acceleration exceeded threshold and the saccade terminated when acceleration dropped below threshold. Fixations were defined as the periods between successive saccades. Saccades occurring within 50 ms of each other were considered to be continuous.
Human Eye Movements Result
Accuracy and Eye Movement Statistics
On average, participants’ correct responses when the target was present (hits) was 87%. The false alarm rate (fa) in target absent scenes was 3%. On correct trials, observers’ mean reaction time was 1050 ms (one standard error of the mean or s.e.m = 18) for target present and 1517 ms (one s.e.m = 14) for target absent. Observers made an average of 3.5 fixations (excluding the initial central fixation but including fixations on the target) in target present scenes and 5.1 fixations in target absent scenes. The duration of “search fixations” exclusively (i.e. exploratory fixations excluding initial central fixation and those landing on the target) averaged 147 ms on target present trials and 225 ms on target absent trials. Observers spent an average of 428 ms fixating the target-person in the image before indicating a response.
We focused our modeling efforts on predicting locations of the first three fixations in each scene (but very similar results were obtained when we included all fixations). We introduce below the measures used to compare search model’s predictions and humans’ fixations.
Agreement among Observers
How much eye movement variability exists when different observers look at the same image and perform the same task? First, we computed the regularity, or agreement among locations fixated by separate observers (Mannan, Ruddock, Wooding, 1995; Tatler, Baddeley, Gilchrist, 2005). As in Torralba et al (2006), a measure of inter-observer agreement was obtained for each image by using the fixations generated by all-except-one observers. The “observer-defined” image region was created by assigning a value of 1 to each fixated pixel and 0 to all other pixels, then applying a Gaussian blur (cutoff frequency = 8 cycles per image, about 1° visual angle). The observer-defined region was then used to predict fixations of the excluded observer. For each image, this process was iterated for all observers. Thus, this measure reflected how consistently different observers selected similar regions to. Figure 1 shows examples of target absent scenes with high and low values of inter-observer agreement.
Not all of the agreement between observers is driven by the image, however – human fixations exhibit regularities that distinguish them from randomly-selected image locations. In this issue, Tatler & Vincent present compelling evidence that robust oculomotor biases constrain fixation selection independently of visual information or task (see also Tatler 2007). Qualitatively, we observe in our dataset that the corners of the image, and the top and bottom edges, were less frequently fixated than regions near the image center. We therefore derived a measure to quantify the proportion of inter-observer agreement that was independent of the particular scene’s content (see also Foulsham & Underwood, 2008; Henderson, Brockmole, Castelhano, Mack, 2007). Our “cross-image control” was obtained using the procedure described above, with the variation that the observer-defined region for one image was used to predict the excluded observer’s fixations from a different image selected at random.
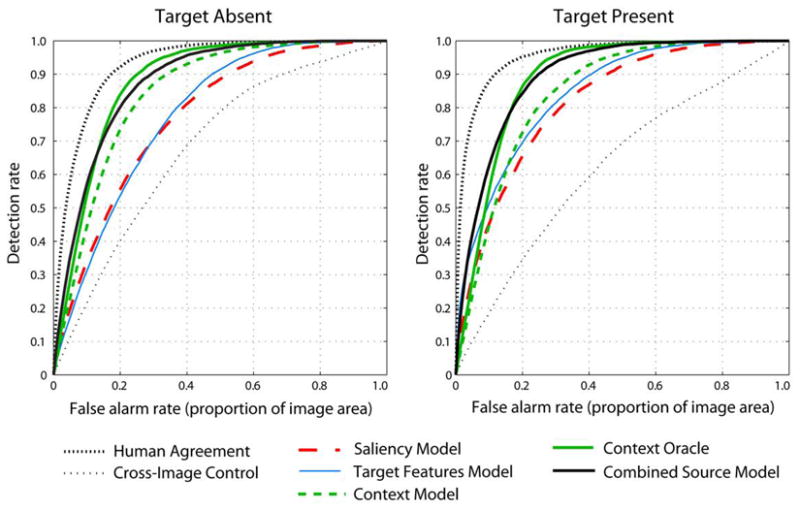
The Receiver Operating Characteristic (ROC) curves for inter-observer agreement and the cross-image control are shown in Figure 2. These curves show the proportion of fixations that fall within the fixation-defined map (detection rate) in relation to the proportion of the image area selected by the map (false alarm rate). In the following, we report the area under the curve (AUC), which corresponds to the probability that the model will rank an actual fixation location more highly than a non-fixated location, with a value ranging from 0.5 (chance performance) to 1 (perfect performance) (Harel et al, 2006; Renninger, Verghese & Coughlan 2007; Tatler et al 2005).
Figure 2.
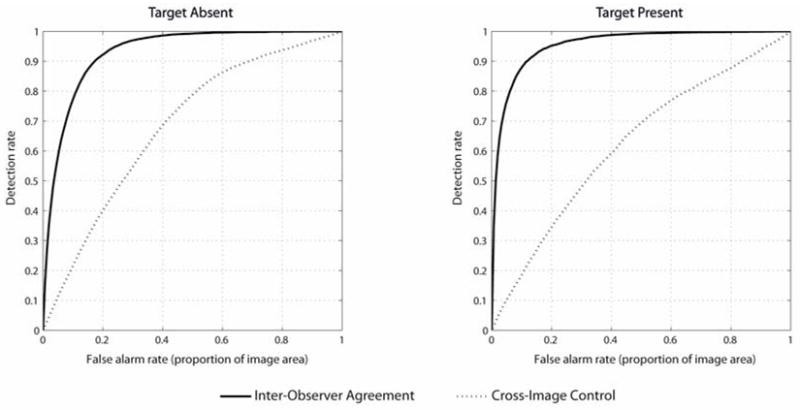
Inter-observer agreement and cross-image control for target absent (left) and present (right) scenes. The false alarm rate, on the x-axis, corresponds to the proportion of the image selected by the model.
The results in Figure 2 show a high degree of inter-observer agreement, indicating high consistency in the regions fixated by different observers for both target absent scenes (AUC = 0.93) and target present scenes (AUC = 0.95). Overall, inter-observer agreement was higher in target present than in target absent scenes (t(805) = 11.6, p<0.0001), most likely because fixating the target was the primary goal of the search. These human agreement curves represent the upper bound on performance, against which the computational models will be compared. Furthermore, the cross-image consistency produced an AUC of 0.68 and 0.62 for target absent and present scenes respectively (random chance: AUC = 0.5). The cross-image control line represents the proportion of human agreement due to oculomotor biases and other biases in the stimuli set, and serves as the lower bound on the performance of the models.
Modeling Methods
Here we used the framework of visual search guidance from Torralba (2003) and Torralba et al (2006). In this framework, the attentional map (M), which will be used to predict the locations fixated by human observers, is computed by combining three sources of information: image saliency at each location (MS), a model of guidance by target features (MT), and a model of guidance by the scene context (MC).
| Equation (1) |
The exponents (γ1,γ2, γ3), which will act like weights if we take the logarithm of Equation 1, are constants which are required when combining distributions with high-dimensional inputs that were independently trained, to ensure that the combined distribution is not dominated by one source (the procedure for selecting the exponents is described below). Together, these three components (MS, MT and MC) make up the combined attentional map (M).
Figure 3 illustrates a scene with its corresponding saliency, target features, and scene context maps, as well as a combined map integrating the three sources of guidance. Each model makes different predictions, represented as a surface map, of the regions that are likely to be fixated. The best model should capture as many fixations as possible within as finely-constrained a region as possible. In the following sections, we evaluate the performance of each of the three models individually, and then combined models.
Figure 3.
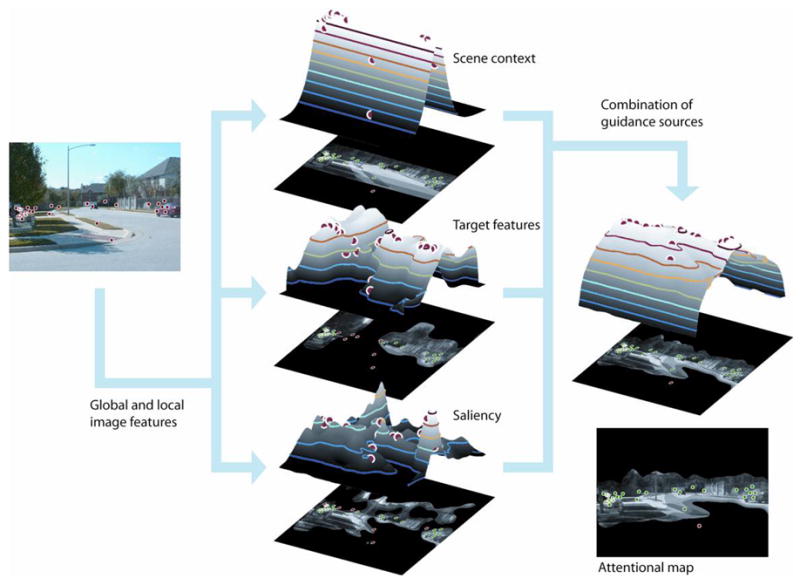
Illustration of an image, the computational maps for three sources of guidance, and the overall, combined attentional map. The flattened maps show the image regions selected when the model is thresholded at 30% of the image.
Guidance by Saliency
Computational models of saliency are generally based on one principle: they use a mixture of local image features (e.g. color and orientation at various spatial scales) to determine regions that are local outliers given the statistical distribution of features across a larger region of the image. The hypothesis underlying these models is that locations whose properties differ from neighboring regions or the image as a whole are the most informative. Indeed, rare image features in an image are more likely to be diagnostic of objects (Elazary & Itti, 2008; Torralba et al., 2006), whereas repetitive image features or large homogenous regions are unlikely to be object-like (Rosenholtz, Li & Nakano, 2007; Bravo & Farid, 2004).
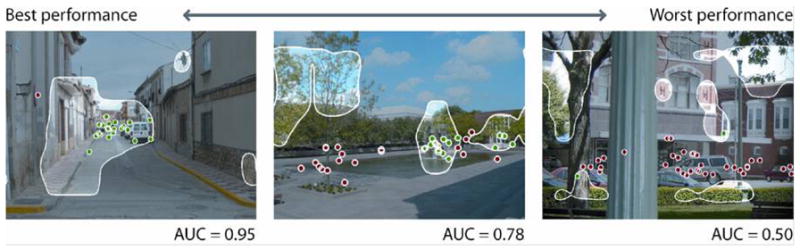
Computing saliency involves estimating the distribution of local features in the image. Here we used the statistical saliency model described in Torralba et al (2006), including the use of an independent validation set to determine an appropriate value for the exponent3. The independent validation set was composed of 50 target present and 50 target absent scenes selected randomly from the 912 experimental images and excluded from all other analyses. Figure 4 shows maps of the best and worst predictions of the saliency model on our stimuli set.
Figure 4.
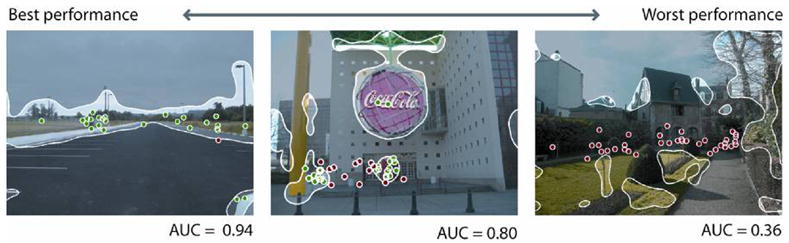
Saliency maps of the best and worst predictions of the database, and one midrange image, with their AUC values. The highlighted region corresponds to 20% of the image area. Dots represent human fixations.
Guidance by Target Features
To date, the most ubiquitous source of search guidance are target features (for reviews, Wolfe, 2007; Zelinsky, 2008). Identifying the relevant features of an object’s appearance remains a difficult issue, although recent computer vision approaches have reached excellent performance for some object classes (i.e. faces, Ullman, Vidal-Naquet, & Sali, 2002; cars, Papageorgiou & Poggio, 2000; pedestrians, Dalal & Triggs, 2005; cars, bicycles and pedestrians, Serre, Wolf, Bileschi, Riesenhuber & Poggio, 2007; Torralba, Fergus & Freeman, 2008). Here, we used the person detector developed by Dalal & Triggs (2005) and Dalal, Triggs, & Schmid (2006) to model target features, as their code is available online4, and gives state of the art detection performance at a reasonable speed.
Implementation of the DT person detector
The Dalal & Triggs (DT) detector is a classifier-based detector that uses a scanning window approach to explore the image at all locations and scales. The classifier extracts a set of features from that window and applies a linear Support Vector Machine (SVM) to classify the window as belonging to the target or background classes. The features are a grid of Histograms of Oriented Gradients (HOG) descriptors. The detector is sensitive to the gross structure of an upright human figure but relatively tolerant to variation in the pose of the arms and legs. We trained various implementations of the DT detector with different training set sizes and scanning window sizes, but here we report the only the results from the implementation which ultimately gave the best performance on our validation set5. This implementation used a scanning window of 32 × 64 pixels and was trained on 2000 upright, unoccluded pedestrians, along with their left-right reflections. Pedestrians were cropped from images in the LabelMe database (Russell, Torralba, Murphy, & Freeman, 2008) and reduced in size to fill three-quarters of the height of the detection window. Negative training examples consisted of 30 randomly-selected 32 × 64 pixel patches from 2000 images of outdoor scenes which did not contain people. None of the experimental stimuli were used as training images. The training process was as described in Dalal & Triggs (2005).
The detector was tested on our stimuli set with cropped, resized pedestrians from our target present scenes serving as positive test examples and 32 × 64 pixel windows from our target absent scenes serving as negative test examples. Figure 5 shows the detection performance of our selected DT model implementation6. This implementation gave over 90% correct detections at a false positive rate of 10%, confirming the reliability of the DT detector on our database. Although this performance might be considered low given the exceptional performance of the DT detector on other image sets, the scenes used for our search task were particularly challenging: targets were small, often occluded, and embedded in high clutter. It is worth nothing that our goal was not to detect target-people in the dataset, but to use a reliable object detector as a predictor of human search fixations.
Figure 5.
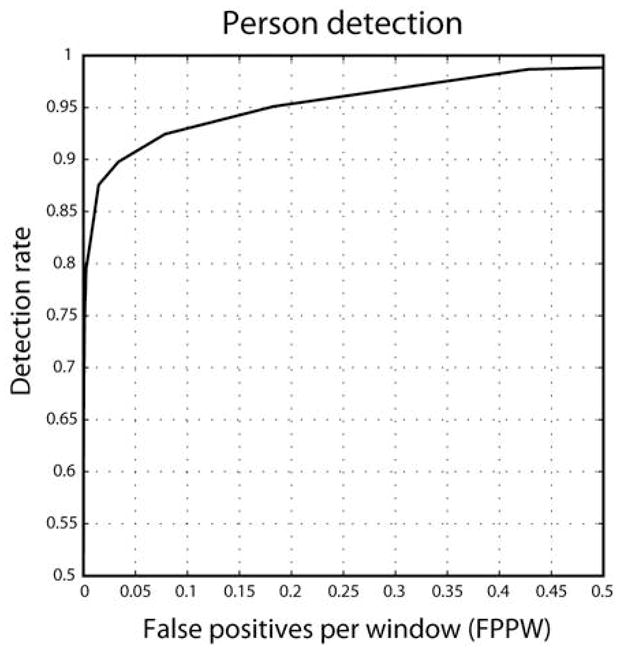
The ROC curve of the best implementation of the DT pedestrian detector, tested on our stimuli set.
Target features map
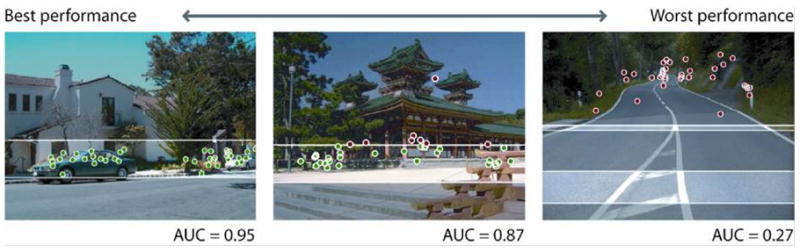
To generate target features maps for each image, the detector was run using a sliding window that moved across the image in steps of 8 pixels. Multiscale detection was achieved by iteratively reducing the image by 20% and rerunning the sliding window detector; this process was repeated until the image height was less than the height of the detector window (see Dalal & Triggs, 2005, for details). This meant that each pixel was involved in many detection windows, and therefore the detector returned many values for each pixel. We created the object detector map (MT) by assigning to each pixel the highest detection score returned for that pixel (from any detection window at any scale). As with the saliency map, the resulting object detector map was raised to an exponent (0.025, determined by iteratively varying the exponent to obtain the best performance on the validation set) and then blurred by applying a Gaussian filter with 50% cut-off frequency at an 8 cycles/image. Figure 6 shows maps of the best and worst predictions of the target features model on our stimuli set.
Figure 6.
Target features maps (thresholded at 20% of the image area). Dots represent human fixations.
Guidance by Scene Context Features
The mandatory role of scene context in object detection and search has been acknowledged for decades (for reviews, Bar, 2004; Chun, 2003; Oliva & Torralba, 2007). However, formal models of scene context guidance face the same problem as models of object appearance: they require knowledge about how humans represent visual scenes. Several models of scene recognition have been proposed in recent years (Bosch, Zisserman, & Muñoz, 2008; Fei-Fei & Perona, 2005; Grossberg, & Huang, in press; Lazebnik, Schmidt, & Ponce, 2006; Oliva & Torralba, 2001; Vogel & Schiele, 2007; Renninger & Malik, 2004), with most of the approaches summarizing an image’s “global” features by pooling responses from low-level filters at multiple scales and orientations sampled over regions in the image.
Our model of scene context implements a top-down constraint that selects “relevant” image regions for a search task. Top-down constraints in a people-search task, for example, would select regions corresponding to sidewalks but not sky or trees. As in Oliva and Torralba (2001), we adopted a representation of the image using a set of “global features” that provide a holistic description of the spatial organization of spatial frequencies and orientations in the image. The implementation was identical to the description in Torralba et al (2006), with the exception that the scene context model incorporated a finer spatial analysis (i.e. an 8×8 grid of non-overlapping windows) and was trained on more images (1880 images). From each training image, we produced 10 random crops of 320×240 pixels to generate a training set with a uniform distribution of target locations. As in Torralba et al (2006), the model learned the associations between the global features of an image and the location of the target. The trained computational context model compared the global scene features of a novel image with learned global scene features to predict the image region most highly associated with the presence of a pedestrian. This region is represented by a horizontal line at the height predicted by the model. Figure 7 shows maps of the best and worst predictions of the scene context model on our stimuli set.
Figure 7.
Scene context maps (thresholded at 20% of the image area). Dots represent human fixations.
There are cases where the scene context model failed to predict human fixations simply because it selected the wrong region (see Figures 7 and 8). In these cases, it would be interesting to see whether performance could be improved by a “context oracle” which knows the true context region in each image. It is possible to approximate contextual “ground truth” for an image by asking observers to indicate the best possible context region in each scene (Droll & Eckstein, 2008). With this information, we can establish an upper bound on the performance of a model based solely on scene context.
Figure 8.
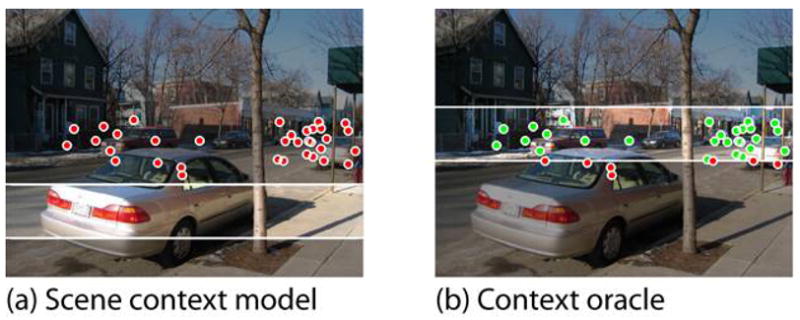
Comparison between (a) the computationally-defined scene context map and (b) the empirically-defined context oracle map for a single image (maps are thresholded at 20% of the image area; dots represent fixations).
Evaluating the ground truth of Scene Context: a “Context Oracle”
Seven new participants marked the context region for pedestrians in each scene in the database. The instructions were to imagine pedestrians in the most plausible places in the scene and to position a horizontal bar at the height where the heads would be. Participants were encouraged to use cues such as the horizon, the heights of doorways, and the heights of cars and signs in order to make the most accurate estimate of human head height. Image presentation was randomized and self-paced. Each participant’s results served as an individual “context model” which identified the contextually relevant location for a pedestrian for each scene. The “context oracle” was created by pooling responses from all observers. Context oracle maps (Figure 8), were created by applying a Gaussian blur to the horizontal line selected by each observer, and then summing the maps produced by all participants.
Guidance by a Combined Model of Attention
The three models were combined by multiplying the weighted maps as shown in Equation 1. The weights (γ1 = 0.1, γ2 = 0.85, γ3 = 0.05) were selected by testing various weights in the range [0,1] to find the combination which gave the best performance on the validation set. Examples of combined source model maps are shown in Figure 9.
Figure 9.
Combined source maps (thresholded at 20% of the image area). Dots represent human fixations.
Modeling Results
The ROC curves for all models are shown in Figure 10 and the performances are given in Table 1. Averaging across target absent and target present scenes, the scene context model predicted fixated regions with greater accuracy (AUC = 0.845) than models of saliency (0.795) or target features (0.811) alone. A combination of the three sources of guidance, however, resulted in greater overall accuracy (0.895) than any single source model, with the overall highest performance given by a model that integrated saliency and target features with the “context oracle” model of scene context (0.899). Relative to human agreement, the purely computational combined model achieved 94% of the AUC for human agreement in both target present and absent scenes. When the context oracle was substituted for the scene context model, the combined model achieved on average 96% of the AUC of human agreement.
Figure 10.
ROC curves for models. The ROC curves for human agreement and cross-image control correspond respectively to the upper and lower bounds of performance against which models were compared.
Table 1.
Summary of Performance of Human Observers, Single-Source Models, and Combined Source of Guidance Models.
| Area Under Curve | Performance at 20% Threshold | Performance at 10% Threshold | |
|---|---|---|---|
| Target Absent Scenes | |||
| Human Agreement | 0.930 | 0.923 | 0.775 |
| Cross-image Control | 0.683 | 0.404 | 0.217 |
| Saliency Model | 0.773 | 0.558 | 0.342 |
| Target Features Model | 0.778 | 0.539 | 0.313 |
| Scene Context Model | 0.845 | 0.738 | 0.448 |
| Context Oracle | 0.881 | 0.842 | 0.547 |
| Saliency × Target Features | 0.814 | 0.633 | 0.399 |
| Context × Saliency | 0.876 | 0.801 | 0.570 |
| Context × Target Features | 0.861 | 0.784 | 0.493 |
| Combined Source Model | 0.877 | 0.804 | 0.574 |
| Combined Model, using Context Oracle | 0.893 | 0.852 | 0.605 |
| Target Present Scenes | |||
| Human Agreement | 0.955 | 0.952 | 0.880 |
| Cross-image Control | 0.622 | 0.346 | 0.186 |
| Saliency Model | 0.818 | 0.658 | 0.454 |
| Target Features Model | 0.845 | 0.697 | 0.515 |
| Scene Context Model | 0.844 | 0.727 | 0.451 |
| Context Oracle | 0.889 | 0.867 | 0.562 |
| Saliency × Target Features | 0.872 | 0.773 | 0.586 |
| Context × Saliency | 0.894 | 0.840 | 0.621 |
| Context × Target Features | 0.890 | 0.824 | 0.606 |
| Combined Source Model | 0.896 | 0.845 | 0.629 |
| Combined Model, using Context Oracle | 0.906 | 0.886 | 0.646 |
Saliency and target features models
The saliency model had the lowest overall performance, with an AUC of 0.77 and 0.82 in target absent and present scenes. This performance is within the range of values given by other saliency models predicting fixations in free viewing tasks (AUC of 0.727 for Itti et al., 1998; 0.767 for Bruce & Tsotsos, 2006; see also Harel et al., 2005).
The best example shown in Figure 4 is typical of the type of scene in which the saliency model performs very well. The saliency model does best in scenes with large homogenous regions (sky, road), and in which most of the salient features coincide with the region where observers might reasonably expect to find the target. This illustrates the difficulty in determining how saliency influences eye movement guidance: in many cases, the salient regions of a real-world scene are also the most contextually relevant regions. In fact, recent studies suggest that the correlation between saliency and observer’s fixation selection may be an artifact of correlations between salience and higher-level information (Einhauser et al, 2008; Foulsham & Underwood, 2008; Henderson et al, 2007; Stirk & Underwood, 2007; Tatler, 2007). The saliency model can also give very poor predictions of human fixations in some scenes, as shown by the example in Figure 4. In a search task, saliency alone is a rather unreliable source of guidance because saliency is often created by an accidental feature (such as a reflection or a differently-colored gap between two objects) that does not necessarily correspond to an informative region.
In target present scenes, not surprisingly, the target features model (AUC = 0.85) performed significantly better than the saliency model (t(404) = 4.753, p < .001). In target absent scenes, however, the target features model (AUC = 0.78) did not perform significantly above the saliency model (t(405) < 1). Interestingly, both models were significantly correlated with each other (0.37, p < .001), suggesting that scenes for which the saliency model was able to predict fixations well tended to be scenes in which the target features model also predicted fixations well.
Figure 5 shows target absent images for which the target features model gave the best and worst predictions. Similar to the saliency model, the target model tended to perform best when most of the objects were concentrated within the contextually relevant region for a pedestrian. Also like the saliency model, the target features performed poorly when it selected accidental, non-object features of the image (such as tree branches that happened to overlap in a vaguely human-like shape). It is important to note that the performance of the target features model is not due solely to fixations on the target. In the target absent scenes, there was no target to find, yet the target features model was still able to predict human fixations significantly above the level of the cross-image control. Even in target present scenes, replacing predictions of the target features model with the true location of the target (a “target oracle”) did not explain the target model’s performance on this dataset7.
Context models
Overall, scene context was the most accurate single source of guidance in this search task. The computational model of scene context predicted fixation locations with an overall accuracy of 0.85 and 0.84 in target absent and present scenes respectively. The scene context model performed significantly better than the target features model in target absent scenes (t(405) = 11.122, p < .001), although the two models did not significantly differ in target present scenes (t(404)<1).
In the majority of our scenes, the computational scene context model gave a very good approximation of the location of search fixations. The first and second images in Figure 7 show the model’s best and median performance, respectively, for target absent scenes. In fact, the context model failed to predict fixated regions (i.e., had an AUC below the mean AUC of the cross-image control) in only 26 target absent scenes and 24 target present scenes. Typical failures are shown in Figures 7 and 8: in a few scenes, the model incorrectly identifies the relationship between scene layout and probable target location. In order to get around this problem and get a sense of the true predictive power of a context-only model of search guidance, we used the “context oracle.” The empirically-determined context oracle should be able to distinguish between cases in which the context model fails because it fails to identify the appropriate context region, and cases in which it fails because human fixations were largely outside the context region.
Overall performance of the context oracle was 0.88 and 0.89 for target absent and target present images respectively. The context oracle performed significantly better than the computational model of scene context in target absent (t(405) = 8.265, p < .001) and target present (t(404) = 8.861, p < .001) scenes. Unlike any of the computational models, the context oracle performed above chance on all images of the dataset; at worst, it performed at about the level of the average AUC for the cross-image control (0.68 for target absent scenes). Examples of these failures are shown in Figure 11.
Figure 11.
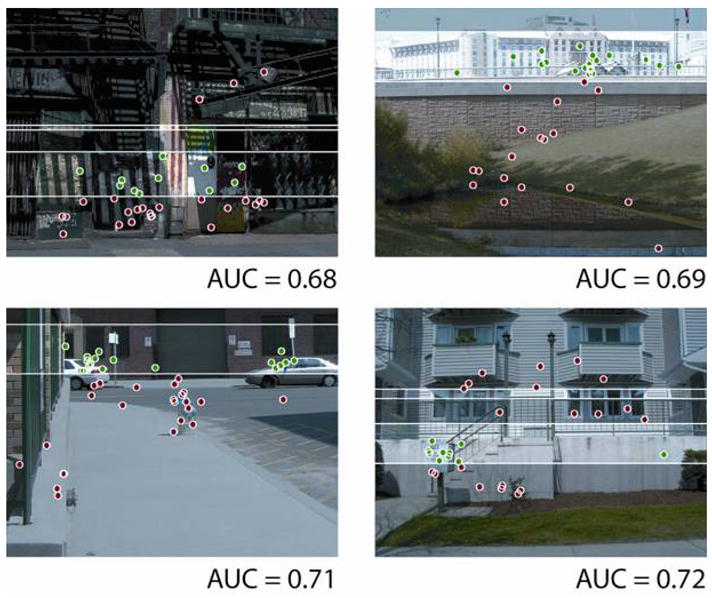
Target absent scenes on which the context oracle performed the worst, with their corresponding AUC values. Maps are thresholded at 20% of the image area; dots represent fixations.
Combined source models
A combined source model that integrated saliency, target features, and scene context outperformed all of the single-source models, with an overall AUC of 0.88 in target absent scenes and 0.90 in target present scenes (see Table 1). The combined guidance model performed better than the best single-source model (scene context) in both target absent (t(405) = 10.450, p < .001) and target present (t(404) = 13.501, p < .001) scenes.
Across the image set, performance of the combined model was strongly correlated with that of the scene context model (r = 0.80, p < .001 in target absent scenes). The combined model was also moderately correlated with the saliency model (r = 0.51, p < .001 in target absent scenes), and the target features model correlated weakly (r = 0.25, p < 0.001 in target absent scenes). Taken together, this suggests that the success or failure of the combined model depended largely on the success or failure of its scene context component, and less on the other two components.
In order to analyze the combined model in greater detail, we also tested partial models that were missing one of the three sources of guidance (see Table 1). Removing the saliency component of the combined model produced a small but significant drop in performance in target absent (t(405) = 6.922, p < .001) and target present (t(404) = 2.668, p < .01) scenes. Likewise, removing the target features component of the model also produced a small but significant drop in performance in target absent (t(405) = 5.440, p < .001) and target present (t(404) = 10.980, p < .001) scenes. The high significance value of these extremely small drops in performance is somewhat deceptive; the reasons for this are addressed in the general discussion. Notably, the largest drop in performance resulted when the scene context component was removed from the combined model (target absent: t(405) = 17.381, p < .001; target present: t(404) = 6.759, p < .001).
Interestingly, the combined source model performed very similarly to the empirically-defined context oracle. The difference between these two models was not significant in target absent (t(405) = −1.233, p = .218) or target present (t(404) = 2.346, p = .019) scenes.
Finally, the high performance of the context oracle motivated us to substitute it for the scene context component of the combined model, to see whether performance could be boosted even further. Indeed, substituting the context oracle for computational scene context improved performance in both target absent (t(405) = 5.565, p < .001) and target present (t(404) = 3.461, p = .001) scenes. The resulting hybrid model was almost entirely driven by the context oracle, as suggested by its very high correlation with the context oracle (r = 0.97, p < .001 in target absent scenes).
Discussion
We assembled a large dataset of 912 real world scenes and recorded eye movements from observers performing a visual search task. The scene regions fixated were very consistent across different observers, regardless of whether the target was present or absent in the scene. Motivated by the regularity of search behavior, we implemented computational models for several proposed methods of search guidance and evaluated how well these models predicted observers’ fixation locations. Over the entire database, the scene context model generated better predictions on target absent scenes (it was the best single map in 276 out of the 406 scenes) than saliency (71 scenes) or target features (59 scenes) models. Even in target present scenes, scene context provided better predictions (191 of 405 scenes) than saliency (72 scenes) but only slightly more than target features (142 scenes). Ultimately, combining models of attentional guidance predicted 94% of human agreement, with the scene context component providing the most explanatory power.
Although the combined model is reasonably accurate at predicting human fixations, there is still room for improvement. Moving forward, even small improvements in model specificity will represent a significant achievement. Our data shows that human observers are reasonable predictors of fixations even as map selectivity increases: 94% and 83% accuracy for selected region sizes of 20% and 10% respectively. In contrast, the accuracy of all models fell off drastically as map selectivity increased and a region size of roughly 40% is needed for the combined source model to achieve the same detection rate as human observers. Figure 12 illustrates this gap between the best computational model and human performance: observers’ fixations are tightly clustered in very specific regions, but the model selects a much more general region containing many non-fixated objects. In the following, we offer several approaches that may contribute to an improved representation of search guidance in real-world scenes.
Figure 12.
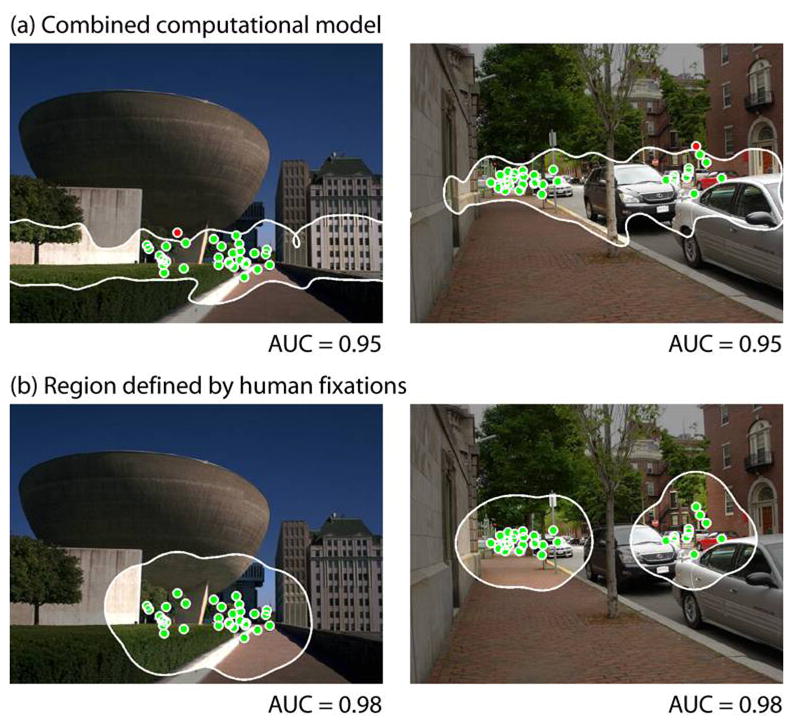
Illustration of the discrepancy between regions selected by (a) the combined computational model and (b) human fixations.
In our work, a “context region” is operationally defined as an association between certain scene regions and the presence of a target. Under this definition, a context region can be specified for any class of target and modeled using many representations. In this study, our model of scene context generated predictions based on a learned association between a representation of global image statistics and the location of a person in the scene. Compared to a model of image saliency or a model of target-like features, we found that a scene context model was better able to predict the region where people would look, regardless of whether the target was present in the scene. Moreover, the high overall accuracy of a computational combined source model was matched by an empirically-derived context oracle, created by an independent set of participants marking the region which they deemed most likely to contain the target. In target absent scenes, there was a substantial correlation between the context oracle and human agreement (r=0.54, p<.001), and also between the context oracle and the combined model (r=0.50, p<.001). This suggests that examining failures of the context oracle may hint at ways in which the combined model’s representation fails to match human search patterns.
Figure 11 shows the worst performance of the context oracle for target absent scenes. Why was contextual guidance insufficient for predicting the fixated regions of these scenes? One reason may be that our model of the context region did not adequately represent the real context region in certain complex scenes. We modeled the context region as a single height in the image plane, which is appropriate for most images (typically pedestrians appear on the ground plane and nowhere else). However, when the scenes contain multiple surfaces (such as balconies, ramps, and stairs) at different heights, the simplified model tends to fail. Improving the implementation of scene context to reflect that observers have expectations associated with multiple scene regions may reduce the discrepancy between model predictions and where observers look.
In addition, observers may be guided by contextual information beyond what is represented here. It is important to note that scene context can be represented with a number of approaches. Associations between the target and other objects in the scene, for example, may also contribute to search guidance (Kumar & Hebert, 2005; Rabinovich, Vedaldi, Galleguillos, Wiewiora & Belongie, 2007; Torralba, Murphy & Freeman, 2004, 2007). In our search task, for example, the presence of a person may be more strongly associated with a doorway than a garbage can. The role of semantic influences in search guidance remains an interesting and open question. In this issue, Zelinsky & Schmidt explore an intermediate between search of semantically meaningful scenes and search in which observers lack expectations of target location. They find evidence that scene segmentation and flexible semantic cues can be used very rapidly to bias search to regions associated with the target (see also Eckstein et al, 2006; Neider & Zelinsky, 2006).
Scene context seems to provide the most accurate predictions in this task, which provokes the question: Is scene context typically the dominant source of guidance in real world search tasks? Similarly, how well do the findings of this study generalize to search for other object classes? Our search task may be biased toward context-guided search in the following ways. First, observers may have been biased to adopt a context-based strategy rather than relying on target features simply because the target pedestrians were generally very small (less than 1% of image area) and often occluded, so a search strategy based mainly on target features might have produced more false alarms than detections. Second, the large database tested here represented both semantically-consistent associations (pedestrians were supported by surfaces; Biederman et al, 1982) and location-consistent associations (pedestrians were located on ground surfaces). As a result, even when the target was absent from the scene, viewers expected to find their target within the context region, and therefore the scene context model predicted fixations more effectively than the target-features or saliency models. Searching scenes in which the target location violated these prior expectations (e.g. person on a cloud or rooftop) might bias the pattern of fixations such that emphasis on different sources of guidance is different from the weights on the current model.
A fully generalizeable model of search behavior may need to incorporate flexible weights on the individual sources of search guidance. Consider the example of searching for a pen in an office. Looking for a pen from the doorway may induce strategies based on convenient object relations, such as looking first to a desk, which is both strongly associated with the target and easy to discriminate from background objects. On the other hand, looking for a pen while standing in front of the desk may encourage the use of other strategies, such as searching for pen-like features. It follows that the features of the target may vary in informativeness as an observer navigates through their environment. A counting task, for example, may enhance the importance of a target features model (see Kanan, Tong, Zhang, & Cottrell, this issue). The implications for the combined source model of guidance are that, not only would the model benefit from an improved representation of target features (e.g. Zelinsky, 2008) or saliency (see Kanan, Tong, Zhang, & Cottrell, this issue) or context, but the weights themselves may need to be flexible, depending on constraints not currently modeled.
In short, there is much room for further exploration: we need to investigate a variety of natural scene search tasks in order to fully understand the sources of guidance that drive attention and how they interact. It is important to acknowledge that we have chosen to implement only one of several possible representations of image saliency, target features, or scene context. Therefore, performance of the individual guidance models discussed in this paper may vary with different computational approaches. Our aim, nevertheless, is to set a performance benchmark for how accurately a model representing combined sources of guidance can predict where human observers will fixate during natural search tasks.
Concluding remarks
We present a model of search guidance which combines saliency, target-features, and scene context, and accounts for 94% of the agreement between human observers searching for targets in over 900 scenes. In this people-search task, the scene context model proves to be the single most important component driving the high performance of the combined source model. None of the models, however, fully capture the selectivity of the human-based attentional map. A comprehensive understanding of search behavior may require that future models capture mechanisms that underlie the tight clustering of search fixations.
Supplementary Material
Acknowledgments
The authors would like to thank two anonymous reviewers and Benjamin Tatler for their helpful and insightful comments on an earlier version of this manuscript. K.A.E. was partly funded by a Singleton graduate research fellowship and by a graduate fellowship from an Integrative Training Program in Vision grant (T32 EY013935). B.H.S was funded by a National Science Foundation Graduate Research Fellowship. This work was also funded by an NSF CAREER award (0546262) and a NSF contract (0705677) to A.O., as well as an NSF CAREER award to A.T (0747120). Supplementary information available on the following website: http://cvcl.mit.edu/SearchModels.
Footnotes
The complete dataset and analysis tools will be made available at the authors’ website.
See additional figures on authors’ website for distribution of targets and fixations across all images in the database
In our validation set, the best exponent for the saliency map was 0.025, which is within the optimal range of 0.01–0.3 found by Torralba et al (2006).
See people detector code at http://pascal.inrialpes.fr/soft/olt/
See the authors’ website for details and results from the other implementations.
See the authors’ website for the detection curves of the other model implementations.
See the authors’ website for a comparison of the ROC curves of the target features model and the target oracle.
Contributor Information
Krista A. Ehinger, Email: kehinger@mit.edu.
Barbara Hidalgo-Sotelo, Email: bhs@mit.edu.
Antonio Torralba, Email: torralba@mit.edu.
Aude Oliva, Email: oliva@mit.edu.
References
- Andrews TJ, Coppola DM. Idiosyncratic characteristics of saccadic eye movements when viewing different visual environments. Vision Research. 1999;39:2947–2953. doi: 10.1016/s0042-6989(99)00019-x. [DOI] [PubMed] [Google Scholar]
- Araujo C, Kowler E, Pavel M. Eye movements during visual search: The cost of choosing the optimal path. Vision Research. 2001;41:3613–3625. doi: 10.1016/s0042-6989(01)00196-1. [DOI] [PubMed] [Google Scholar]
- Bar M. Visual objects in context. Nature Reviews Neuroscience. 2004;5:617–629. doi: 10.1038/nrn1476. [DOI] [PubMed] [Google Scholar]
- Biederman I, Mezzanotte RJ, Rabinowitz JC. Scene perception: detecting and judging objects undergoing relational violations. Cognitive Psychology. 1982;14:143–177. doi: 10.1016/0010-0285(82)90007-x. [DOI] [PubMed] [Google Scholar]
- Bosch A, Zisserman A, Muñoz X. Scene classification using a hybrid generative/discriminative approach. IEEE Transactions on Pattern Analysis and Machine Intelligence. 2008;30:712–727. doi: 10.1109/TPAMI.2007.70716. [DOI] [PubMed] [Google Scholar]
- Brainard DH. The Psychophysics Toolbox. Spatial Vision. 1997;10:433–436. [PubMed] [Google Scholar]
- Bruce N, Tsotsos JK. Saliency Based on Information Maximization. Advances in Neural Information Processing Systems. 2006;18:155–162. [Google Scholar]
- Buswell GT. How people look at pictures. Oxford: Oxford University Press; 1935. [Google Scholar]
- Castelhano MS, Henderson JM. Initial Scene Representations Facilitate Eye Movement Guidance in Visual Search. Journal of Experimental Psychology: Human Perception and Performance. 2007;33:753–763. doi: 10.1037/0096-1523.33.4.753. [DOI] [PubMed] [Google Scholar]
- Chaumon M, Drouet V, Tallon-Baudry C. Unconscious associative memory affects visual processing before 100 ms. Journal of Vision. 2008;8(3):10, 1–10. doi: 10.1167/8.3.10. [DOI] [PubMed] [Google Scholar]
- Chen X, Zelinsky GJ. Real-world visual search is dominated by top-down guidance. Vision Research. 2006;46:4118–4133. doi: 10.1016/j.visres.2006.08.008. [DOI] [PubMed] [Google Scholar]
- Chun MM. Scene perception and memory. In: Irwin DE, Ross BH, editors. The psychology of learning and motivation: Advances in research and theory. Vol. 42. San Diego, CA: Academic Press; 2003. pp. 79–108. [Google Scholar]
- Dalal N, Triggs B. Histograms of Oriented Gradients for Human Detection. IEEE Conference on Computer Vision and Pattern Recognition. 2005;2:886–893. [Google Scholar]
- Dalal N, Triggs B, Schmid C. Human detection using oriented histograms of flow and appearance. European Conference on Computer Vision. 2006;2:428–441. [Google Scholar]
- De Graef P, Christiaens D, d’Ydevalle G. Perceptual effects of scene context on object identification. Psychological Research. 1990;52:317–329. doi: 10.1007/BF00868064. [DOI] [PubMed] [Google Scholar]
- Droll J, Eckstein M. Expected object position of two hundred fifty observers predicts first fixations of seventy seven separate observers during search. Journal of Vision. 2008;8(6):320. [Google Scholar]
- Eckstein MP, Drescher BA, Shimozaki SS. Attentional Cues in Real Scenes, Saccadic Targeting and Bayesian Priors. Psychological Science. 2006;17:973–980. doi: 10.1111/j.1467-9280.2006.01815.x. [DOI] [PubMed] [Google Scholar]
- Einhäuser W, Rutishauser U, Koch C. Task-demands can immediately reverse the effects of sensory-driven saliency in complex visual stimuli. Journal of Vision. 2008;8(2):2, 1–19. doi: 10.1167/8.2.2. [DOI] [PubMed] [Google Scholar]
- Elazary L, Itti L. Interesting objects are visually salient. Journal of Vision. 2008;8(3):3, 1–15. doi: 10.1167/8.3.3. [DOI] [PubMed] [Google Scholar]
- Fei Fei L, Perona P. A Bayesian Hierarchical model for learning natural scene categories. IEEE Proceedings in Computer Vision and Pattern Recognition. 2005;2:524–531. [Google Scholar]
- Fei Fei L, Iyer A, Koch C, Perona P. What do we perceive in a glance of a real-world scene? Journal of Vision. 2007;7(1):1–29. doi: 10.1167/7.1.10. [DOI] [PubMed] [Google Scholar]
- Friedman A. Framing pictures: the role of knowledge in automatized encoding and memory of gist. Journal of Experimental Psychology: General. 1979;108:316–355. doi: 10.1037//0096-3445.108.3.316. [DOI] [PubMed] [Google Scholar]
- Grossberg S, Huang T-R. ARTSCENE: A neural system for natural scene classification. Journal of Vision. doi: 10.1167/9.4.6. in press. [DOI] [PubMed] [Google Scholar]
- Hayhoe M, Ballard D. Eye movements in natural behavior. Trends in Cognitive Sciences. 2005;9:188–194. doi: 10.1016/j.tics.2005.02.009. [DOI] [PubMed] [Google Scholar]
- Hayhoe M, Shrivastava A, Mruczek R, Pelz JB. Visual memory and motor planning in a natural task. Journal of Vision. 2003;3:49–63. doi: 10.1167/3.1.6. [DOI] [PubMed] [Google Scholar]
- Harel J, Koch C, Perona P. Graph-based visual saliency. Advances in Neural Information Processing Systems. 2006;19:545–552. [Google Scholar]
- Henderson JM. Human gaze control in real-world scene perception. Trends in Cognitive Sciences. 2003;7:498–504. doi: 10.1016/j.tics.2003.09.006. [DOI] [PubMed] [Google Scholar]
- Henderson JM, Brockmole JR, Castelhano MS, Mack M. Visual saliency does not account for eye movement during visual search in real-world scenes. In: Gompel van R, Fischer M, Murray W, Hill R., editors. Eye Movement Research: Insights into Mind and Brain. Oxford: Elsevier; 2007. pp. 537–562. [Google Scholar]
- Henderson JM, Weeks PA, Jr, Hollingworth A. Effects of semantic consistency on eye movements during scene viewing. Journal of Experimental Psychology: Human Perception and Performance. 1999;25:210–228. [Google Scholar]
- Hoiem D, Efros AA, Hebert M. Putting objects in perspective. IEEE Conference on Computer Vision and Pattern Recognition. 2006;2:2137–2144. [Google Scholar]
- Findlay JM. Eye scanning and visual search. In: Henderson JM, Ferreira F, editors. The interface of language, vision and action: Eye movements and the visual world. New York: Psychology Press; 2004. pp. 135–150. [Google Scholar]
- Foulsham T, Underwood G. What can saliency models predict about eye movements? Spatial and sequential aspects of fixations during encoding and recognition. Journal of Vision. 2008;8(2):6, 1–17. doi: 10.1167/8.2.6. [DOI] [PubMed] [Google Scholar]
- Greene MR, Oliva A. Recognition of Natural Scenes from Global Properties: Seeing the Forest Without Representing the Trees. Cognitive Psychology. 2009;58(2):137–179. doi: 10.1016/j.cogpsych.2008.06.001. [DOI] [PMC free article] [PubMed] [Google Scholar]
- Itti L, Koch C, Niebur E. A model of saliency-based visual attention for rapid scene analysis. IEEE Trans Pattern Analysis and Machine Vision. 1998;20(11):12–54. [Google Scholar]
- Itti L, Koch C. Computational Modeling of Visual Attention. Nature Reviews Neuroscience. 2001;2:194–203. doi: 10.1038/35058500. [DOI] [PubMed] [Google Scholar]
- Itti L, Koch C. A saliency-based search mechanism for overt and covert shifts of visual attention. Vision Research. 2000;40:1489–1506. doi: 10.1016/s0042-6989(99)00163-7. [DOI] [PubMed] [Google Scholar]
- Joubert O, Rousselet G, Fize D, Fabre-Thorpe M. Processing scene context: Fast categorization and object interference. Vision Research. 2007;47:3286–3297. doi: 10.1016/j.visres.2007.09.013. [DOI] [PubMed] [Google Scholar]
- Koch C, Ullman S. Shifts in visual attention: Towards the underlying circuitry. Human Neurobiology. 1985;4:219–227. [PubMed] [Google Scholar]
- Kumar S, Hebert M. A hierarchical field framework for unified context-based classification. IEEE International Conference on Computer Vision (ICCV) 2005;2:1284–1291. [Google Scholar]
- Land MF, Lee DN. Where we look when we steer. Nature. 1994;369:742–744. doi: 10.1038/369742a0. [DOI] [PubMed] [Google Scholar]
- Land MF, McLeod P. From eye movements to actions: How batsmen hit the ball. Nature Neuroscience. 2000;3:1340–1345. doi: 10.1038/81887. [DOI] [PubMed] [Google Scholar]
- Lazebnik S, Schmidt C, Ponce J. Beyond bags of features: spatial pyramid matching for recognizing natural scene categories. IEEE Conference on Computer Vision and Pattern Recognition. 2006;2:2169–2178. [Google Scholar]
- Li Z. A saliency map in primary visual cortex. Trends in Cognitive Sciences. 2002;6(1):9–16. doi: 10.1016/s1364-6613(00)01817-9. [DOI] [PubMed] [Google Scholar]
- Loftus GR, Mackworth NH. Cognitive determinants of fixation location during picture viewing. Journal of Experimental Psychology: Human Perception and Performance. 1978;4:565–572. doi: 10.1037//0096-1523.4.4.565. [DOI] [PubMed] [Google Scholar]
- Mannan S, Ruddock KH, Wooding DS. Automatic control of saccadic eye movements made in visual inspection of briefly presented 2-D images. Spatial Vision. 1995;9:363–386. doi: 10.1163/156856895x00052. [DOI] [PubMed] [Google Scholar]
- McCotter M, Gosselin F, Sowden P, Schyns PG. The use of visual information in natural scenes. Visual Cognition. 2005;12:938–953. [Google Scholar]
- Neider MB, Zelinsky GJ. Scene context guides eye movements during visual search. Vision Research. 2006;46:614–621. doi: 10.1016/j.visres.2005.08.025. [DOI] [PubMed] [Google Scholar]
- Noton D, Stark L. Scanpaths in eye movements during pattern perception. Science. 1971;171(3968):308–311. doi: 10.1126/science.171.3968.308. [DOI] [PubMed] [Google Scholar]
- Oliva A, Torralba A. Modeling the shape of the scene: A holistic representation of the spatial envelope. International Journal of Computer Vision. 2001;42:145–175. [Google Scholar]
- Oliva A, Torralba A. Building the gist of a scene: The role of global image features in recognition. Progress in Brain Research: Visual Perception. 2006;155:23–36. doi: 10.1016/S0079-6123(06)55002-2. [DOI] [PubMed] [Google Scholar]
- Oliva A, Torralba A. The role of context in object recognition. Trends in Cognitive Sciences. 2007;11(12):520–527. doi: 10.1016/j.tics.2007.09.009. [DOI] [PubMed] [Google Scholar]
- Papageorgiou C, Poggio T. A trainable system for object detection. International Journal of Computer Vision. 2000;38(1):15–33. [Google Scholar]
- Parkhurst DJ, Niebur E. Scene content selected by active vision. Spatial Vision. 2003;16(2):125–154. doi: 10.1163/15685680360511645. [DOI] [PubMed] [Google Scholar]
- Parkhurst DJ, Law K, Niebur E. Modeling the role of salience in the allocation of overt visual attention. Vision Research. 2002;42:107–123. doi: 10.1016/s0042-6989(01)00250-4. [DOI] [PubMed] [Google Scholar]
- Pelli DG. The VideoToolbox software for visual psychophysics: Transforming numbers into movies. Spatial Vision. 1997;10:437–442. [PubMed] [Google Scholar]
- Peters RJ, Iyer A, Itti L, Koch C. Components of bottom-up gaze allocation in natural images. Vision Research. 2005;45:2397–2416. doi: 10.1016/j.visres.2005.03.019. [DOI] [PubMed] [Google Scholar]
- Rabinovich A, Vedaldi A, Galleguillos C, Wiewiora E, Belongie S. Objects in Context. IEEE International Conference on Computer Vision (ICCV) 2007:1–8. [Google Scholar]
- Rao RPN, Zelinsky G, Hayhoe MM, Ballard DH. Eye movements in iconic visual search. Vision Research. 2002;42:1447–1463. doi: 10.1016/s0042-6989(02)00040-8. [DOI] [PubMed] [Google Scholar]
- Rayner K. Eye movements in reading and information processing: 20 years of research. Psychological Bulletin. 1998;124:372–422. doi: 10.1037/0033-2909.124.3.372. [DOI] [PubMed] [Google Scholar]
- Renninger LW, Malik J. When is scene identification just texture recognition? Vision Research. 2004;44:2301–2311. doi: 10.1016/j.visres.2004.04.006. [DOI] [PubMed] [Google Scholar]
- Renninger LW, Verghese P, Coughlan J. Where to look next? Eye movements reduce local uncertainty. Journal of Vision. 2007;7(3):6, 1–17. doi: 10.1167/7.3.6. [DOI] [PubMed] [Google Scholar]
- Rodriguez-Sanchez AJ, Simine E, Tsotsos JK. Attention and visual search. International Journal of Neural Systems. 2007;17(4):275–288. doi: 10.1142/S0129065707001135. [DOI] [PubMed] [Google Scholar]
- Rosenholtz R. A simple saliency model predicts a number of motion popout phenomena. Vision Research. 1999;39:3157–3163. doi: 10.1016/s0042-6989(99)00077-2. [DOI] [PubMed] [Google Scholar]
- Rosenholtz R, Li Y, Nakano L. Measuring visual clutter. Journal of Vision. 2007;7(2):17, 1–22. doi: 10.1167/7.2.17. [DOI] [PubMed] [Google Scholar]
- Rousselet GA, Joubert OR, Fabre-Thorpe M. How long to get to the “gist” of real-world natural scenes? Visual Cognition. 2005;12:852–877. [Google Scholar]
- Russell B, Torralba A, Murphy K, Freeman WT. LabelMe: a database and web-based tool for image annotation. International Journal of Computer Vision. 2008;77:157–173. [Google Scholar]
- Schyns PG, Oliva A. From blobs to boundary edges: Evidence for time- and spatial-scale-dependent scene recognition. Psychological Science. 1994;5:195–200. [Google Scholar]
- Serre T, Wolf L, Bileschi S, Riesenhuber M, Poggio T. Object recognition with cortex-like mechanisms. IEEE Transactions on Pattern Analysis and Machine Intelligence. 2007;29(3):411–426. doi: 10.1109/TPAMI.2007.56. [DOI] [PubMed] [Google Scholar]
- Stirk JA, Underwood G. Low-level visual saliency does not predict change detection in natural scenes. Journal of Vision. 2007;7(10):3, 1–10. doi: 10.1167/7.10.3. [DOI] [PubMed] [Google Scholar]
- Tatler BW. The central fixation bias in scene viewing: selecting an optimal viewing position independently of motor biases and image feature distributions. Journal of Vision. 2007;7(14):4, 1–17. doi: 10.1167/7.14.4. [DOI] [PubMed] [Google Scholar]
- Tatler BW, Baddeley RJ, Gilchrist ID. Visual correlates of fixation selection: Effects of scale and time. Vision Research. 2005;45(5):643–659. doi: 10.1016/j.visres.2004.09.017. [DOI] [PubMed] [Google Scholar]
- Tatler BW, Baddeley RJ, Vincent BT. The long and the short of it: Spatial statistics at fixation vary with saccade amplitude and task. Vision Research. 2006;46(12):1857–1862. doi: 10.1016/j.visres.2005.12.005. [DOI] [PubMed] [Google Scholar]
- Turano KA, Geruschat DR, Baker FH. Oculomotor strategies for the direction of gaze tested with a real-world activity. Vision Research. 2003;43:333–346. doi: 10.1016/s0042-6989(02)00498-4. [DOI] [PubMed] [Google Scholar]
- Torralba A. Modeling global scene factors in attention. Journal of Optical Society of America A. Special Issue on Bayesian and Statistical Approaches to Vision. 2003a;20(7):1407–1418. doi: 10.1364/josaa.20.001407. [DOI] [PubMed] [Google Scholar]
- Torralba A. Contextual priming for object detection. International Journal of Computer Vision. 2003b;53(2):169–191. [Google Scholar]
- Torralba A, Oliva A. Depth estimation from image structure. IEEE Pattern Analysis and Machine Intelligence. 2002;24:1226–1238. [Google Scholar]
- Torralba A, Fergus R, Freeman WT. 80 million tiny images: a large dataset for non-parametric object and scene recognition. IEEE Transactions on Pattern Analysis and Machine Intelligence. 2008;30:1958–1970. doi: 10.1109/TPAMI.2008.128. [DOI] [PubMed] [Google Scholar]
- Torralba A, Murphy KP, Freeman WT. Contextual Models for Object Detection using Boosted Random Fields. Advances in Neural Information Processing Systems. 2005;17:1401–1408. [Google Scholar]
- Torralba A, Murphy KP, Freeman WT. Sharing visual features for multiclass and multiview object detection. IEEE Transactions on Pattern Analysis and Machine Intelligence. 2007;29(5):854–869. doi: 10.1109/TPAMI.2007.1055. [DOI] [PubMed] [Google Scholar]
- Torralba A, Oliva A, Castelhano M, Henderson JM. Contextual guidance of eye movements and attention in real-world scenes: The role of global features in object search. Psychological Review. 2006;113:766–786. doi: 10.1037/0033-295X.113.4.766. [DOI] [PubMed] [Google Scholar]
- Treisman A, Gelade G. A feature integration theory of attention. Cognitive Psychology. 1980;12:97–136. doi: 10.1016/0010-0285(80)90005-5. [DOI] [PubMed] [Google Scholar]
- Tsotsos JK, Culhane SM, Wai WYK, Lai YH, Davis N, Nuflo F. Modeling visual-attention via selective tuning. Artificial Intelligence. 1995;78:507–545. [Google Scholar]
- Ullman S, Vidal-Naquet M, Sali E. Visual features of intermediate complexity and their use in classification. Nature Neuroscience. 2002;5:682–687. doi: 10.1038/nn870. [DOI] [PubMed] [Google Scholar]
- van Zoest W, Donk M, Theeuwes J. The role of stimulus-driven and goal-driven control in saccadic visual selection. Journal of Experimental Psychology: Human Perception and Performance. 2004;30:746–759. doi: 10.1037/0096-1523.30.4.749. [DOI] [PubMed] [Google Scholar]
- Viviani P. Eye movements in visual search: cognitive, perceptual and motor control aspects. Reviews Oculomotor Research. 1990;4:353–393. [PubMed] [Google Scholar]
- Vogel J, Schiele B. Semantic scene modeling and retrieval for content-based image retrieval. International Journal of Computer Vision. 2007;72(2):133–157. [Google Scholar]
- Wolfe JM. Guided search 2.0: A revised model of visual search. Psychonomic Bulletin and Review. 1994;1:202–228. doi: 10.3758/BF03200774. [DOI] [PubMed] [Google Scholar]
- Wolfe JM. Guided Search 4.0: Current Progress with a model of visual search. In: Gray W, editor. Integrated Models of Cognitive Systems. New York: Oxford Press; 2007. pp. 99–119. [Google Scholar]
- Wolfe JM, Cave KR, Franzel SL. Guided Search: An alternative to the Feature Integration model for visual search. Journal of Experimental Psychology: Human Perception and Performance. 1989;15:419–43. doi: 10.1037//0096-1523.15.3.419. [DOI] [PubMed] [Google Scholar]
- Wolfe JM, Horowitz TS. What attributes guide the deployment of visual attention and how do they do it? Nature Reviews Neuroscience. 2004;5(6):495–501. doi: 10.1038/nrn1411. [DOI] [PubMed] [Google Scholar]
- Yarbus A. Eye movements and vision. New York: Plenum; 1967. [Google Scholar]
- Zelinsky GJ. A theory of eye movements during target acquisition. Psychological Review. 2008;115:787–835. doi: 10.1037/a0013118. [DOI] [PMC free article] [PubMed] [Google Scholar]
Associated Data
This section collects any data citations, data availability statements, or supplementary materials included in this article.