Abstract
The replica exchange (RE) method is increasingly used to improve sampling in molecular dynamics (MD) simulations of biomolecular systems. Recently, we implemented the united-residue UNRES force field for mesoscopic MD. Initial results from UNRES MD simulations show that we are able to simulate folding events that take place in a microsecond or even a millisecond time scale. To speed up the search further, we applied the multiplexing replica exchange molecular dynamics (MREMD) method. The multiplexed variant (MREMD) of the RE method, developed by Rhee and Pande, differs from the original RE method in that several trajectories are run at a given temperature. Each set of trajectories run at a different temperature constitutes a layer. Exchanges are attempted not only within a single layer but also between layers. The code has been parallelized and scales up to 4000 processors. We present a comparison of canonical MD, REMD, and MREMD simulations of protein folding with the UNRES force-field. We demonstrate that the multiplexed procedure increases the power of replica exchange MD considerably and convergence of the thermodynamic quantities is achieved much faster.
1. Introduction
The dynamics of proteins and protein folding plays a fundamental role in biological processes, such as enzymatic reactions, signal transduction, immunological processes, and cell motility, and also in malignant processes, such as cancer and amyloid formation.1 Recent advancement of single-molecule studies2 facilitates the experimental investigation of the folding pathways of some proteins, but generally, experimental studies of the mechanisms of protein folding are restricted to techniques that provide only indirect and fragmentary information, leaving a wide room to interpretation. Therefore, simulation techniques are used widely to study the dynamics and mechanisms of protein folding. The development of new methods of simulation of mechanisms of protein folding and comparison of theoretical and experimental characteristics of protein folding is of crucial importance for advancing our understanding of biological systems.
Because of the complexity of the systems, all-atom studies of protein folding are mostly restricted to unfolding simulations, starting from the experimental structure, except for small proteins.3 However, even for small proteins, only a few trajectories can be run, which does not make it readily possible to compare the results with those of experiments that provide ensemble-averaged properties. To carry out large-scale simulations, one has to resort to reduced models of proteins; most of such simulations are carried out with the use of Gō-like4,5 or related6,7 potentials, which are biased toward the native structure, or model potentials,8 which can reproduce general features of protein folding. Small-scale motions are also studied by using elastic-network models.9 This is because most of the existing realistic and general coarse-grained potentials perform well (in particular, they can predict the native structure of a protein) when used in connection with information extracted from protein databases, which is not acceptable when studying protein dynamics. In turn, the reason for the deficiency of the coarse-grained potentials lies in their derivation either by analogy to all-atom force fields or from database statistics; neither method offers a clear way of first-principle systematic derivation of the force field.
The coarse-grained UNRES (united-residue) force field10–15 developed in our laboratory has been derived from first principles13 as a cluster-cumulant16 expansion of the restricted free energy (or potential of mean force) of a polypeptide chain immersed in water, where secondary degrees of freedom have been integrated out. This approach enabled us to introduce the essential multibody terms in a systematic and database-independent way. The optimization of the parameters of the force field was performed with a novel method,17–19 which makes use of the hierarchical structure of the protein energy landscape. The optimized force field was applied to search for the global energy minimum, and predicted complete structures or large portions of structure of proteins in CASP blind test experiments without ancillary information from protein structural databases.20 Recently, we implemented the united-residue UN-RES force field for mesoscopic molecular dynamics (MD).21–24 Initial results from UNRES MD simulations show that we are able to simulate folding events which take place in a microsecond or even a millisecond time scale.
Methods such as canonical MD or Metropolis Monte Carlo (MC) can be used for estimating thermodynamical properties, as well as for a global search, but in practice, they easily become trapped and thus are not effective methods for studying rough free-energy landscapes of proteins. Efficient conformational sampling algorithms are an essential component of methods for studying protein structure and dynamics. One of the most effective sampling methods, the replica exchange method (RE, also known as exchange MC25 or parallel tempering26), was initially developed to improve sampling in glassy systems in statistical physics. However, following Hansmann’s use of the method in simulations of a simple peptide, Met-enkephalin26 and Sugita and Okamoto’s formulation of an MD version of the algorithm,27 the RE method has been applied extensively in biomolecular simulations.
The replica exchange MD (REMD) method combines the idea of simulated annealing MD and MC methods and is one of the generalized-ensemble algorithms that perform a random walk in energy space because of a free random walk in temperature space. In the REMD method, n replica systems, each in the canonical ensemble and each at a different temperature, are simulated. At given intervals, swaps or exchanges of the configurational variables between systems are accepted with the Metropolis criterion. This is equivalent to exchanges of temperatures because the set of n replica systems can be treated as the set of n continuous MD trajectories of varying temperatures or the set of n canonical ensembles at particular temperatures with structures from all trajectories sorted by temperature. In this paper, we investigate the use of UNRES in multiplexed REMD (MREMD) introduced by Rhee and Pande.28 In MREMD, to enhance sampling, the replicas are multiplexed with a number of independent molecular dynamics runs at each temperature. Exchanges of configurations between random replicas of neighboring temperatures are tried as in REMD, but there is a larger number of such pairs in MREMD than in REMD. In MREMD, it can be considered that there are several layers of replicas, each of which has all different temperature levels and is equivalent to a single REMD simulation. Exchanges between replicas in different layers are tried, as well as exchanges between replicas in the same layer.
The replica exchange method was the subject of a recent review,29 which discussed both the history of the method and its application to various physicochemical simulations. The great potential of the RE method was also recognized in a review of sampling methods for molecular simulation.30 The efficiency of replica exchange for canonical sampling of biomolecules was questioned by Zuckerman and Lyman,31,32 but they were concerned only with canonical sampling at a fixed temperature and did not consider that efficient conformational searching is also necessary for proper canonical sampling. Also, in an erratum,32 they agreed that RE is more promising than suggested in their original letter. Recently, we compared three generalized-ensemble algorithms for molecular simulations, namely, a replica exchange method (RE), a replica exchange multicanonical method (REMUCA), and a replica exchange multicanonical method with replica exchange (REMUCAREM) in both MC and MD versions, to determine the thermodynamic characteristics of the UNRES force field for efficient sampling at various temperatures.33 Of those, the REMD method, especially in its multiplexed version (MREMD), turned out to be the most efficient. Despite having been shown to be very effective on some model systems, applications of MREMD in complex systems, such as those for the simulation of protein folding, have not been tested in detail. Here, we present a comparison of canonical MD, REMD, and MREMD simulations of protein folding with the UNRES force-field.
2. Methods
UNRES Force Field
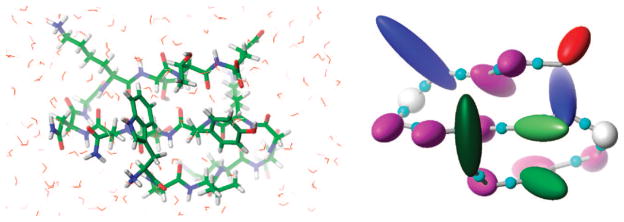
In the UNRES model,10–15 a polypeptide chain is represented by a sequence of α-carbon (Cα) atoms linked by virtual bonds with attached united side chains (SC) and united peptide groups (p). Each united peptide group is located in the middle between two consecutive α-carbons. Only these united peptide groups and the united side chains serve as interaction sites, the α-carbons serving only to define the chain geometry. Comparison of all-atom and UNRES models of polypeptide chain is shown in Figure 1.
Figure 1.
Illustration of all-atom and united-residue (UNRES) models of a polypeptide chain. In the all-atom model (left), different atom types have different colors, the polypeptide chain is shown using thick sticks, and surrounding water molecules are shown as thin sticks. The UNRES model (right) for a polypeptide chain has only the following centers of interaction: the united peptide groups represented by small cyan spheres and the united side chains represented by ellipsoids with different sizes and colors for different types of amino acids. The surrounding water is treated implicitly in the potential of mean force between these centers of interaction.
The UNRES force field has been derived as a restricted free energy (RFE) function of an all-atom polypeptide chain plus the surrounding solvent, where the all-atom energy function is averaged over the degrees of freedom that are lost when passing from the all-atom to the simplified system.12,13 The RFE is further decomposed into factors coming from interactions within and between a given number of united interaction sites.13 Expansion of the factors into generalized Kubo cumulants16 enables us to derive approximate analytical expressions for the respective terms,12,13 including the multibody or correlation terms, which are derived in other force fields from structural databases or on a heuristic basis.34
The energy of the virtual-bond chain is expressed by eq 1.
| (1) |
The term USCiSCj represents the mean free energy of the hydrophobic (hydrophilic) interactions between the side chains, which implicitly contains the contributions from the interactions of the side chain with the solvent. The term USCipj denotes the excluded-volume potential of the side-chain-peptide-group interactions. The peptide-group interaction potential is split into two parts: the Lennard-Jones interaction energy between peptide-group centers ( ) and the average electrostatic energy between peptide-group dipoles ( ); the second of these terms accounts for the tendency to form backbone hydrogen bonds between peptide groups pi and pj. The terms Utor, Utord, Ub, and Urot are the virtual-bond-dihedral angle torsional terms, virtual-bond-dihedral angle double-torsional terms, virtual-bond angle bending terms, and side-chain rotamer terms, respectively; these terms account for the local propensities of the polypeptide chain. The terms represent correlation or multibody contributions from the coupling between backbone-local and backbone-electrostatic interactions. The multibody terms are indispensable for reproduction of regular α-helical and β-sheet structures. The terms Ubond(di), where di is the length of the ith virtual bond and nbond is the number of virtual bonds, are simple harmonic potentials of virtual-bond distortion,22 and the terms USS describe the energetics of disulfide bonds.35,36 The w’s are the weights of the energy terms, and they were determined (together with the parameters within each cumulant term and the well depths of the side-chain pairwise interaction potential USCiSCj) by hierarchical optimization19 of the potential-energy function. In this work, we used the version of the UNRES force field referred to as 4P,19 which was parametrized in our earlier work19 simultaneously on the training proteins 1GAB (α), 1E0L (β), 1E0G (α+β), and 1IGD (α+β), using the conformational space annealing (CSA) method37 to generate the decoy sets. Although the 4P force field was parametrized to find the native structures of proteins as global minima of the potential energy, it performs quite well in folding proteins in molecular dynamics simulations.21 On the other hand, because the optimization procedure was focused on producing as large an energy gradient with increasing native-likeness as possible,17 the folding temperatures turned out to be unphysically high21,23 and the heat capacity curves contain multiple peaks,33 reflecting the fact that formation of small structural elements such as individual α-helices precedes packing into tertiary structure. This also means that the 4P UNRES force field produces rough energy landscapes, but such a feature is useful for performing a hard test of a conformational-search method. We note at this point that, in our recent work,38 we have reported preliminary versions of the UNRES force field parametrized for canonical simulations.
Replica-Exchange Algorithm
In the REMD method,27 M canonical MD simulations are carried out simultaneously, each one at a different temperature. Initially the temperatures increase with the sequential number of the simulation (trajectory). After every m steps, an exchange of temperatures between neighboring trajectories (j = i + 1) is attempted, the decision about the exchange being made based on the Metropolis criterion, which is expressed by eq 2
| (2) |
where βi = 1/RTi, Ti being the absolute temperature corresponding to the ith trajectory, and Xi denotes the variables of the UNRES conformation of the ith trajectory at the attempted exchange point. If Δ ≤ 0, Ti and Tj are exchanged, otherwise the exchange is performed with probability exp(−Δ).
The multiplexed variant of the RE method (MREMD) developed by Rhee and Pande28 differs from the original RE method in that several trajectories are run at a given temperature. Each set of trajectories ran at a different temperature constitutes a layer. Exchanges are attempted not only within a single layer but also between layers.
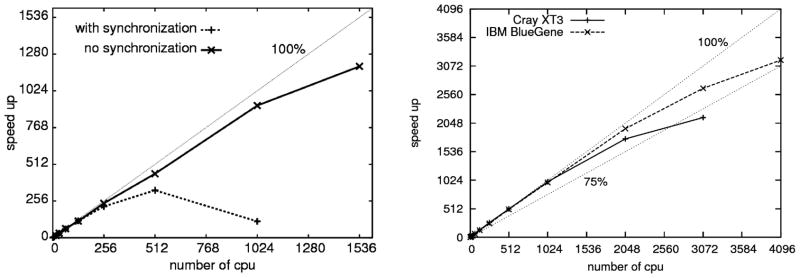
The original REMD and MREMD algorithms require synchronization every time the exchange of temperatures between trajectories is attempted. Exchange of temperatures is performed by the master task, and the algorithm requires that all replicas communicate with the master task. All replicas have to perform the same number of steps between communications exactly. Such synchronization means that the master task and all replicas have to wait for the slowest replica. This deteriorates the performance of the algorithm beyond 256 processors heavily. We eliminated synchronization by allowing exchanges every time at which the master task has performed a given number of steps rather than requiring that all tasks have reached this point. Synchronization is also eliminated in a serial replica exchange algorithm (SREM).39 SREM eliminates not only synchronization but also all communication/exchanges between replicas; each replica changes temperature not by direct exchange with neighbors but based on potential energy distributions. Recently we have implemented SREM with UNRES.40 SREM reproduces the results of REM and is more efficient in terms of wall-clock time and scales better on distributed-memory machines. Unfortunately SREM can be applied only to the temperature-independent, but not to the temperature-dependent, UNRES force field.40 Optimizing input/output operations is also important for parallel performance. UNRES MREMD and canonical MD simulations can use two modes of input/output. In the first mode, all processors read and write all files independently: input files with all parameters in the beginning of the run and several output files at defined intervals. In the second mode, only the master processor writes a text file with messages and one binary trajectory file with conformations collected from all processors. Only the second mode minimizes input/output operations and leads to high efficiency on massively parallel systems without local hard drives such as Cray XT3 or IBM BlueGene. An additional cache array on each processor is used for storage of calculated conformations before sending them to the master processor, which facilitates less synchronization between processors. The Europort Data Compression XDRF library is used for writing compressed binary trajectory files.41
WHAM
The weighted histogram analysis method (WHAM)42 was used to extract maximum information from all replicas to evaluate thermodynamic quantities at any temperature. For a replica exchange simulation with M replicas at M distinct temperatures, a set of M energy histograms Nm(E) is obtained. The densities of states [n(E)] are then obtained self-consistently from the following WHAM equations:
| (3) |
| (4) |
where Nm(E) is the histogram at temperature Tm, βm = 1/(RTm) is the inverse temperature, nm is the total number of samples in the mth replica, gm = 1 + 2τm, and τm is the integrated autocorrelation time at temperature Tm. In biomolecular systems, gm is approximately constant42 and, therefore, can be canceled in eq 3. The WHAM eqs 3 and 4 are evaluated self-consistently, and the resulting densities of states are used to evaluate the expectation value of any observable A in eq 5
| (5) |
3. Results and Discussion
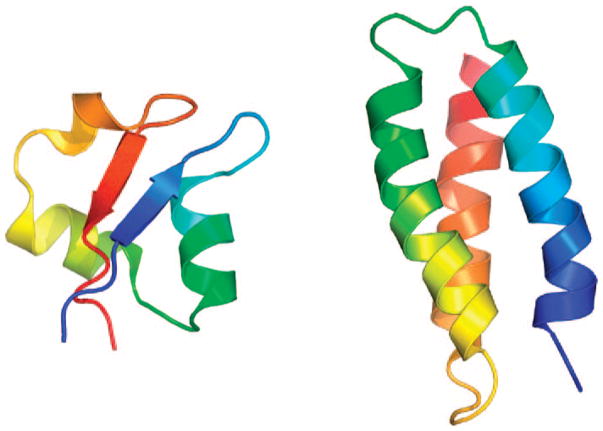
The native structures of two proteins investigated in this work: the Escherichia coli Mltd Lysm domain (an α+β protein, 48 residues, 1E0G)43 and de novo designed protein (an α protein, 67 residues, 1LQ7)44 are shown in Figure 2. The 1E0G protein was one of four proteins used simultaneously, together with three others to optimize the set of UNRES energy parameters, designated as the 4P force field,19 used in the present work.
Figure 2.
Structures of 1E0G (left) and 1LQ7 (right) proteins shown as ribbon models. Ribbons are in rainbow colors starting from blue on the N-terminus to red on the C-terminus.
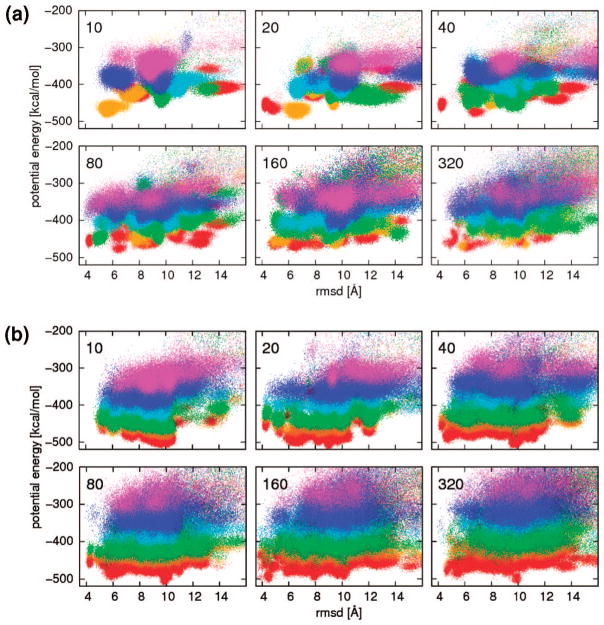
Simulation of M replicas in REMD, rather than one canonical MD trajectory, requires on the order of M times more computational effort if each trajectory is simulated for the same length as the single canonical MD trajectory. To make comparison simpler, the total length of simulations should be the same. Many shorter MD simulations appear to be more efficient and provide more insight than a single longer simulation with the same overall length of time.45,46 The main reason is nonergodicity of MD simulations, which especially for a rugged energy landscape are easily trapped in the region close to the starting conformation. Running shorter MD simulations provides a greater chance to explore different regions of conformational space than running a single long simulation. This is illustrated by the comparison of plots of energy versus rmsd from the native structure for the 1E0G protein generated using independent canonical MD simulations with different numbers of trajectories and the same total length (80 mln steps) of simulations shown in Figure 3a. Simulations at six different temperatures were used, and scatter plots for each temperature are represented by different colors of points. The upper left panel with only 10 trajectories (8 mln steps each) shows that each trajectory visited only small regions of conformational space as marked by limited changes of rmsd and energy. Canonical sampling for this set of MD simulations did not converge because simulations performed with lower temperature (300 K, red points) did not visit the lowest-energy regions; the lowest energy was achieved in simulations at intermediate temperature (350 K, orange points). It should be noted that the important region close to the native structure, with rmsd around 4 Å, is not visited at all in this set of simulations. Adding more trajectories and reducing their length to keep the total simulation-length the same improves the sampling up to certain point. The native region around 4 Å rmsd is visited by at least one trajectory for simulations with 20, 40, and 80 trajectories but not for 160 and 320 trajectories, which are too short (in the 320 case, each trajectory has only 0.25 mln steps).
Figure 3.
Plots of energy vs rmsd from the native structure for the 1E0G protein generated using (a) independent canonical MD simulations with different numbers of trajectories and (b) multiplexed-replica exchange MD simulations with different numbers of replicas. The number of trajectories (replicas) used in the simulation presented in each graph is shown in the top-left corner of each graph. The total length of the simulation is the same for all subgraphs, that is, simulation with a larger number of trajectories is proportionally shorter. Different colors from the rainbow spectrum represent different temperatures: red for 300 K, orange for 350 K, green for 400 K, cyan for 500 K, blue for 600 K, and magenta for 700 K.
The MREMD simulation is more efficient than a set of independent canonical MD simulations: for the same length and the number of replicas (trajectories), it covers a larger portion of conformational space, as illustrated on plots of energy versus rmsd in Figure 3b, in comparison with Figure 3a. This improvement is especially visible for low-energy regions: all MREMD simulations reached lower energies for low-temperature replicas in comparison with the independent MD simulations. The convergence of each canonical distribution to proper energy regions for each temperature is much better, as shown by the proper order of color on each plots: lower temperature replicas always sample lower energy regions, which was not always the case for the set of independent MD simulations. Just as running several MD trajectories is more efficient than one long MD trajectory, adding more trajectories increases the effectiveness of MREMD compared to REMD. Because the total simulation length is constant, it is not always feasible to decrease the necessary simulation time by simultaneously performing a multiple number of replicas because thermodynamically acceptable results cannot be expected within a very short simulation time for each replica. This is especially important for larger proteins and proteins containing β structures, which fold more slowly.
A set of MREMD simulations with different numbers of replicas but the same total simulation time for 1LQ7 is shown in Figure 4. The shortest MREMD simulation (0.25 million steps) with the largest number of replicas (320) did not visit low energy and low rmsd regions of conformational space at all. But an intermediate number of replicas and length of each replica’s trajectory shows that, up to a certain point, adding more replicas and reducing each of their lengths also helps in this case: the region of conformational space with rmsd around 6 Å was not visited in simulations with 10 and 20 replicas but is occupied for 40, 80, and 160 replicas.
Figure 4.
Plots of energy vs rmsd from the native structure for the 1LQ7 protein generated using multiplexed-replica exchange MD simulations with different numbers of replicas. The number of replicas is shown in top-left corner of each graph. The total length of the simulation is the same for all graphs. Different colors from the rainbow spectrum represent different temperatures: red for 300 K, orange for 350 K, green for 400 K, cyan for 500 K, blue for 600 K, and magenta for 700 K.
The observation that protein folding has a series of early conformational steps that lead to lag phases at the beginning of the folding kinetics and limit the use of very short simulation data was made by Fersht.47 His criticism was directed toward the use of very short simulations in distributed computing for calculating kinetic data, but the presence of these lag phases is important also for MREMD simulations. It can bias short simulations; therefore, MREMD with many replicas but too short simulation time for each of them can lead to a false conformational landscape and wrong thermodynamic characteristics of folding. Convergence of simulations should always be checked carefully by monitoring convergence of sensitive thermodynamical variables such as heat of capacity profiles.
To compare the efficiency of REMD and MREMD in calculations of thermodynamical characteristics of protein folding, additional simulations for 1E0G and 1LQ7 were performed using 30 temperatures spanning the range 200–1800 K (the folding temperature of the 4P force field is very high, around 1200 K, because this force field was optimized using decoys generated by a global optimization method, not by canonical sampling). The REMD simulations were performed with one replica per temperature and 300 million steps for 1E0G and 48 million steps for 1LQ7, and MREMD simulations were performed with multiplexing of eight replicas per temperature with the same length of simulation (300 million steps for 1E0G and 48 millions steps for 1LQ7). To determine the added value of multiplexing, for 1LQ7, we carried out eight additional REMD simulations independent of each other at 30 temperatures each (i.e., with the same temperatures and total number of trajectories as the multiplexed simulation of that protein); to determine the added value of replica exchange, we carried out two series of 30 and 240 independent canonical MD simulations, respectively, at the same temperatures as in REMD/MREMD simulations with 1 or 8 trajectories per temperature, respectively. Such control runs were not carried out for 1E0G because of the slow convergence of the canonical simulations. In this set of simulations, all replicas were started from extended structures. To investigate the dependence on the starting conditions, a second set of simulations, REMD (300 million steps for 1E0G and 48 millions steps for 1LQ7) and MREMD with multiplexing of 8 replicas per temperature (300 million steps for 1E0G and 48 millions steps for 1LQ7) were performed with all replicas started from native structures. Conformations collected during simulations every 2000 steps were used in WHAM to calculate temperature profiles of heat capacity and average rmsd from the native structure.
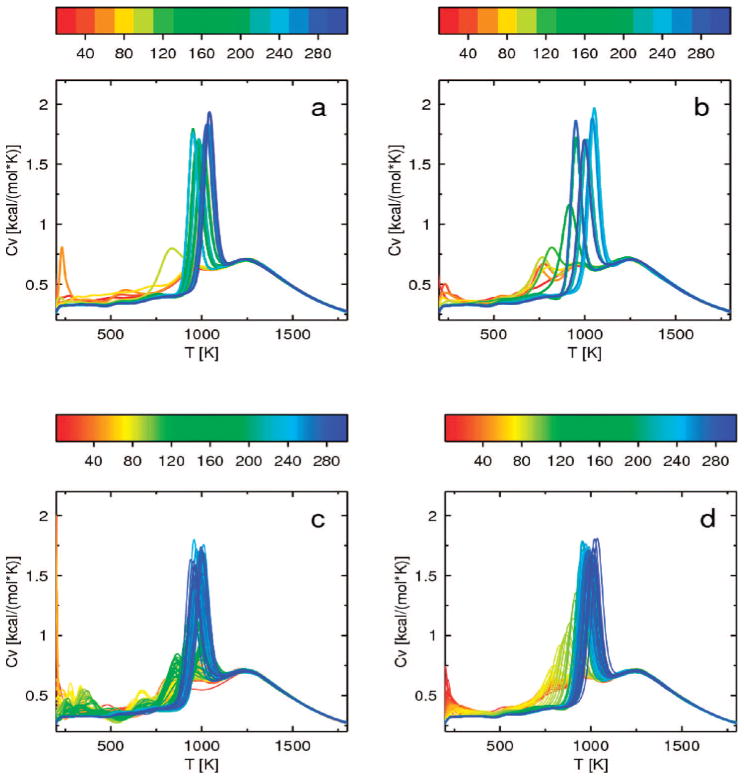
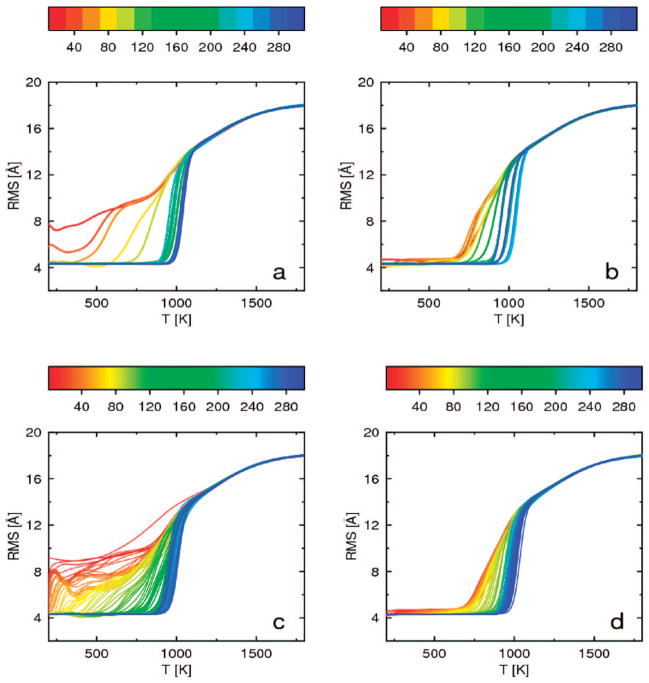
The convergence of the heat capacity curve with increased simulation length, calculated for the 1E0G protein by WHAM using consecutive windows of length 20 mln steps for REMD and 2.5 mln steps for MREMD, is shown in Figure 5 (the length of a window was chosen to select the same number of conformations from both REMD and MREMD simulations). For 1E0G, convergence is slow in all simulations, both for REMD starting from the extended structure (Figure 5a) and starting from the native structure (Figure 5b) and for MREMD starting from the extended structure (Figure 5c) and starting from the native structure (Figure 5d). The final blue curves generated from all simulations are similar: there is a small peak around 1250 K and a high narrow peak around 1050 K. The small peak at higher temperature is associated with lowering of the average rmsd for this temperature to 16 Å as shown in Figure 6, and corresponds to formation of compact structures with local structures as α-helices. This peak converges very fast and is present in its final position even on red curves generated from the very short simulations. The high narrow peak at lower temperature is associated with a fast drop of the average rmsd at this temperature to 4 Å, as shown in Figure 6, and corresponds to formation of native structure with long-range antiparallel β structure. This peak converges slowly, first appearing at lower temperatures and slowly growing and shifting to higher temperatures. For simulations started from extended structures (Figure 6a and c), the average rmsd lowers to 4 Å only after long simulation. For simulations started from the native structure (Figure 6b and d), the average rmsd is around 4 Å for low temperatures from the very beginning, but convergence of the average rmsd is also slow.
Figure 5.
Plots of heat capacity as a function of temperature for 1E0G, calculated from windows of 20 mln consecutive steps corresponding to regular REMD starting from the extended structure (a) and from the native structure (b) and from windows of 2.5 mln steps corresponding to MREMD with multiplexing of 8 replicas per temperature starting from the extended structure (c) and from the native structure (d). The curves in all panels are colored according to the duration of simulation; the color scale (in million steps) is a rainbow from red (shortest) to blue (longest) shown above each panel.
Figure 6.
Convergence of the ensemble-averaged rmsd as a function of temperature for 1E0G, calculated from windows of 20 mln consecutive steps corresponding to regular REMD starting from the extended structure (a) and from the native structure (b) and from windows of 2.5 mln steps corresponding to MREMD with multiplexing of 8 replicas per temperature starting from the extended structure (c) and from the native structure (d). The curves in all panels are colored according to the duration of simulation; the color scale (in million steps) is a rainbow from red (shortest) to blue (longest) shown above each panel.
To provide better insight into the convergence of ensemble averages, in Figure 7, we plot the standard deviation of rmsd(T) curves, σRMSDave, from the rmsd curve averaged over the last 10 windows of the MREMD simulations started from the experimental structure, which was taken as reference. The quantity σRMSDave is defined by eq 6.
Figure 7.
Plots of standard deviation of rmsd(T) curves, σRMSDave, from the rmsd curve averaged over the last 10 windows of the MREMD simulations started from the experimental structure, which was taken as reference, for 1E0G regular REMD simulation starting from the extended structure (red) and from the native structure (green); MREMD with multiplexing of 8 replicas per temperature starting from the extended structure (blue) and from the native structure (magenta)
| (6) |
where rmsdref denotes the reference rmsd and N = 2001 is the number of temperatures; T1 = 100 K, TN = 2100 K. We noted that the rmsd curves converge slower and are more sensitive to sampling scheme than the heat-capacity curves and, therefore, we used them to monitor convergence. Convergence was assumed to occur when σRMSDave dropped to 0.5 Å or below.
An analysis of the plots in Figure 7 shows that, for the 1E0G protein, MREMD simulations with multiplexing of 8 replicas per temperature do not converge 8 times faster than a single REMD simulation. The REMD simulation started from the extended structure converges in about 120 mln steps, whereas MREMD needs around 150 mln steps. The MREMD simulations started from the native structure converge faster, in about 110 mln steps, while the REMD simulation started from the native structure needs around 150 mln steps for convergence.
For 1E0G, the total computational expense necessary for convergence is smaller for REMD compared with that of MREMD simulations with multiplexing of 8 replicas per temperature. It can be noted, however, that the σRMSDave plots corresponding to MREMD simulations exhibit only small and high-frequency oscillations, as compared to those of REMD simulations which exhibit slower oscillations with larger amplitude. These oscillations are manifested in the rmsd curves (Figure 6a and b) as shifts of the region of the inflection point (about T = 1000 K) with the progress of simulations. In addition, in REMD simulations, the average σRMSDave after convergence is about 0.5 Å for the start from extended and 0.7 Å for the start from the native structutre. Conversely, in both MREMD simulations the average σRMSDave is about 0.2 Å, and the σRMSDave curves are virtually independent of each other after achieving convergence, exhibiting white noise behavior. This observation suggests that MREMD results in better averaging.
The convergence of the heat capacity curve with increased simulation length, calculated for 1LQ7 protein by WHAM, using consecutive windows of length 4 mln steps for REMD and 0.5 mln steps for MREMD, is shown in Figure 8. For 1LQ7, the convergence is fast for all simulations [i.e., (i) REMD started from the extended structure (Figure 8a) and (ii) started from the native structure (Figure 8b), (iii) MREMD started from the extended structure (Figure 8c) and (iv) started from the native structure (Figure 8d), (v) a series of 30 independent canonical MD simulations at temperatures of REMD simulations (Figure 8e), (vi) a series of 240 independent canonical MD simulations carried out at the temperatures of the MREMD simulation (8 trajectories per temperature) (Figure 8f), and (vii) a series of 8 independent REMD simulations (Figure 8g)]. The final blue curves generated from all simulations are similar with one wide peak around 1150 K. It can be noted that the heat-capacity curves obtained from canonical MD simulations (Figure 8e and f) have many secondary peaks at low temperatures, which do not occur for REMD or MREMD simulations. This feature of canonical simulations results from nonergodicity of the system studied at low temperatures.
Figure 8.
Plots of heat capacity as a function of temperature for 1LQ7, calculated from windows of 4 mln consecutive steps corresponding to regular REMD starting from the extended structure (a) and from the native structure (b), from windows of 0.5 mln steps corresponding to MREMD with multiplexing of 8 replicas per temperature starting from the extended structure (c) and from the native structure (d), from windows of 4mln steps from a series of 30 independent canonical MD simulations at temperatures of REMD simulations (e), from windows of 0.5 mln steps from a series of 240 independent canonical MD simulations carried out at the temperatures of the MREMD simulation (8 trajectories per temperature) (f), and a series of 8 independent REMD simulations (g). The curves in all panels are colored according to the duration of simulation; the color scale (in million steps) is a rainbow from red (shortest) to blue (longest) shown above each panel.
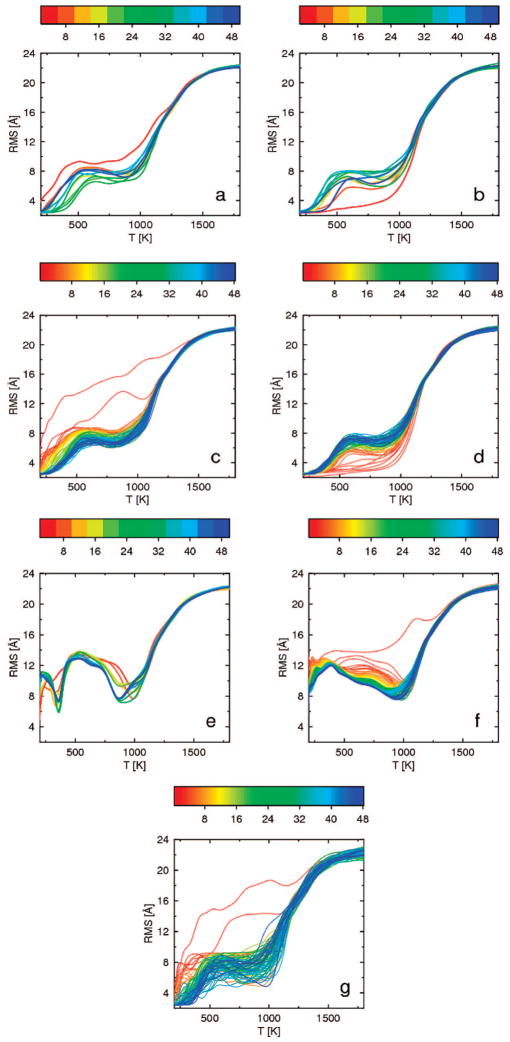
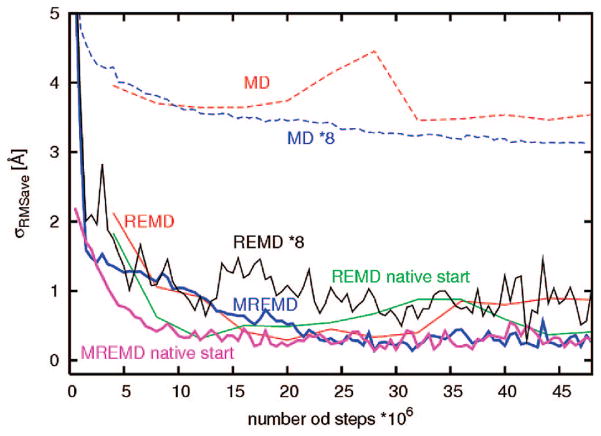
The ensemble-averaged rmsd curves for the 1LQ7 protein calculated for increasing simulation length, are shown in Figure 9 and the plots of σRMSDave are shown in Figure 10; as for 1E0G, the reference rmsd curve was calculated by averaging over 10 last windows of the MREMD simulation started from the experimental structure. For the 1LQ7 protein, UNRES generates two low-energy structures: a native-like structure with rmsd around 2 Å and a “mirror image” structure with rmsd around 9 Å. The temperature profile of the average rmsd depends on the balance of the free energies between these two minima as a function of temperature. For temperatures lower than 300 K, the native-like structures are more probable, while for temperatures between 300 and 1100 K, the “mirror image” structures with rmsd around 9 Å win. For the 1LQ7 protein, MREMD simulations with multiplexing of 8 replicas per temperature, the initial drop of σRMSDave is faster, which is best illustrated in Figure 10 by the relative shift of the REMD curve (red) with respect to the MREMD curve (blue) and of the REMD from the native start curve (green) with respect to the curve corresponding to the MREMD simulation started from the experimental structure (magenta) to the right. Both REMD and MREMD simulations, started from the extended structure, converge in about 15 mln steps. Simulations started from the native structure converge in about 10 mln steps. However, as for 1E0G, the σRMSDave curves corresponding to REMD simulations exhibit slow large-amplitude oscillations (with period of about 38 mln MD steps, which largely exceeds the time-window size which is 4 mln steps for REMD simulations) after convergence, while those corresponding to MREMD simulations exhibit white-noise behavior after convergence, which indicates better averaging in MREMD compared to REMD simulations.
Figure 9.
Convergence of the ensemble-averaged rmsd as a function of temperature for 1LQ7, calculated from windows of 4 mln consecutive steps corresponding to regular REMD starting from the extended structure (a) and from the native structure (b), from windows of 0.5 mln steps corresponding to MREMD with multiplexing of 8 replicas per temperature starting from the extended structure (c) and from the native structure (d), from windows of 4mln steps from a series of 30 independent canonical MD simulations at temperatures of REMD simulations (e), from windows of 0.5 mln steps from a series of 240 independent canonical MD simulations carried out at the temperatures of the MREMD simulation (8 trajectories per temperature) (f), and from a series of 8 independent REMD simulations (g). The curves in all panels are colored according to the duration of simulation; the color scale (in million steps) is a rainbow from red (shortest) to blue (longest) shown above each panel.
Figure 10.
Plots of standard deviation of rmsd(T) curves, σRMSDave, from the rmsd curve averaged over the last 10 windows of the MREMD simulations started from the experimental structure, which was taken as reference, for 1LQ7 regular REMD simulation starting from the extended structure (red line) and from the native structure (green line), MREMD with multiplexing of 8 replicas per temperature starting from the extended structure (blue line) and from the native structure (magenta line), and for a series of 30 independent canonical MD simulations at temperatures of REMD simulations (dashed red line), a series of 240 independent canonical MD simulations carried out at the temperatures of the MREMD simulation (8 trajectories per temperature) (dashed blue line), and a series of 8 independent REMD simulations (black line).
It can also be noted that performing 8 independent REMD simulations is not equivalent to performing a single 8-plexed REMD simulation. The heat-capacity (Figure 8g) and ensemble-averaged rmsd (Figure 9g) curves corresponding to 8 independent REMD simulations are much more diffuse than those of the 8-plexed REMD simulation (Figure 8c and 9c). This is also manifested in the σRMSDave curve (the black line in Figure 10) corresponding to 8 independent REMD simulations which has a higher average σRMSDave value (about 1 Å) after the initial drop compared to that of both MREMD simulations (about 0.2 Å), and although, at the first glance, it exhibits a random-noise hehavior in the later part, the fast random oscillations are superposed on slow large-period oscillations. It can, therefore, be concluded that the added value of multiplexing is improved averaging even compared to the equivalent number of REMD simulations.
The rmsd curves obtained in canonical MD simulations indicate that the system does not contain a dominant amount of native structure even at low temperature (Figure 9e and f). This is also manifested in the corresponding σRMSDave curves (Figure 10), which are always above those corresponding to curves calculated from REMD or MREMD simulations. This observation clearly shows that canonical MD is not suitable to derive thermodynamic properties of systems which are not ergodic at all temperatures.
The improvement of ergodicity in REMD and MREMD simulations compared to canonical MD simulations carried out at the same temperatures can also be assessed by comparing the mean first passage times (MFPTs), where MFPT is defined as the average time (averaged over all trajectories) in which the native-like structure appears for the first time. For 1LQ7, we identified the appearance of a native-like structure with rmsd drop below 5 Å. For trajectories in which no native-like structures appear, the total trajectory time contributed to the average. The MFPTs and the number of trajectories which did not reach native-like (NONF) structures are as follows for the respective simulations: (i) MFPT = 175 ns and NONF = 20 for 30 independent MD simulations compared to (ii) MFPT = 42 ns and NONF = 1 for the corresponding REMD simulation; (iii) MFPT = 173 ns and NONF = 175 for 240 independent MD simulations at 30 temperatures with 8 trajectories per temperature compared to (iv) MFPT = 47 ns and NONF = 0 and MFPT = 49 ns and NONF = 3 for the 8 independent REMD simulations and the 8-plexed REMD simulation, respectively. The total simulation length was about 235 ns. These data clearly show that replica exchange leads to at least 4 times faster convergence to the native structure (which is the most probable one at low temperatures for 1LQ7 with the 4P force field used in this work). There is no appreciable difference in MFPT between REMD, 8-plexed REMD, and 8 independent REMD simulations. We must note at this point that the computed MFPTs do not have any values for folding kinetics because they correspond to all temperatures used in our simulations; they can be considered only as the ability of the system studied to reach the native structure given a simulation protocol.
Even if the total computational expense in the above simulations is the same for REMD and MREMD, MREMD finishes the simulations faster in real time by effectively using more processors for more replicas. This is especially attractive for UNRES simulations. For all-atom explicit solvent simulations, the large number of replicas that must be used to span a designated temperature range and the subsequent long time required for conformations sampled at high temperature to exchange for potential inclusion within the low temperature regime are seen as the main difficulties that are inherent in a REMD application. The large number of replicas is not a problem for united-residue (UNRES) simulations because the number of replicas scales as the number of degrees of freedom of the system and is several orders of magnitude smaller for UNRES when compared with all-atom simulations with explicit solvent.
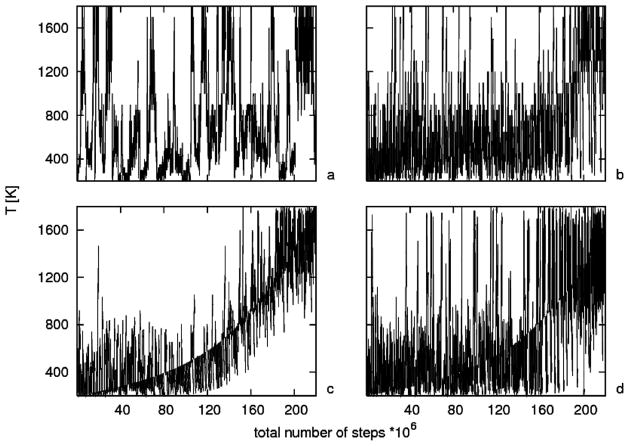
MREMD simulations are more efficient than regular REMD simulations with the same number of replicas (each with a different temperature) because very closely spaced temperature exchanges must be made much more often for REMD. This difference between REMD and MREMD is illustrated in Figure 11, showing a comparison of diffusion in temperature replica space of REMD and MREMD in terms of temperature as a function of time for all replicas. REMD with 30 temperatures (Figure 11a) and MREMD with 30 temperatures and multiplexing of 8 replicas per temperature (Figure 11b) show good walks in temperature space, whereas for REMD with 240 temperatures (Figure 11c), each replica does not change its temperature very much from the starting one, and a clear monotonical pattern is visible even at the end of the simulations. By increasing the frequency of exchange 10 times for REMD with 240 temperatures (Figure 11d), we can obtain a proper random walk in temperature space, which is essential for REMD performance. The high frequency of exchange does not allow proper equilibration between exchanges and reduces parallel performance. Therefore, it is not practical to run REMD with so many replicas. MREMD does not involve these problems and can be used effectively even with thousands of replicas.
Figure 11.
Diffusion in temperature replica space of REMD vs MREMD: combined plots of temperature as a function of time for all replicas for (a) REMD with 30 temperatures, (b) MREMD with 30 temperatures and multiplexing of 8 replicas per temperature, for a total of 240 replicas, (c) REMD with 240 temperatures, and (d) REMD with 240 temperatures and 10 times more frequent exchanges between replicas.
Parallel performance of the original REMD and MREMD code was limited by synchronization between all replicas on every exchange. As shown in Figure 12, this limitation restricts speedup for larger numbers of processors. When the restriction to perform exactly the same number of steps between exchanges for all replicas is lifted, and the exchange step is based only on the number of steps performed by the first replica, the improved algorithm scales almost linearly up to 4000 processors with over 75% speed up. In the improved algorithm, the exchanges of conformations between random replicas with neighboring temperatures are tried, not at the same number of MD steps for each replica but are forced by the replica with the lowest temperature, independent of the number of steps performed by the other replicas. With not too frequent exchanges, this algorithm allows for enough equilibration for each replica between exchanges. With processors of equal or closely spaced speed, the number of steps performed by each replica between exchanges does not vary too much, but even small variations remove waiting, which would reduce parallel performance very fast.
Figure 12.
Scalability of the UNRES MREMD code. The left panel shows speed up curves calculated for MREMD using an AphaServer supercomputer with all replicas running for the same number of steps between exchanges (dashed line) and an improved code with no synchronization and exchange based only on the number of steps performed by the first replica (solid line). The dotted line shows perfect 100% speed up. The right panel shows speed up curves calculated for MREMD with no synchronization using a Cray XT3 computer (solid line) and IBM BlueGene (dashed line) supercomputers. Two dotted lines show 75% and 100% speedup lines for reference.
4. Conclusion
Replica exchange is the method of choice for studies of the thermodynamics of protein folding. Various thermodynamical properties are available as a function of temperature through histogram reweighting techniques (WHAM). Low free-energy minima are accessible through accelerated relaxation. Intrinsic parallelism of the algorithm can be extended effectively by multiplexing. Comparison of REMD versus MREMD shows that efficient sampling requires diffusion in temperature replica space; adding more temperature replicas means that the number of swaps grows quadratically and that either longer simulations are needed or exchanges must be attempted more frequently. The MREMD method takes advantage of both the multiple temperature aspect of REMD, as well as the large number of independent simulations to enhance sampling considerably. The simulation time should be long enough so that each trajectory can cover the entire conformational space, as well as the entire temperature space. Parallelization of the MREMD method has been enhanced by removing the synchronization step. Removing the restriction to perform exactly the same number of steps between exchanges has no consequence for the validity of the results in simulations performed using processors of equal or closely spaced speed because the number of steps performed by each replica between exchanges does not vary too much. These changes in the algorithm allow much better parallel performance. The improved algorithm scales almost linearly up to 4000 processors with over 75% of ideal speed up [i.e., (4000)(0.75) = 3000 time speed up].
Acknowledgments
This work was supported by grants from the NIH (GM-14312), the NSF (MCB05-41633), and Grant 0490/B/H03/2008/35 from the Polish Ministry of Science and Higher Education. This research was conducted by using the resources of (a) our Beowulf cluster at the Baker Laboratory, Cornell University, (b) the NSF Terascale Computing System at the Pittsburgh Supercomputer Center, (c) the John von Neumann Institute for Computing at the Central Institute for Applied Mathematics, Forschungszentrum Juelich, Germany, and (d) the Informatics Center of the Metropolitan Academic Network (ICMAN) in Gdańsk.
References
- 1.Dobson CM. Nature. 2003;426(6968):884–890. doi: 10.1038/nature02261. [DOI] [PubMed] [Google Scholar]
- 2.Cecconi C, Shank EA, Bustamante C, Marqusee S. Science. 2005;309(5743):2057–2060. doi: 10.1126/science.1116702. [DOI] [PubMed] [Google Scholar]
- 3.Scheraga HA, Khalili M, Liwo A. Annu Rev Phys Chem. 2007;58:57–83. doi: 10.1146/annurev.physchem.58.032806.104614. [DOI] [PubMed] [Google Scholar]
- 4.Ueda Y, Taketomi H, Go N. Biopolymers. 1978;6:1531–1548. [Google Scholar]
- 5.Cieplak M, Hoang TX, Robbins MO. Protein Struct Funct Genet. 2002;1:104–113. doi: 10.1002/prot.10188. [DOI] [PubMed] [Google Scholar]
- 6.Brown S, Fawzi NJ, Head-Gordon T. Proc Natl Acad Sci U S A. 2003;19:10712–10717. doi: 10.1073/pnas.1931882100. [DOI] [PMC free article] [PubMed] [Google Scholar]
- 7.Brown S, Head-Gordon T. Protein Sci. 2004;4:958–970. doi: 10.1110/ps.03316004. [DOI] [PMC free article] [PubMed] [Google Scholar]
- 8.Thirumalai D, Klimov DK. Curr Opin Struct Biol. 1999;2:197–207. doi: 10.1016/S0959-440X(99)80028-1. [DOI] [PubMed] [Google Scholar]
- 9.Ming DM, Bruschweiler R. Biophys J. 2006;10:3382–3388. doi: 10.1529/biophysj.105.071902. [DOI] [PMC free article] [PubMed] [Google Scholar]
- 10.Liwo A, Oldziej S, Pincus MR, Wawak RJ, Rackovsky S, Scheraga HA. J Comput Chem. 1997;7:849–873. [Google Scholar]
- 11.Liwo A, Pincus MR, Wawak RJ, Rackovsky S, Oldziej S, Scheraga HA. J Comput Chem. 1997;7:874–887. [Google Scholar]
- 12.Liwo A, Kazmierkiewicz R, Czaplewski C, Groth M, Oldziej S, Wawak RJ, Rackovsky S, Pincus MR, Scheraga HA. J Comput Chem. 1998;3:259–276. [Google Scholar]
- 13.Liwo A, Czaplewski C, Pillardy J, Scheraga HA. J Chem Phys. 2001;5:2323–2347. [Google Scholar]
- 14.Liwo A, Oldziej S, Czaplewski C, Kozlowska U, Scheraga HA. J Phys Chem B. 2004;27:9421–9438. [Google Scholar]
- 15.Oldziej S, Kozlowska U, Liwo A, Scheraga HA. J Phys Chem A. 2003;40:8035–8046. [Google Scholar]
- 16.Kubo R. J Phys Soc Jpn. 1962;17:1100–1120. [Google Scholar]
- 17.Liwo A, Arlukowicz P, Czaplewski C, Oldziej S, Pillardy J, Scheraga HA. Proc Natl Acad Sci U S A. 2002;4:1937–1942. doi: 10.1073/pnas.032675399. [DOI] [PMC free article] [PubMed] [Google Scholar]
- 18.Oldziej S, Liwo A, Czaplewski C, Pillardy J, Scheraga HA. J Phys Chem B. 2004;43:16934–16949. [Google Scholar]
- 19.Oldziej S, Lagiewka J, Liwo A, Czaplewski C, Chinchio M, Nanias M, Scheraga HA. J Phys Chem B. 2004;43:16950–16959. [Google Scholar]
- 20.Oldziej S, Czaplewski C, Liwo A, Chinchio M, Nanias M, Vila JA, Khalili M, Arnautova YA, Jagielska A, Makowski M, Schafroth HD, Kazmierkiewicz R, Ripoll DR, Pillardy J, Saunders JA, Kang YK, Gibson KD, Scheraga HA. Proc Natl Acad Sci U S A. 2005;21:7547–7552. doi: 10.1073/pnas.0502655102. [DOI] [PMC free article] [PubMed] [Google Scholar]
- 21.Liwo A, Khalili M, Scheraga HA. Proc Natl Acad Sci U S A. 2005;7:2362–2367. doi: 10.1073/pnas.0408885102. [DOI] [PMC free article] [PubMed] [Google Scholar]
- 22.Khalili M, Liwo A, Rakowski F, Grochowski P, Scheraga HA. J Phys Chem B. 2005;28:13785–13797. doi: 10.1021/jp058008o. [DOI] [PMC free article] [PubMed] [Google Scholar]
- 23.Khalili M, Liwo A, Jagielska A, Scheraga HA. J Phys Chem B. 2005;28:13798–13810. doi: 10.1021/jp058007w. [DOI] [PMC free article] [PubMed] [Google Scholar]
- 24.Khalili M, Liwo A, Scheraga HA. J Mol Biol. 2006;3:536–547. doi: 10.1016/j.jmb.2005.10.056. [DOI] [PubMed] [Google Scholar]
- 25.Hukushima K, Nemoto K. J Phys Soc Jpn. 1996;6:1604–1608. [Google Scholar]
- 26.Hansmann UHE. Chem Phys Lett. 1997;1–3:140–150. [Google Scholar]
- 27.Sugita Y, Okamoto Y. Chem Phys Lett. 1999;1–2:141–151. [Google Scholar]
- 28.Rhee YM, Pande VS. Biophys J. 2003;2:775–786. doi: 10.1016/S0006-3495(03)74897-8. [DOI] [PMC free article] [PubMed] [Google Scholar]
- 29.Earl DJ, Deem MW. Phys Chem Chem Phys. 2005;23:3910–3916. doi: 10.1039/b509983h. [DOI] [PubMed] [Google Scholar]
- 30.Lei HX, Duan Y. Curr Opin Struct Biol. 2007;2:187–191. doi: 10.1016/j.sbi.2007.03.003. [DOI] [PubMed] [Google Scholar]
- 31.Zuckerman DM, Lyman E. J Chem Theor Comput. 2006;2:1200–1202. doi: 10.1021/ct600297q. [DOI] [PubMed] [Google Scholar]
- 32.Zuckerman DM, Lyman E. J Chem Theor Comput. 2006;2:1693–1693. doi: 10.1021/ct600297q. [DOI] [PubMed] [Google Scholar]
- 33.Nanias M, Czaplewski C, Scheraga HA. J Chem Theor Comput. 2006;3:513–528. doi: 10.1021/ct050253o. [DOI] [PMC free article] [PubMed] [Google Scholar]
- 34.Kolinski A, Skolnick J. J Chem Phys. 1992;12:9412–9426. [Google Scholar]
- 35.Czaplewski C, Oldziej S, Liwo A, Scheraga HA. Protein Eng, Des Sel. 2004;1:29–36. doi: 10.1093/protein/gzh003. [DOI] [PubMed] [Google Scholar]
- 36.Chinchio M, Czaplewski C, Liwo A, Oldziej S, Scheraga HA. J Chem Theor Comput. 2007;4:1236–1248. doi: 10.1021/ct7000842. [DOI] [PubMed] [Google Scholar]
- 37.Lee J, Scheraga HA, Rackovsky S. J Comput Chem. 1997;9:1222–1232. [Google Scholar]
- 38.Liwo A, Khalili M, Czaplewski C, Kalinowski S, Oldziej S, Wachucik K, Scheraga HA. J Phys Chem B. 2007;1:260–285. doi: 10.1021/jp065380a. [DOI] [PMC free article] [PubMed] [Google Scholar]
- 39.Hagen M, Kim B, Liu P, Friesner RA, Berne BJ. J Phys Chem B. 2007;6:1416–1423. doi: 10.1021/jp064479e. [DOI] [PMC free article] [PubMed] [Google Scholar]
- 40.Shen H, Czaplewski C, Liwo A, Scheraga HA. J Chem Theory Comput. 2008;8:1386–1400. doi: 10.1021/ct800063d. [DOI] [PMC free article] [PubMed] [Google Scholar]
- 41.Green D, Meacham K, Hoesel Fv. Parallelisation of the Molecular Dynamics Code GROMOS87 for Distributed Memory Parallel Architectures. HPCN Europe 1995 Proceedings of the International Conference and Exhibition on High-Performance Computing and Networking; London: Springer-Verlag; 1995. pp. 875–879. [Google Scholar]
- 42.Kumar S, Bouzida D, Swendsen RH, Kollman PA, Rosenberg JM. J Comput Chem. 1992;8:1011–1021. [Google Scholar]
- 43.Bateman A, Bycroft M. J Mol Biol. 2000;4:1113–1119. doi: 10.1006/jmbi.2000.3778. [DOI] [PubMed] [Google Scholar]
- 44.Dai QH, Tommos C, Fuentes EJ, Blomberg MRA, Dutton PL, Wand AJ. J Am Chem Soc. 2002;37:10952–10953. doi: 10.1021/ja0264201. [DOI] [PubMed] [Google Scholar]
- 45.Daggett V. Curr Opin Struct Biol. 2000;2:160–164. doi: 10.1016/s0959-440x(00)00062-2. [DOI] [PubMed] [Google Scholar]
- 46.Day R, Daggett V. Proc Natl Acad Sci U S A. 2005;38:13445–13450. doi: 10.1073/pnas.0501773102. [DOI] [PMC free article] [PubMed] [Google Scholar]
- 47.Fersht AR. Proc Natl Acad Sci U S A. 2002;22:14122–14125. doi: 10.1073/pnas.182542699. [DOI] [PMC free article] [PubMed] [Google Scholar]


