

Summary
Pancreatic β cells, organized in the islets of Langerhans, sense glucose and secrete appropriate amounts of insulin. We have studied the roles of LKB1, a conserved kinase implicated in the control of cell polarity and energy metabolism, in adult β cells. LKB1-deficient β cells show a dramatic increase in insulin secretion in vivo. Histologically, LKB1-deficient β cells have striking alterations in the localization of the nucleus and cilia relative to blood vessels, suggesting a shift from hepatocyte-like to columnar polarity. Additionally, LKB1 deficiency causes a 65% increase in β cell volume. We show that distinct targets of LKB1 mediate these effects. LKB1 controls β cell size, but not polarity, via the mTOR pathway. Conversely, the precise position of the β cell nucleus, but not cell size, is controlled by the LKB1 target Par1b. Insulin secretion and content are restricted by LKB1, at least in part, via AMPK. These results expose a molecular mechanism, orchestrated by LKB1, for the coordinated maintenance of β cell size, form, and function.
Introduction
On a first approximation, a pancreatic β cell can be described as a simple device performing two functions: continuous sensing of blood glucose levels and appropriate secretion of insulin, which facilitates glucose uptake in peripheral tissues. Although the molecular machinery responsible for these functions is relatively well understood (Muoio and Newgard, 2008), the significance of many characteristic features that might impinge on the quality of β cell function is far less clear. For example, little is known about the determinants of size and form in individual β cells and their organization in the islets of Langerhans. Previous studies have documented that β cells are typically organized as rosettes around islet capillaries (Bonner-Weir, 1988), but how this polarized structure is achieved and maintained and for what purpose remains poorly understood. Several recent advances show the type of insights that can be gained from the study of islet and β cell morphology at the molecular level. Of particular interest is the discovery that islet capillaries, in addition to serving as carriers of oxygen and nutrients, enhance insulin secretion and β cell survival by the provision of extracellular matrix (Nikolova et al., 2006; Zaret, 2006). A better understanding of β cell and islet morphology may also affect the design of cellular therapies for diabetes. For example, approaches for directed differentiation of embryonic stem cells into β cells could benefit from taking into consideration other aspects of β cell biology besides glucose-stimulated insulin secretion. Here, we uncover a molecular pathway that controls multiple aspects of β cell morphology and function, and define LKB1 as a central component of this pathway.
LKB1 encodes a serine-threonine kinase conserved from worm to man, which is implicated as a central regulator of cell polarity and energy metabolism in a variety of systems (Alessi et al., 2006). Although the Caenorhabditis elegans homolog of LKB1 (Par4) participates in early asymmetric cell divisions of the embryo, mammalian LKB1 is essential for establishing neuronal polarity and the growth of axons (Barnes et al., 2007; Shelly et al., 2007), as well as the generation of polarity in intestinal epithelial cells (Baas et al., 2004) and pancreatic acinar cells (Hezel et al., 2008). In addition, LKB1 is intimately involved in the process by which cells sense their energy level (Shaw et al., 2004b; Woods et al., 2003). These functions of LKB1 are thought to be achieved by the direct phosphorylation of AMP-activated protein kinase (AMPK) family of proteins, consisting of 14 members. Of these kinases, SadA-B, Mark1-4, and AMPK modulate the cytoskeleton, whereas AMPK also serves to alter energy metabolism in response to fluctuations in cellular AMP:ATP ratio. How exactly LKB1 integrates extracellular inputs with intracellular energy charge to control cell polarity is only partly understood. LKB1 is also an important tumor suppressor gene (Bardeesy et al., 2002; Ji et al., 2007; Shackelford and Shaw, 2009). The molecular links between LKB1 and cancer have not been well defined and may be associated with altered cell polarity, defective energy sensing, or other processes. An interesting link between LKB1 and diabetes was uncovered recently, with the demonstration that liver LKB1 is essential for the beneficial effects of the AMPK activator and antidiabetes drug metformin (Shaw et al., 2005). However, the function of LKB1 in pancreatic β cells has not been examined previously.
By deleting LKB1 in adult β cells in vivo, we show that LKB1 restricts insulin content, insulin secretion, and β cell size and regulates aspects of β cell polarity. These processes are controlled via distinct signaling pathways acting downstream of LKB1. The data provide a first outline of how the maintenance of β cell size, form, and function is coordinated at the molecular level.
Results
Expression and Deletion of LKB1 in Adult Islets of Langerhans
We first characterized LKB1 expression in the adult pancreas. As shown in Figure 1A, LKB1 is specifically expressed in islets. Costaining with insulin revealed that LKB1 is present in the cytoplasm of β cells as well as in other hormone-producing cells of islets. LKB1 was only weakly expressed in the adult exocrine pancreas (data not shown).
Figure 1. Expression and Deletion of LKB1 in Adult Islets.
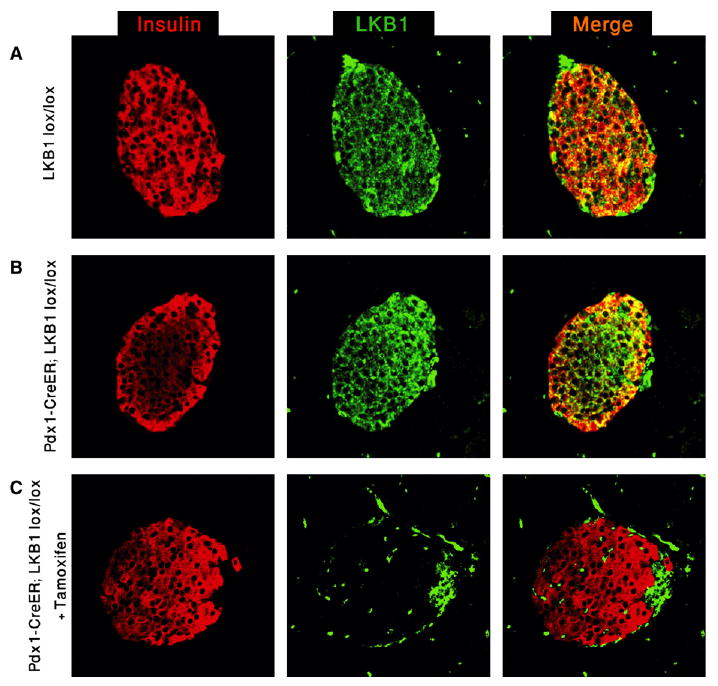
(A) Immunofluorescence analysis of LKB1 expression in the adult pancreas. All islet cells express LKB1.
(B) Normal expression of LKB1 in adult pdx1-CreER™; LKB1lox/lox (PLKB) islets in the absence of tamoxifen.
(C) Complete elimination of LKB1 immunoreactivity in β cells 7 days following tamoxifen injection to 2-month-old mice. Remaining LKB1+ islet cells are insulin−, probably representing alpha and PP cells that do not express pdx1 and therefore do not undergo recombination. All panels, original magnification 400×.
To delete LKB1 in adult islets, we generated pdx1-CreER™; LKB1lox/lox mice. In the absence of tamoxifen, these mice were indistinguishable from wild-type mice, and LKB1 expression appeared normal (Figure 1B). Injection of tamoxifen (2 doses of 8 mg) resulted in a rapid and efficient deletion of LKB1, evidenced by the loss of LKB1 immunoreactivity from β cells within 7 days (Figure 1C). LKB1 expression persisted in insulin-negative non–β cells at the periphery of islets, reflecting the lack of Pdx1 expression and, hence, Cre-mediated recombination in alpha and pancreatic polypeptide (PP) cells.
LKB1 Restricts Glucose-Stimulated Insulin Secretion In Vivo
Pdx1-CreER™; LKB1lox/lox mice (PLKB mice) had normal fed and fasting blood glucose levels (Figure 2A). However, a closer examination revealed abnormal glucose tolerance; PLKB mice responded to a glucose challenge faster and more efficiently than did wild-type littermates, as early as 1 week after tamoxifen injection (Figure 2A and data not shown). Such a behavior can be explained by either enhanced peripheral sensitivity to insulin or increased glucose-stimulated insulin secretion. Insulin tolerance tests showed normal insulin sensitivity in PLKB mice (Figure 2B). In contrast, following glucose injection, we found higher levels of insulin in the serum of PLKB mice (Figure 2C). These results suggest that, in the absence of LKB1, β cells mount an exaggerated insulin secretion response to glucose.
Figure 2. Effect of LKB1 Deficiency on Glucose Physiology.
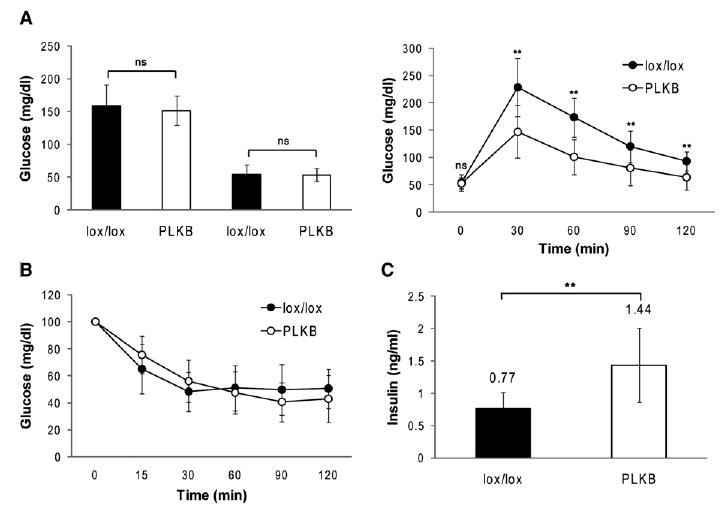
(A) Fed and fasting blood glucose levels (left) and glucose tolerance (right) in LKB1lox/lox and PLKB mice (n = 11 mice per genotype). Mice were injected with tamoxifen at 4 weeks of age, and assays were performed 1 week later.
(B) Insulin sensitivity in LKB1lox/lox and PLKB mice (n = 9 mice per genotype). Same mice were used as in (A).
(C) Serum insulin levels 15 min after the injection of glucose to LKB1lox/lox and PLKB mice (n = 7 mice per genotype). Mice were injected with tamoxifen at 4 weeks of age, and assay was performed 1 month later. Error bars represent standard deviations. **p < 0.01.
Deletion of LKB1 in Adult Islets Increases β Cell Size and Alters Polarity
Histological analysis of tamoxifen-treated PLKB mice revealed that mutant β cells were larger than wild-type cells, as early as 1 week after tamoxifen injection. β cell area, defined as the area surrounded by E-Cadherin immunoreactivity, increased by ∼40%, which can be extrapolated to a 65% increase in cell volume (Figure 3A). In addition, we noticed a striking clustering of β cell nuclei in mutant islets, which occurred a few days after deletion of LKB1. Staining for Laminin, an extracellular protein expressed by islet capillaries (Nikolova et al., 2006), confirmed previous observations that β cells are organized as rosettes around blood vessels (Bonner-Weir, 1988). We found that, in wild-type mice, the β cell nucleus is normally located away from the center of the rosette, in approximately 70% of the distance toward the periphery of the rosette (Figure 3B). In contrast, β cells of PLKB mice, although retaining a rosette organization, had their nuclei tightly packed around capillaries. Thus, the presence of LKB1 in β cells is important for appropriate nuclear positioning within the cell, relative to the blood vessel. Given this alteration of cell polarity, we examined the position of primary cilia, another hallmark of cell polarity. Previous studies using immunostaining for acetylated alpha tubulin showed that β cells contain one cilium per cell (Cano et al., 2004). We found that, in wild-type mice, cilia are homogenously distributed in islets and are mostly located in the lateral surfaces of β cells. In PLKB islets, similar numbers of cilia were present (one cilium per β cell) but with a striking change in organization. Cilia in PLKB islets tend to cluster in locations away from the nuclei and away from capillaries at the center of rosettes (Figure 3C and Figure S1 available online). Finally, we examined the cellular distribution of the glucose transporter Glut2, reported previously to be located preferentially in lateral membranes of β cells rich in microvilli (Orci et al., 1989). The intensity of Glut2 immunostaining was reduced in some faces of β cells, consistent with an alteration of β cell polarity (Figure S2).
Figure 3. LKB1 Deficiency Affects β Cell Size and Polarity.
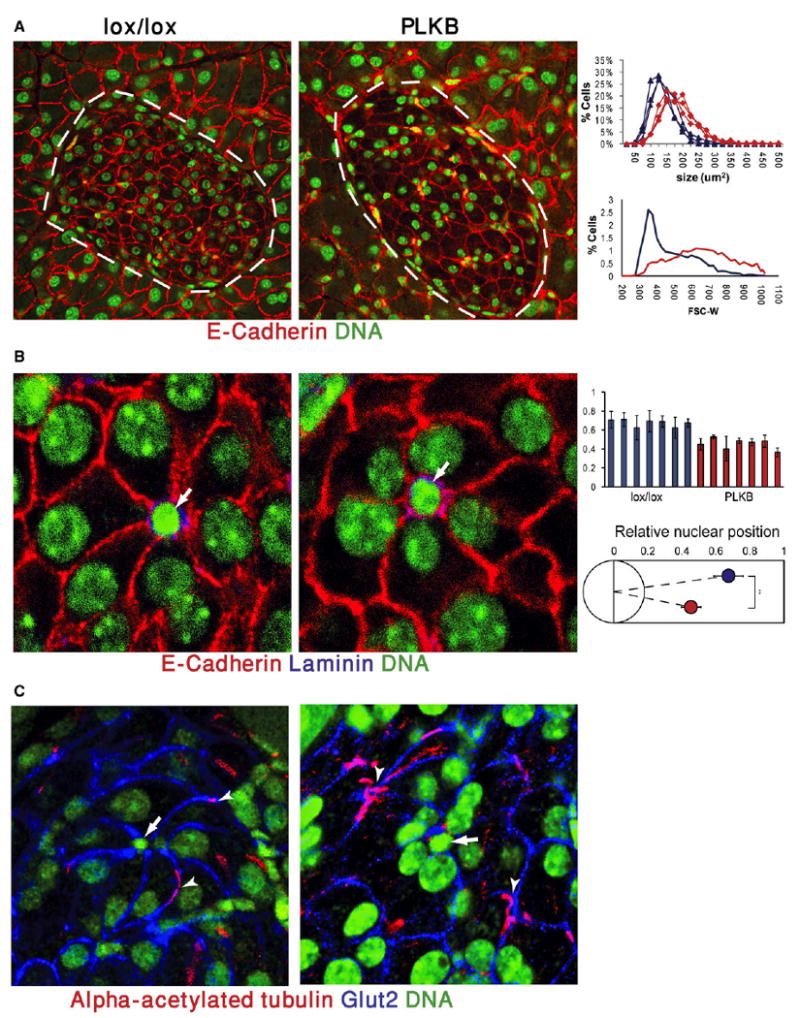
(A) Increased β cell size in LKB1-deficient mice, 3 months after the administration of tamoxifen to 6-week-old mice. Red, E-Cadherin; green, nuclei. Note also the abnormal clustering of nuclei around capillaries (yellow, autofluorescence of red blood cells). Islets are marked with dashed lines. Original magnification, 600×. Right, quantification of cell size. Top panel, distribution of islet cell sizes calculated from E-Cadherin immunostaining on paraffin sections. Each curve represents one mouse. All 6 mice depicted were littermates. Lower panel, FACS plot of dissociated islets from LKB1lox/lox and PLKB mice. Blue, LKB1lox/lox; red, PLKB. Right shift of mutant cells in both assays represents an increase in average cell size. PLKB = Pdx1-CreER; LKB1 lox/lox.
(B) Altered position of the β cell nucleus versus islet capillaries in PLKB mice. In both strains, β cells are organized as rosettes around capillaries (white arrows). In PLKB β cells, nuclei shift toward the center of rosettes. Red, E-Cadherin; blue, Laminin; green, nuclei. Right panels, quantification of distance of β cell nuclei from the center of rosettes (0 = center of rosette, 1 = farthest β cell membrane). Top, each bar represents nuclei from an individual rosette. Bottom, a graphic summary of data from 7 rosettes taken from 2 mice of each genotype. Blue, LKB1lox/lox; red, PLKB. p < 0.01. Analysis was performed on same mice as in (A).
(C) Altered distribution of monocilia in PLKB islets. In LKB1lox/lox islets, cilia are evenly spread and are usually located on lateral surfaces. In PLKB islets, cilia (arrowheads) are clustered in positions distant from the center of rosettes (arrows). Red, acetylated alpha tubulin; blue, Glut2; green, nuclei. Original magnification, 600×. Analysis was performed on same mice as in (A). Error bars denote standard deviations.
These results show that LKB1 acts to restrict the size of β cells and is important for the generation and maintenance of normal polarity of β cells. Moreover, the precise position of nucleus and monocilia is a previously unappreciated component of β cell polarity.
LKB1 Regulates β Cell Size via mTOR Pathway
LKB1 is a master kinase, controlling the phosphorylation of 14 downstream kinases of the AMPK family. We postulated that distinct targets of LKB1 mediate its effects. Using a combination of Western blot analysis and a survey of microarray expression data, we found that most LKB1 targets (at least 11 of 14) are expressed in β cells (Figure S3). We divided these direct targets to three groups: kinases that were previously implicated in the control of epithelial cell polarity (Mark1, Mark2, Mark3, and SadB), a kinase previously implicated in the sensing of cellular energy charge and the control of the cytoskeleton (AMPK alpha1), and other kinases with less-defined functions (NUAK1, NUAK2, MELK, QIK, SIK, and QSK).
Of the LKB1 targets, AMPK stands out as a potential mediator of β cell size because it is a negative regulator of mTOR signaling, the major signal transduction pathway controlling cell size (Bernal-Mizrachi et al., 2001; Corradetti et al., 2004; Shaw et al., 2004a; Tuttle et al., 2001). We therefore examined the phosphorylation status and activity of AMPK in LKB1 null cells. As shown in Figure 4A, AMPK phosphorylation (but not total levels of AMPK) was significantly reduced in PLKB islets. In addition, the levels of phoshorylated Acetyl-CoA Carboxylase (pACC), a direct substrate and hence a marker of AMPK activity, were dramatically reduced in PLKB islets. These results also indicate that LKB1 has significant kinase activity in wild-type islets in the fed condition, consistent with a role in the maintenance of β cell size, form, and function. As an independent test of this notion, we stained histological sections of pancreata for phosphorylated AMPK. Because AMPK is known to be phosphorylated and activated by LKB1 under energy stress (high AMP:ATP ratio) (Hawley et al., 2003; Shaw et al., 2004b; Woods et al., 2003), we compared mice sacrificed in fed and fasting states. Phosphorylated AMPK can be detected in Islets from fed mice, and, as expected, islets from fasted mice showed a dramatic increase in the level of their p-AMPK (Figure S4). Importantly, islets from PLKB mice had absolutely no p-AMPK signal. Analysis of mosaic islets containing adjacent wild-type and mutant β cells also showed that AMPK is phosphorylated in wild-type, but not in LKB1-deficient, cells in nonfasting, normoglycemic mice. Thus, AMPK is active to some degree and may serve physiological functions in β cells in vivo even in the fed state. Such functions are likely to be impaired in PLKB mice. We further tested whether the mTOR pathway was activated in PLKB islets, as would be expected if AMPK is inactive (Shaw et al., 2004a). As shown in Figure 4A, ribosomal protein S6 (rpS6) and p70S6K were hyperphosphorylated in PLKB islets, indicating that mTOR pathway was activated. Similarly, immunofluorescence analysis showed a dramatic increase of phosphorylated rpS6 in islets of PLKB mice, compared with controls (Figure S5). These results are consistent with the idea that, in PLKB mice, β cell size increases because AMPK inactivation leads to activation of the mTOR pathway. A prediction of this model is that inhibition of mTOR signaling would reduce the size of PLKB β cells to a wild-type level. Mice were treated for 2 weeks with the mTOR inhibitor rapamycin, at low doses used clinically in human patients undergoing immune suppression (Nir et al., 2007). Phosphorylation of rpS6 was eliminated in both wild-type and PLKB islets, confirming efficient inhibition of mTOR (Figure S5). Histological analysis revealed that, in wild-type mice, this treatment led to a mild 10% decrease in β cell size (Figure 4B). Strikingly, a much stronger effect was observed in PLKB β cells, such that rapamycin-treated β cells in wild-type and mutant mice had the same size. This result supports the idea that LKB1 restricts β cell size via its effect on mTOR signaling. To further examine this hypothesis, we determined β cell size in various mouse mutants carrying alterations in PI3K-mTOR signaling. As previously reported, mice expressing a constitutively active version of AKT from the rat insulin promoter (RIP-AKT) (Tuttle et al., 2001) had remarkably larger β cells (Figure 4C). Likewise, mice carrying a β cell-specific deletion of the PTEN tumor suppressor (βPTEN) (Stiles et al., 2006) also had larger β cells (Figure 4C). As described before, mice bearing a mutated version of ribosomal protein S6 preventing its phosphorylation (rpS6 knockin, rpS6KI/KI) had smaller β cells (Figure 4C) (Ruvinsky et al., 2005), indicating that the effect of mTOR pathway on β cell size is mediated, at least partially, by rpS6 phosphorylation. We also tested whether knockdown of AMPK affects β cell size similarly to the phenotype of LKB1 deficiency. Min6 cells (a murine β cell line) were infected with a lentivirus encoding a dominant negative mutant of AMPK alpha1 (D157A) and EGFP, or with a virus encoding dsRED and EGFP. This mutant AMPK does not have kinase activity, but competes with native AMPKα for binding to the β and γ subunits of AMPK (da Silva Xavier et al., 2003; Richards et al., 2005; Woods et al., 2000). Cells overexpressing the dominant negative mutant had reduced phosphorylation of the AMPK target ACC (Figure 4D). Flow cytometry analysis showed that cells expressing dominant negative AMPK were larger (Figure 4D). Finally, we examined the size of β cells in mice deficient for Par1b/Mark2/Emk, another direct LKB1 target (see below). Par1b-deficient β cells had normal size, indicating that this gene does not affect cell size (Figure 4C). mTOR activity in Par1b−/− islets was normal, as assessed by immunostaining against phosphorylated rpS6 (Figure S6). Taken together, these results suggest that, in normal β cells, LKB1 phosphorylates AMPK, which, by restricting the mTOR pathway, acts to reduce cell size. As shown below, this pathway affects specifically β cell size but not polarity.
Figure 4. Control of β Cell Size via mTOR Pathway.
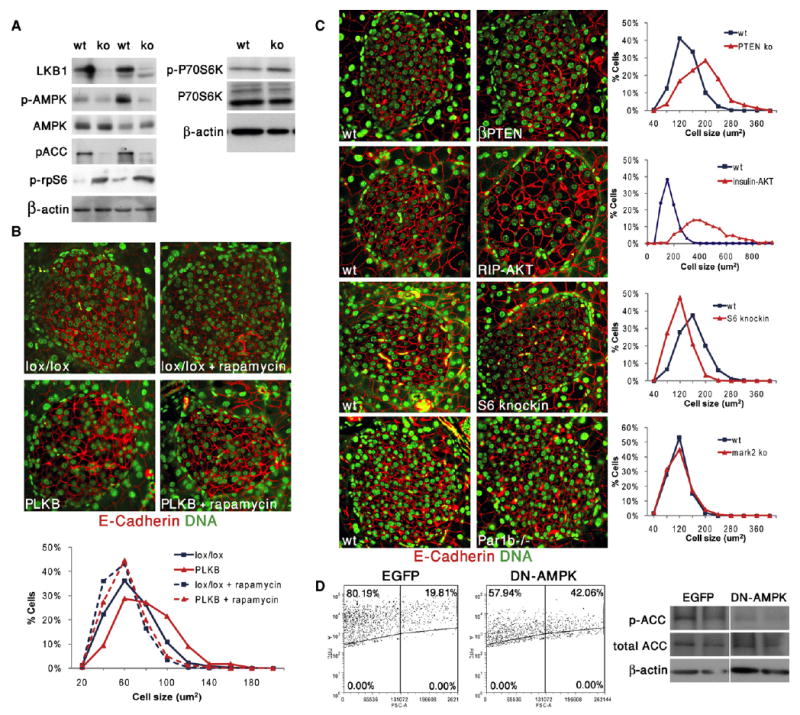
(A) Increased activity of mTOR pathway in islets isolated from PLKB mice. Western blots show decreased LKB1, decreased phosphorylation of AMPK and its target ACC, and increased phosphorylation of rpS6 and P70S6K.
(B) Low dose of rapamycin for 2 weeks reduces β cell size and eliminates the difference between LKB1lox/lox and PLKB β cells. Mice were injected with tamoxifen at 5 weeks of age and sacrificed 3 weeks later (n = 2–3 mice per group).
(C) Genetic alterations in PI3K signaling pathway, but not Par1b deficiency, affect β cell size. For each mutant or transgenic, a coprocessed littermate is shown on the left. In (B) and (C), red is E-cadherin, and green is nuclei. Cell size was calculated from the circumference of individual cells. In the graphs, blue is wild-type, and red is transgenic or mutant. Original magnification in (B) and (C), 600×.
(D) Left, infection of Min6 cells with a lentivirus containing a dominant negative (DN) AMPK construct results in increased cell size, compared with cells infected with an EGFP-containing virus alone, 3 days after infection. Forward-scatter FACS plot of infected (EGFP+) and uninfected cells. Right, decreased phosphorylation of ACC in Min6 cells overexpressing DN AMPK. Metformin was added in the last 12 hr to maximize ACC phosphorylation.
Regulation of β Cell Polarity by the LKB1 Target Par1b
We wished to identify the downstream effectors of LKB1 in regulating β cell polarity. We first examined whether activation of mTOR pathway could account for the polarity defects observed in PLKB mice. β cells of rapamycin-treated PLKB mice, although reduced in size, retained an abnormal nuclear position (Figure 5A). Similarly, β cells deficient for PTEN, β cells in RIP-AKT mice, and β cells expressing mutant rpS6 showed normal positioning of the nucleus relative to blood vessels at the center of rosettes (Figure 5A). These results suggest that pathways other than mTOR mediate the effect of LKB1 on β cell polarity. We then examined the morphology of the pancreas in mice lacking Par1b, an LKB1 target implicated in the generation of polarity in neurons and hepatocytes (Chen et al., 2006; Cohen et al., 2004). As described above, Par1b−/− islets showed a normal pattern of phosphorylated rpS6, indicating normal mTOR signaling (Figure S6). Strikingly, islets in Par1b−/− mice had abnormal clusters of nuclei, unlike the even distribution in wild-type islets (Figure 5B, bottom). Staining for blood vessels and β cell nuclei in these mice showed nuclear clustering close to islet capillaries, partially phenocopying PLKB islets (Figure 5B, top). The distribution of monocilia in Par1b mutants showed an intermediate phenotype between wild-type and PLKB mice (data not shown). In support of a direct link between LKB1 and Par1b in β cells, the phosphorylation of Mark proteins was reduced in PLKB islets (Figure 5C). These results provide genetic evidence that LKB1 controls the polarity, but not the size, of β cells via Par1b. The milder phenotype of Par1b−/− islets, compared with PLKB islets, suggests that additional LKB1 targets are contributing to the generation and maintenance of β cell polarity. LKB1 targets expressed in β cells and associated with cell polarity such as Mark1, Mark3, SAD-B, and AMPK are likely to participate in this process.
Figure 5. β Cell Polarity Is Altered in Par1b-Deficient Mice, but Not in PI3K Pathway Mutants.
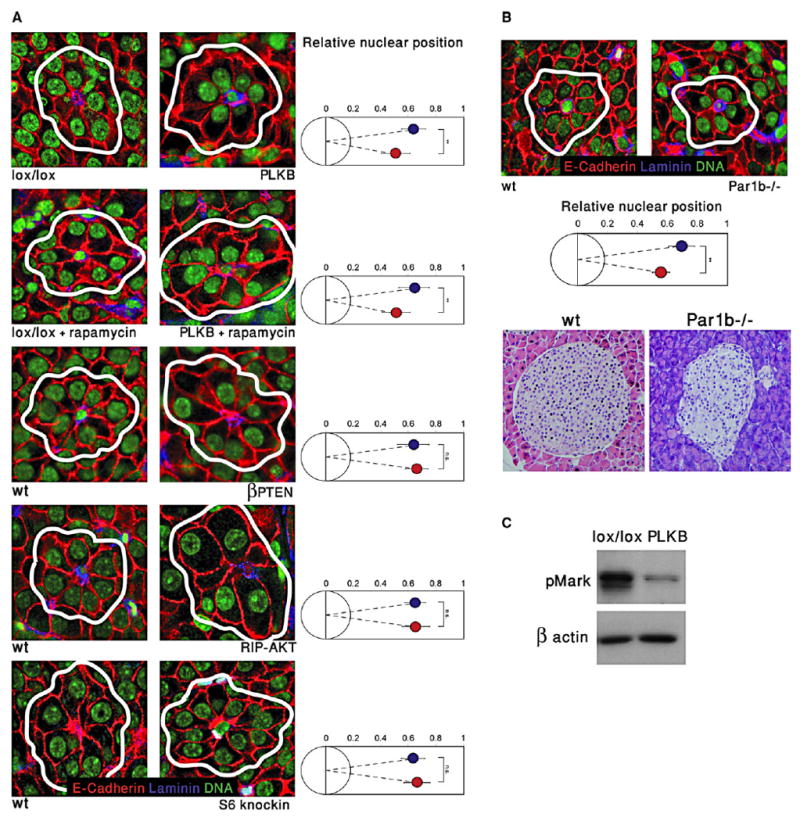
(A) Images of islets from several mutant strains, highlighting rosettes of β cells surrounding capillaries. The position of the nucleus in β cells (right panels) was determined relative to the center of rosettes. Red, E-Cadherin; blue, Laminin; green, nuclei. White lines denote rosettes. Blue, wild-type; red, mutant or transgenic. Original magnification, 600×. Analysis was performed on the same mice as in Figure 4.
(B) Nuclei are shifted to the center of rosettes in Par1b−/− islets. Top, immunofluorescent image (magnification 600×) of representative rosettes from wild-type and Par1b−/− islets, and quantification. Bottom, hematoxylin and eosin staining (400× magnification) showing abnormal distribution of nuclei in Par1b mutant islets.
(C) Reduced phosphorylation of Mark proteins in lysates from PLKB islets, compared with control LKB1lox/lox islets. The upper band represents phosphorylated Mark3, lower band represents Mark2/Par1b. Error bars denote standard deviations.
The Role of LKB1 in Insulin Secretion
To determine more rigorously the direct response of PLKB pancreata to glucose while preserving islet morphology, we measured insulin secretion in perfused pancreata. As shown in Figure 6A, perfused PLKB pancreata secreted more insulin in response to glucose, compared with wild-type littermates. Although the magnitude of the response was dramatically higher, the kinetics of insulin secretion was normal, as was the presence of a first and second phase of insulin secretion. Notably, PLKB pancreata did not secrete more insulin under basal (low) glucose levels. Increased insulin secretion in vivo could potentially be the result of increased β cell mass or insulin content. Morphometric analysis of β cell mass revealed only a small increase in PLKB mice, compared with controls (37% or less, depending on calculation method), which is unlikely to account for the dramatic effect seen in the perfusion experiments (Figure S7). Furthermore, pancreatic insulin content did not differ between wild-type and PLKB mice, in either fed or fasted states (Figure S7). An alternative explanation for enhanced insulin secretion in PLKB mice could be the increased size of individual β cells (Pende et al., 2000). To test this possibility, we treated mice with low doses of rapamycin for 2 weeks and then measured insulin secretion in perfused pancreata. Rapamycin treatment (at doses that normalize β cell size and eliminate phosphorylation of rpS6; Figure 4 and Figure S5) reduced the peak values of insulin secretion in both wild-type and PLKB mice, proving that the drug was active (Figure 6A). However, it did not prevent oversecretion of insulin in perfused pancreata of PLKB mice. These results suggest that enhanced insulin secretion in PLKB mice is at least partially independent of increased β cell size and hyperactivation of the mTOR pathway. Analysis of insulin secretion and glucose tolerance in Par1b mutant mice revealed no significant alteration, compared with wild-type mice (Figures 6B and 6C). To further study the effects of LKB1 on insulin secretion, we examined cultured islets prepared from PLKB mice. Glucose stimulation of mutant islets led to a modest increase in insulin secretion, compared with islets from LKB1lox/lox littermates (Figure 6D). However, the magnitude of the response was small and did not approach the observed phenotype in vivo. Moreover, in Min6 cells expressing a dominant negative mutant of LKB1 (Figure S8), we could not detect a significant increase in glucose-stimulated insulin secretion, compared with cells expressing wild-type LKB1 (Figure 6E). These results suggest that LKB1 is unlikely to affect directly acute stimulus-secretion coupling. Interestingly, we observed a significant increase in insulin content in Min6 cells expressing dominant negative LKB1 (Figure 6F). To begin the analysis of potential downstream mediators of the effect of LKB1 on β cell function, we examined Min6 cells that express dominant negative AMPK (described in Figure 4). In response to high glucose, we could not observe a significant increase in insulin secretion relative to control cells (Figure 6G). However, Min6 cells overexpressing dominant negative AMPK contained more insulin per protein than did control cells, similar to cells expressing dominant negative LKB1 (Figure 6H). These results suggest that LKB1, while restricting insulin secretion in vivo via unknown mechanisms, restricts insulin content in vitro by activating AMPK and potentially limiting biosynthetic processes.
Figure 6. Mechanism of LKB1-Controlled β Cell Function.
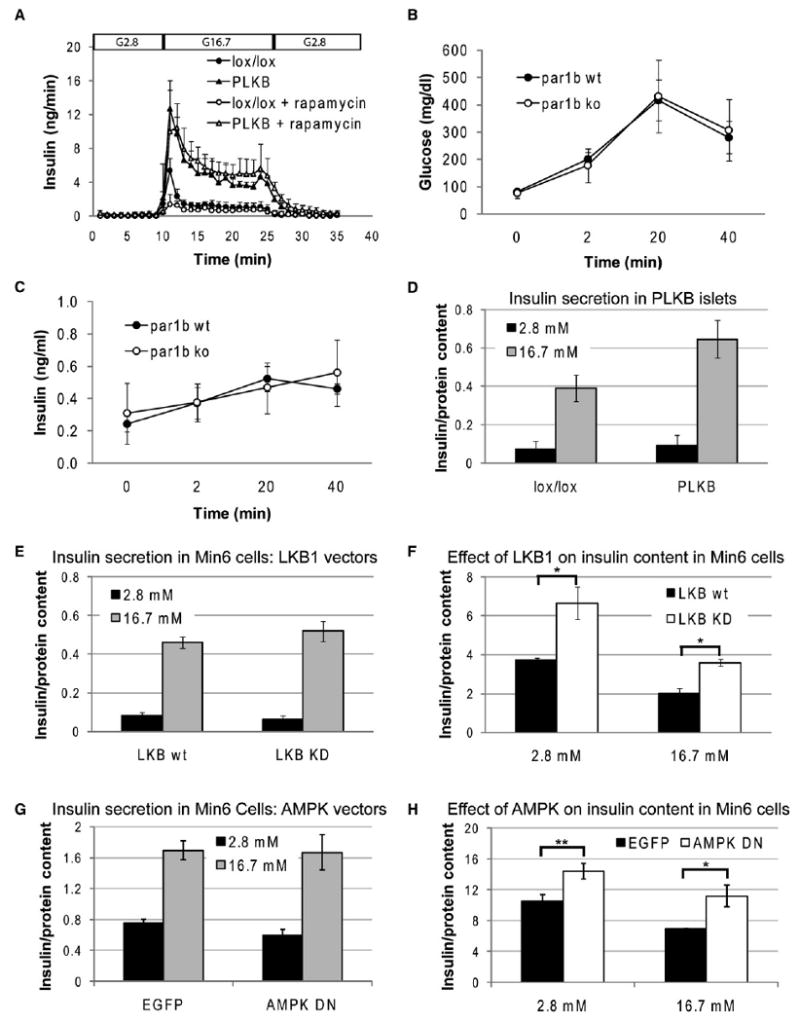
(A) Insulin secretion in perfused pancreata, and the effect of rapamycin. Glucose was infused at 2.8 mM (G2.8) or 16.7 mM (G16.7) at the indicated times. Where indicated, mice were treated with rapamycin for 2 weeks prior to perfusion as described in Experimental Procedures. Data represent the mean ± SE of 4–6 mice. Mice were injected with tamoxifen at 4 weeks of age, and the assay was performed 2–3 months later. PLKB versus wild-type (no rapamycin), all time points between 11 and 27 min, p < 0.05. Wild-type treated with rapamycin, only t = 11 min has p < 0.05 compared with untreated wild-type. In PLKB mice, effect of rapamycin treatment was not significant at any time point. In this panel only, error bars denote standard errors.
(B) Blood glucose levels in Par1b−/− mice and wild-type littermates, following the injection of glucose.
(C) Serum insulin levels in Par1b−/− mice and wild-type littermates, following the injection of glucose. Graphs in (B) and (C) show data from females only. Males produced more variable results (not shown) with no difference between wild-type and mutants. Error bars in (B) and (C) represent standard deviation. N = 3 wild-type, 4 Par1b−/− mice. Mice were 2–4 months old. Differences between wild-type and mutant in (B) and (C) were nonsignificant.
(D) Insulin secretion in response to low and high glucose in cultured PLKB islets.
(E) Insulin secretion in Min6 cells overexpressing wild-type or dominant negative LKB1.
(F) Insulin content in Min6 cells expressing wild-type or dominant negative LKB1 under low and high glucose. Cells were cultured overnight in 2.5 mM glucose, incubated in low glucose/no serum (KRB medium) for 2 hr, and then transferred to low or high glucose for 2 hr before being harvested for ELISA assay.
(G) Insulin secretion in Min6 cells overexpressing dominant negative AMPK or EGFP control.
(H) Insulin content in Min6 cells expressing EGFP or EGFP plus dominant negative AMPK. Experimental protocol was as in (F). Insulin content and secretion in (D)–(H) are expressed in ng insulin/μg protein.
Discussion
LKB1 and β Cell Polarity
β cells bear many features of epithelial cells: they express E-Cadherin, are asymmetrically exposed to endothelial cell-derived basement membrane (Bonner-Weir, 1988; Nikolova et al., 2006), and concentrate the glucose transporter Glut2 in microvilli present in lateral surfaces (Orci et al., 1989). Physiologically, real-time imaging of isolated islets showed that insulin is preferentially secreted to the lateral surfaces of β cells, away from blood vessels (Takahashi et al., 2002). Despite these data, β cells are normally not conceived as polarized epithelium, because they do not face the outside world, do not have a visible lumen, and superficially appear as symmetric spheres.
The data presented here expose novel features of β cell polarity and provide a molecular mechanism for the generation and maintenance of β cell morphology. We observed that, in wild-type β cells, which are organized as rosettes around islet capillaries (Bonner-Weir, 1988), the nucleus is positioned at approximately 70% of the distance between the center of the rosette and the opposing β cell membrane. Additionally, monocilia localize at the lateral surfaces of β cells. Following acute deletion of LKB1, β cells undergo dramatic changes in their intracellular organization relative to blood vessels: the nucleus is relocated toward the intrarosette capillary, and the cilium shifts to the opposite pole of the cell. This phenotype is, in part, mimicked by the absence of the LKB1 target Par1b. In contrast, mutants in the PI3K-AKT-mTOR-rpS6 pathway do not show altered polarity of β cells.
What is the significance of these effects? Previous studies in cell lines showed that Par1b shifts epithelial cells from a “columnar” phenotype, characterized by an apical lumen, to “hepatic-like” polarity where the lumen is lateral (in the case of hepatocytes, bile canaliculi) (Cohen et al., 2004; Cohen et al., 2007). β cells were not previously assigned any of these epithelial properties. We propose that β cells should be viewed as hepatocyte-like epithelial elements with a structural organization that is shaped and maintained by LKB1/Par1b (see model, Figure 7A). The phenotype of PLKB and Par1b mutants is thus interpreted as a shift toward columnar polarity, perhaps representing a default state for these cells. Several observations are consistent with this idea. In normal β cells, hepatic-like polarity is manifested in the presence of lateral microvilli (Orci et al., 1989), the localization of cilia in these membrane domains (Figure 3C and Figure S1), and the preferred lateral secretion of insulin (Takahashi et al., 2002), even though secretion is not toward the outside world. The shift to columnar morphology in PLKB β cells is suggested by the repositioning of the nucleus toward the ECM (which should be considered “basal”) and the shift of cilia from lateral membranes to the cell surface opposing the ECM (which should be considered “apical”). Finally, reduced Glut2 staining in some faces of β cells is consistent with flattening of Glut2-rich lateral microvilli. Interestingly, LKB1 was shown to promote the formation of microvilli in intestinal cells (Baas et al., 2004). In addition, a recent study found a role for LKB1 in the specific apical trafficking of a fuel transporter in Drosophila (Filippi and Alessi, 2008; Jang et al., 2008).
Figure 7. Proposed Functions of LKB1 in β Cells.
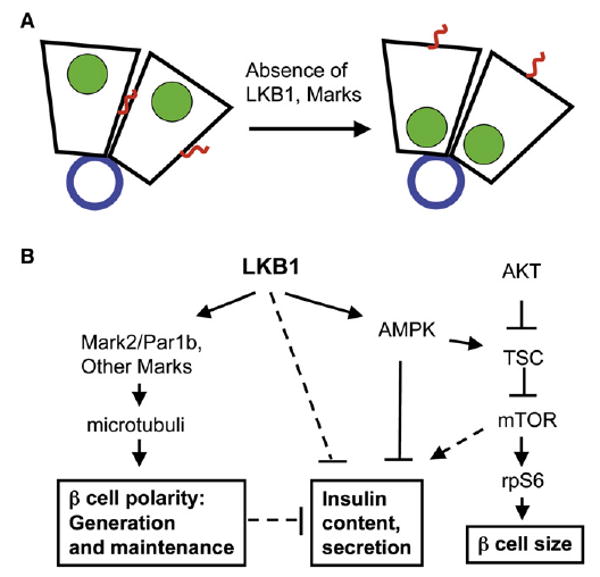
(A) A model of β cell polarity and the role of LKB1 and Mark proteins in shifting cells from a default state of columnar polarity to hepatic-like polarity, characterized by a lateral lumen. Islet capillaries at the center of rosettes provide basement membrane proteins and define the basal side of β cells. Blue, basement membrane; green, nuclei; red, cilia.
(B) Proposed pathways for the impact of LKB1 on multiple features of β cells. Dashed lines represent pathways suggested but not proven by our data.
The detailed mechanism by which LKB1 controls β cell polarity remains to be elucidated. It is likely that modulation of the cytoskeleton by Par1b and its homologs (Cohen et al., 2004), and by AMPK (Hardie, 2007; Lee et al., 2007; Mirouse et al., 2007), are involved. Likewise, the nature of signals upstream to LKB1 is still unclear.
Our data also reveal a novel link between LKB1 and monocilia. Although LKB1 is not essential for ciliogenesis, it had an impact on intracellular cilia positioning. The data suggest that the effects of LKB1 on cilia are related to the regulation of cell polarity and are mediated by the Par proteins. We propose that the weaker cilia phenotype seen in Par1b−/− β cells relative to PLKB1 β cells reflects the redundant participation of Par1 homologs (e.g., Mark1 and Mark3) downstream of LKB1. Given the emerging role of cilia as subcellular signaling centers (Singla and Reiter, 2006), it will be interesting to examine cilia in other models of LKB1-deficiency, in particular human patients with Peutz-Jeghers syndrome.
The physiological significance of proper β cell polarity remains unclear because of the pleiotropic phenotype LKB1 deficiency. To fully understand the impact of β cell polarity on function (i.e., insulin secretion), in vivo analysis of mutants defective specifically in β cell polarity will be required. Analysis of Par1b mutants (which recapitulate only partially the polarity defect of PLKB islets) is difficult owing to increased peripheral insulin sensitivity (Hurov et al., 2007). Nonetheless, our studies of Par1b−/− mice revealed no obvious change in insulin secretion in vivo (Figure 6B). It will also be important to examine the results of acute β cell-specific (as opposed to constitutive global) deletion of Par1b and other Mark genes.
LKB1 and β Cell Size
We find that, independently of its effect on β cell polarity, LKB1 acts to restrict the size of β cells. This activity is likely transduced via phosphorylation of AMPK and, consequently, the downregulation of the mTOR pathway (see model, Figure 7B). To the best of our knowledge, LKB1 has not previously been implicated in the regulation of cell size, although the regulation of mTOR signaling by LKB1-AMPK-TSC is well established (Corradetti et al., 2004; Inoki et al., 2003; Shaw et al., 2004a). Because AMPK is a major sensor for cellular energy stress, this pathway could serve to match β cell size to its metabolic state. Dynamic adaptation of β cell size was observed before; for example, β cells grow 25% in size during pregnancy (Dhawan et al., 2007) and in some settings of persistent hyperinsulinism (Anlauf et al., 2005). We propose that the modulation of cell size in these cases utilizes the LKB1-AMPK-mTOR-rpS6 axis.
LKB1 and β Cell Function
Our studies suggest that LKB1 affects β cell function via several independent mechanisms. The minor effect of LKB1 or AMPK deficiency on insulin secretion in vitro argues against a direct involvement of LKB1/AMPK in acute stimulus-secretion coupling. In contrast, our data reveal that LKB1, acting via AMPK, restricts insulin content in vitro. Several previous studies have shown that AMPK restricts insulin secretion (da Silva Xavier et al., 2003; Leclerc et al., 2004; Richards et al., 2005), although the effects of AMPK and metformin on β cell function remain controversial (Gleason et al., 2007). The higher content of insulin in Min6 cells expressing dominant negative LKB1 or AMPK suggests one possible mechanism for the negative regulation of β cell function by LKB1-AMPK. We speculate that AMPK activity during fasting (and to a lesser extent, under fed conditions) attenuates biosynthesis in β cells; in cells lacking LKB1 or AMPK activity, the biosynthetic machinery remains active under all conditions, maintaining higher levels of intracellular insulin. Physiologically, the LKB1-AMPK axis could coordinate energy charge with the need to replenish insulin content after prolonged secretion. How AMPK activity reduces insulin content remains to be discovered, but a plausible candidate is the mTOR pathway, which is known to be involved in protein synthesis as well as insulin gene transcription (Dowling et al., 2007; Leibiger et al., 1998; Reiter et al., 2005). This idea is also consistent with a previous report that AMPK activity reduces insulin gene expression (da Silva Xavier et al., 2003).
In sharp contrast to the situation in vitro, our data (Figure 6A and Figure S7) suggest the existence of other pathways by which LKB1 restricts acute insulin secretion in vivo, independently of insulin content, cell size, and mTOR signaling. We speculate that these pathways are linked to the effect of LKB1 on β cell polarity, islet architecture, and the anatomical relationship of β cells to blood vessels. More experiments will be required to define in completion the mechanisms by which LKB1 controls β cell function. Other targets of LKB1 could also restrict insulin secretion (Figure 7B). For example, the LKB1 targets SIK2 and Mark2 were previously shown to phosphorylate and prevent the nuclear translocation of TORC2, a coactivator of the key transcription factor CREB (Jansson et al., 2008; Screaton et al., 2004). CREB activity is thought to be important for restoring aspects β cell metabolism after secretion, in preparation for the next meal. In the absence of LKB1 (and inactivity of its targets), increased transcriptional activity of CREB could positively affect β cell function. The pathway leading from LKB1 to insulin secretion could be of therapeutic significance, because it offers opportunities for pharmacologic enhancement of insulin secretion in the context of diabetes.
LKB1 and the Maintenance of Cell Polarity
Previous studies have focused on the roles of LKB1 and its targets in the initiation of cell polarity. The use of a temporally controlled gene deletion system allowed us to assess the function of LKB1 in the maintenance of morphological homeostasis. Our data show that, just like insulin secretion and cell size, features long recognized as highly plastic, the maintenance of proper β cell polarity also requires ongoing signaling. Interestingly, the activity of LKB1 is limited to shaping the proper polarity of β cells, because even in its absence β cells have a clear polarized organization. It remains to be determined how the “morphological plasticity” of β cells affects their function.
Conclusions
Although proper β cell size, morphology, and the magnitude of insulin secretion are controlled by distinct molecular pathways, we identify here LKB1 as a central upstream regulator of all these cellular properties. It is tempting to suggest that LKB1 integrates multiple inputs, including extracellular cues and intracellular energy charge, to mount an optimal cellular response on a dynamic basis. Testing this idea will require further experiments and may open up new perspectives on cellular integration of information and morphological homeostasis of tissues.
Experimental Procedures
Mice
Strains used in this study were LKB1lox/lox (Hezel et al., 2008), pdx1-CreER™ (Gu et al., 2002), Par1b−/− (Hurov et al., 2007), rpS6KI/KI (Ruvinsky et al., 2005), and Insulin-AKT (Tuttle et al., 2001). PCR genotyping was performed on DNA extracted from ear punch biopsies, using conditions as previously described. Sections of insulin-Cre; PTENlox/lox pancreata were the generous gift of Bangyan stiles (Stiles et al., 2006). GTT, ITT, and measurements of serum insulin, pancreatic insulin content, and protein content were performed as described elsewhere (Nir et al., 2007).
Tamoxifen (Sigma, 20 mg/ml in corn oil) was injected subcutaneously. Two daily doses of 8 mg were used to achieve near total deletion of LKB1 in β cells. Rapamycin (0.2 mg/kg) was administered by IP injections every other day. The joint ethics committee (IACUC) of the Hebrew University and Hadassah Medical Center approved the study protocol for animal welfare. The Hebrew University is an AAALAC International accredited institute.
Gene Expression and Analysis
A list of antibodies used is provided in the Supplemental Data. To calculate cell size on tissue sections, the circumference of E-Cadherin-stained cells was determined using Image J. Alternatively, we used forward-scatter FACS plots of dissociated islets, prepared as described elsewhere (Dor et al., 2004; Weinberg et al., 2007). Nuclear position was calculated using well-defined rosettes in islets stained for DNA, laminin, and E-cadherin. The distance of a β cell nucleus from the center of rosette was measured on a scale between 0 (center of rosette) and 1 (β cell membrane farthest from center of rosette). β cell mass was determined morphometrically as described elsewhere (Nir et al., 2007). Bioinformatics analysis to determine which LKB1 targets are expressed in β cells was performed as follows. Microarray data sets available through EPConDB (Mazzarelli et al., 2007) were searched for wild-type mouse islet cell samples. Thirty-five assays from seven studies were found using either Affymetrix or Panc Chip (Kaestner et al., 2003) arrays. For Affymetrix-based assays, present/marginal/absent calls from the MAS4/MAS5 software were used to determine whether a transcript was expressed. For Panc Chips, a P (present) call was made if the signal for the gene reporter of interest was above 90% of the blanks on the array (Mazzarelli et al., 2006). For each of the 13 genes in the LKB1 target list that were represented on the arrays, P and A calls were collected for each gene reporter in each assay so that at least seven independent calls were available. The final summary call was based on whether there were at least two P calls from independent samples. One call was defined as M (marginal).
Tissue Culture Experiments
Min6 cells were cultured in 15% FCS and 25 mM glucose. Cells were infected with lentiviruses containing EGFP and dsRED, or EGFP and a D157A dominant-negative mutant of AMPK alpha (da Silva Xavier et al., 2003; Woods et al., 2000) (a gift of Rachel Hertz). EGFP+ cells were sorted by flow cytometry. Alternatively, cells were infected with pBABE-Puro retroviruses expressing wild-type or a K78I dominant negative mutant of human LKB1 (Shaw et al., 2004b) (http://www.addgene.org). Insulin secretion assays were performed as described elsewhere (da Silva Xavier et al., 2003).
Pancreas Perfusion
Perfusion of mouse pancreases was performed as described elsewhere (Miki et al., 2005). Briefly, Pdx1-CreER™; LKB1lox/lox and control (LKB1lox/lox) mice at 12–16 weeks of age were pretreated with intraperitoneal injections of 0.2 mg/kg rapamycin (LC Laboratories Boston, MA) every other day for 14 days. Thirty-two hours after the final rapamycin treatment, mice were fasted overnight (16 hr). Pancreata were preperfused with KRB buffer containing 2.8 mM glucose for 10 min before sampling. After 10 min sampling with KRB buffer containing 2.8 mM glucose, glucose concentration was shifted to 16.7 mM for 15 min, and was then brought back to 2.8 mM. The flow rate of the perfusate was 1 ml/min. Insulin in the perfusate was measured using an ELISA kit (Mesacup Insulin Test) from Medical & Biological Laboratories Co., Ltd. (Nagoya, Japan).
Supplementary Material
Acknowledgments
We are grateful to Rachel Hertz and Jacob Bar-Tana for providing advice and generously sharing unpublished reagents. We thank Cris Welling for technical assistance; Morris Birnbaum for providing RIP-AKT mice; Bangyan Stiles for providing slides of PTEN mutant mice; Ittai Ben-Porath, Hadas Masuri, and Rotem Karni for assistance with viral infections; and Chris Wright for the gift of anti pdx1 antibodies. Y. Dor was supported by grants from JDRF, NIH (BCBC), ISF, ICRF (Barbara Goodman PC-RCDA), the Sixth Framework Programme of the European Union, and the JDRF Center for β Cell Therapy in Diabetes. This work was supported in part by an NIH grant (R37 DK16746, to M.A. Permutt) and the Core Research for Evolutional Science and Technology (CREST) to S. Seino. The Washington University DRTC (NIH P60 DK20579) is acknowledged for assistance from the Immunoassay Core. C. Stoeckert and E. Manduchi were supported by JDRF and NIH (BCBC).
Footnotes
Supplemental data include Supplemental Experimental Procedures and eight figures and can be found with this article online at http://www.cell.com/cell-metabolism/supplemental/S1550-4131(09)00258-7.
References
- Alessi DR, Sakamoto K, Bayascas JR. LKB1-dependent signaling pathways. Annu Rev Biochem. 2006;75:137–163. doi: 10.1146/annurev.biochem.75.103004.142702. [DOI] [PubMed] [Google Scholar]
- Anlauf M, Wieben D, Perren A, Sipos B, Komminoth P, Raffel A, Kruse ML, Fottner C, Knoefel WT, Monig H, et al. Persistent hyperinsulinemic hypoglycemia in 15 adults with diffuse nesidioblastosis: diagnostic criteria, incidence, and characterization of beta-cell changes. Am J Surg Pathol. 2005;29:524–533. doi: 10.1097/01.pas.0000151617.14598.ae. [DOI] [PubMed] [Google Scholar]
- Baas AF, Kuipers J, van der Wel NN, Batlle E, Koerten HK, Peters PJ, Clevers HC. Complete polarization of single intestinal epithelial cells upon activation of LKB1 by STRAD. Cell. 2004;116:457–466. doi: 10.1016/s0092-8674(04)00114-x. [DOI] [PubMed] [Google Scholar]
- Bardeesy N, Sinha M, Hezel AF, Signoretti S, Hathaway NA, Sharpless NE, Loda M, Carrasco DR, DePinho RA. Loss of the Lkb1 tumour suppressor provokes intestinal polyposis but resistance to transformation. Nature. 2002;419:162–167. doi: 10.1038/nature01045. [DOI] [PubMed] [Google Scholar]
- Barnes AP, Lilley BN, Pan YA, Plummer LJ, Powell AW, Raines AN, Sanes JR, Polleux F. LKB1 and SAD kinases define a pathway required for the polarization of cortical neurons. Cell. 2007;129:549–563. doi: 10.1016/j.cell.2007.03.025. [DOI] [PubMed] [Google Scholar]
- Bernal-Mizrachi E, Wen W, Stahlhut S, Welling CM, Permutt MA. Islet beta cell expression of constitutively active Akt1/PKB alpha induces striking hypertrophy, hyperplasia, and hyperinsulinemia. J Clin Invest. 2001;108:1631–1638. doi: 10.1172/JCI13785. [DOI] [PMC free article] [PubMed] [Google Scholar]
- Bonner-Weir S. Morphological evidence for pancreatic polarity of beta-cell within islets of Langerhans. Diabetes. 1988;37:616–621. doi: 10.2337/diab.37.5.616. [DOI] [PubMed] [Google Scholar]
- Cano DA, Murcia NS, Pazour GJ, Hebrok M. Orpk mouse model of polycystic kidney disease reveals essential role of primary cilia in pancreatic tissue organization. Development. 2004;131:3457–3467. doi: 10.1242/dev.01189. [DOI] [PubMed] [Google Scholar]
- Chen YM, Wang QJ, Hu HS, Yu PC, Zhu J, Drewes G, Piwnica-Worms H, Luo ZG. Microtubule affinity-regulating kinase 2 functions downstream of the PAR-3/PAR-6/atypical PKC complex in regulating hippocampal neuronal polarity. Proc Natl Acad Sci USA. 2006;103:8534–8539. doi: 10.1073/pnas.0509955103. [DOI] [PMC free article] [PubMed] [Google Scholar]
- Cohen D, Brennwald PJ, Rodriguez-Boulan E, Musch A. Mammalian PAR-1 determines epithelial lumen polarity by organizing the microtubule cytoskeleton. J Cell Biol. 2004;164:717–727. doi: 10.1083/jcb.200308104. [DOI] [PMC free article] [PubMed] [Google Scholar]
- Cohen D, Tian Y, Musch A. Par1b promotes hepatic-type lumen polarity in Madin Darby canine kidney cells via myosin II- and E-cadherin-dependent signaling. Mol Biol Cell. 2007;18:2203–2215. doi: 10.1091/mbc.E07-02-0095. [DOI] [PMC free article] [PubMed] [Google Scholar]
- Corradetti MN, Inoki K, Bardeesy N, DePinho RA, Guan KL. Regulation of the TSC pathway by LKB1: evidence of a molecular link between tuberous sclerosis complex and Peutz-Jeghers syndrome. Genes Dev. 2004;18:1533–1538. doi: 10.1101/gad.1199104. [DOI] [PMC free article] [PubMed] [Google Scholar]
- da Silva Xavier G, Leclerc I, Varadi A, Tsuboi T, Moule SK, Rutter GA. Role for AMP-activated protein kinase in glucose-stimulated insulin secretion and preproinsulin gene expression. Biochem J. 2003;371:761–774. doi: 10.1042/BJ20021812. [DOI] [PMC free article] [PubMed] [Google Scholar]
- Dhawan S, Georgia S, Bhushan A. Formation and regeneration of the endocrine pancreas. Curr Opin Cell Biol. 2007;19:634–645. doi: 10.1016/j.ceb.2007.09.015. [DOI] [PMC free article] [PubMed] [Google Scholar]
- Dor Y, Brown J, Martinez OI, Melton DA. Adult pancreatic beta-cells are formed by self-duplication rather than stem-cell differentiation. Nature. 2004;429:41–46. doi: 10.1038/nature02520. [DOI] [PubMed] [Google Scholar]
- Dowling RJ, Zakikhani M, Fantus IG, Pollak M, Sonenberg N. Metformin inhibits mammalian target of rapamycin-dependent translation initiation in breast cancer cells. Cancer Res. 2007;67:10804–10812. doi: 10.1158/0008-5472.CAN-07-2310. [DOI] [PubMed] [Google Scholar]
- Filippi BM, Alessi DR. Novel role for the LKB1 pathway in controlling monocarboxylate fuel transporters. J Cell Biol. 2008;183:7–9. doi: 10.1083/jcb.200809056. [DOI] [PMC free article] [PubMed] [Google Scholar]
- Gleason CE, Lu D, Witters LA, Newgard CB, Birnbaum MJ. The role of AMPK and mTOR in nutrient sensing in pancreatic beta-cells. J Biol Chem. 2007;282:10341–10351. doi: 10.1074/jbc.M610631200. [DOI] [PubMed] [Google Scholar]
- Gu G, Dubauskaite J, Melton DA. Direct evidence for the pancreatic lineage: NGN3+ cells are islet progenitors and are distinct from duct progenitors. Development. 2002;129:2447–2457. doi: 10.1242/dev.129.10.2447. [DOI] [PubMed] [Google Scholar]
- Hardie DG. AMP-activated/SNF1 protein kinases: conserved guardians of cellular energy. Nat Rev Mol Cell Biol. 2007;8:774–785. doi: 10.1038/nrm2249. [DOI] [PubMed] [Google Scholar]
- Hawley SA, Boudeau J, Reid JL, Mustard KJ, Udd L, Makela TP, Alessi DR, Hardie DG. Complexes between the LKB1 tumor suppressor, STRAD alpha/beta and MO25 alpha/beta are upstream kinases in the AMP-activated protein kinase cascade. J Biol. 2003;2:28. doi: 10.1186/1475-4924-2-28. [DOI] [PMC free article] [PubMed] [Google Scholar]
- Hezel AF, Gurumurthy S, Granot Z, Swisa A, Chu GC, Bailey G, Dor Y, Bardeesy N, Depinho RA. Pancreatic LKB1 deletion leads to acinar polarity defects and cystic neoplasms. Mol Cell Biol. 2008;28:2414–2425. doi: 10.1128/MCB.01621-07. [DOI] [PMC free article] [PubMed] [Google Scholar]
- Hurov JB, Huang M, White LS, Lennerz J, Choi CS, Cho YR, Kim HJ, Prior JL, Piwnica-Worms D, Cantley LC, et al. Loss of the Par-1b/MARK2 polarity kinase leads to increased metabolic rate, decreased adiposity, and insulin hypersensitivity in vivo. Proc Natl Acad Sci USA. 2007;104:5680–5685. doi: 10.1073/pnas.0701179104. [DOI] [PMC free article] [PubMed] [Google Scholar]
- Inoki K, Zhu T, Guan KL. TSC2 mediates cellular energy response to control cell growth and survival. Cell. 2003;115:577–590. doi: 10.1016/s0092-8674(03)00929-2. [DOI] [PubMed] [Google Scholar]
- Jang C, Lee G, Chung J. LKB1 induces apical trafficking of Silnoon, a monocarboxylate transporter, in Drosophila melanogaster. J Cell Biol. 2008;183:11–17. doi: 10.1083/jcb.200807052. [DOI] [PMC free article] [PubMed] [Google Scholar]
- Jansson D, Ng AC, Fu A, Depatie C, Al Azzabi M, Screaton RA. Glucose controls CREB activity in islet cells via regulated phosphorylation of TORC2. Proc Natl Acad Sci USA. 2008;105:10161–10166. doi: 10.1073/pnas.0800796105. [DOI] [PMC free article] [PubMed] [Google Scholar]
- Ji H, Ramsey MR, Hayes DN, Fan C, McNamara K, Kozlowski P, Torrice C, Wu MC, Shimamura T, Perera SA, et al. LKB1 modulates lung cancer differentiation and metastasis. Nature. 2007;448:807–810. doi: 10.1038/nature06030. [DOI] [PubMed] [Google Scholar]
- Kaestner KH, Lee CS, Scearce LM, Brestelli JE, Arsenlis A, Le PP, Lantz KA, Crabtree J, Pizarro A, Mazzarelli J, et al. Transcriptional program of the endocrine pancreas in mice and humans. Diabetes. 2003;52:1604–1610. doi: 10.2337/diabetes.52.7.1604. [DOI] [PubMed] [Google Scholar]
- Leclerc I, Woltersdorf WW, da Silva Xavier G, Rowe RL, Cross SE, Korbutt GS, Rajotte RV, Smith R, Rutter GA. Metformin, but not leptin, regulates AMP-activated protein kinase in pancreatic islets: impact on glucose-stimulated insulin secretion. Am J Physiol Endocrinol Metab. 2004;286:E1023–E1031. doi: 10.1152/ajpendo.00532.2003. [DOI] [PubMed] [Google Scholar]
- Lee JH, Koh H, Kim M, Kim Y, Lee SY, Karess RE, Lee SH, Shong M, Kim JM, Kim J, et al. Energy-dependent regulation of cell structure by AMP-activated protein kinase. Nature. 2007;447:1017–1020. doi: 10.1038/nature05828. [DOI] [PubMed] [Google Scholar]
- Leibiger IB, Leibiger B, Moede T, Berggren PO. Exocytosis of insulin promotes insulin gene transcription via the insulin receptor/PI-3 kinase/p70 s6 kinase and CaM kinase pathways. Mol Cell. 1998;1:933–938. doi: 10.1016/s1097-2765(00)80093-3. [DOI] [PubMed] [Google Scholar]
- Mazzarelli JM, Brestelli J, Gorski RK, Liu J, Manduchi E, Pinney DF, Schug J, White P, Kaestner KH, Stoeckert CJ., Jr EPConDB: a web resource for gene expression related to pancreatic development, beta-cell function and diabetes. Nucleic Acids Res. 2007;35:D751–D755. doi: 10.1093/nar/gkl748. [DOI] [PMC free article] [PubMed] [Google Scholar]
- Mazzarelli JM, White P, Gorski R, Brestelli J, Pinney DF, Arsenlis A, Katokhin A, Belova O, Bogdanova V, Elisafenko E, et al. Novel genes identified by manual annotation and microarray expression analysis in the pancreas. Genomics. 2006;88:752–761. doi: 10.1016/j.ygeno.2006.04.005. [DOI] [PubMed] [Google Scholar]
- Miki T, Minami K, Shinozaki H, Matsumura K, Saraya A, Ikeda H, Yamada Y, Holst JJ, Seino S. Distinct effects of glucose-dependent insulinotropic polypeptide and glucagon-like peptide-1 on insulin secretion and gut motility. Diabetes. 2005;54:1056–1063. doi: 10.2337/diabetes.54.4.1056. [DOI] [PubMed] [Google Scholar]
- Mirouse V, Swick LL, Kazgan N, St Johnston D, Brenman JE. LKB1 and AMPK maintain epithelial cell polarity under energetic stress. J Cell Biol. 2007;177:387–392. doi: 10.1083/jcb.200702053. [DOI] [PMC free article] [PubMed] [Google Scholar] [Retracted]
- Muoio DM, Newgard CB. Mechanisms of disease: molecular and metabolic mechanisms of insulin resistance and beta-cell failure in type 2 diabetes. Nat Rev Mol Cell Biol. 2008;9:193–205. doi: 10.1038/nrm2327. [DOI] [PubMed] [Google Scholar]
- Nikolova G, Jabs N, Konstantinova I, Domogatskaya A, Tryggvason K, Sorokin L, Fassler R, Gu G, Gerber HP, Ferrara N, et al. The vascular basement membrane: a niche for insulin gene expression and Beta cell proliferation. Dev Cell. 2006;10:397–405. doi: 10.1016/j.devcel.2006.01.015. [DOI] [PubMed] [Google Scholar]
- Nir T, Melton DA, Dor Y. Recovery from diabetes in mice by beta cell regeneration. J Clin Invest. 2007;117:2553–2561. doi: 10.1172/JCI32959. [DOI] [PMC free article] [PubMed] [Google Scholar]
- Orci L, Thorens B, Ravazzola M, Lodish HF. Localization of the pancreatic beta cell glucose transporter to specific plasma membrane domains. Science. 1989;245:295–297. doi: 10.1126/science.2665080. [DOI] [PubMed] [Google Scholar]
- Pende M, Kozma SC, Jaquet M, Oorschot V, Burcelin R, Le Marchand-Brustel Y, Klumperman J, Thorens B, Thomas G. Hypoinsulinaemia, glucose intolerance and diminished beta-cell size in S6K1-deficient mice. Nature. 2000;408:994–997. doi: 10.1038/35050135. [DOI] [PubMed] [Google Scholar]
- Reiter AK, Bolster DR, Crozier SJ, Kimball SR, Jefferson LS. Repression of protein synthesis and mTOR signaling in rat liver mediated by the AMPK activator aminoimidazole carboxamide ribonucleoside. Am J Physiol Endocrinol Metab. 2005;288:E980–E988. doi: 10.1152/ajpendo.00333.2004. [DOI] [PubMed] [Google Scholar]
- Richards SK, Parton LE, Leclerc I, Rutter GA, Smith RM. Over-expression of AMP-activated protein kinase impairs pancreatic {beta}-cell function in vivo. J Endocrinol. 2005;187:225–235. doi: 10.1677/joe.1.06413. [DOI] [PubMed] [Google Scholar]
- Ruvinsky I, Sharon N, Lerer T, Cohen H, Stolovich-Rain M, Nir T, Dor Y, Zisman P, Meyuhas O. Ribosomal protein S6 phosphorylation is a determinant of cell size and glucose homeostasis. Genes Dev. 2005;19:2199–2211. doi: 10.1101/gad.351605. [DOI] [PMC free article] [PubMed] [Google Scholar]
- Screaton RA, Conkright MD, Katoh Y, Best JL, Canettieri G, Jeffries S, Guzman E, Niessen S, Yates JR, III, Takemori H, et al. The CREB coactivator TORC2 functions as a calcium- and cAMP-sensitive coincidence detector. Cell. 2004;119:61–74. doi: 10.1016/j.cell.2004.09.015. [DOI] [PubMed] [Google Scholar]
- Shackelford DB, Shaw RJ. The LKB1-AMPK pathway: metabolism and growth control in tumour suppression. Nat Rev Cancer. 2009;9:563–575. doi: 10.1038/nrc2676. [DOI] [PMC free article] [PubMed] [Google Scholar]
- Shaw RJ, Bardeesy N, Manning BD, Lopez L, Kosmatka M, DePinho RA, Cantley LC. The LKB1 tumor suppressor negatively regulates mTOR signaling. Cancer Cell. 2004a;6:91–99. doi: 10.1016/j.ccr.2004.06.007. [DOI] [PubMed] [Google Scholar]
- Shaw RJ, Kosmatka M, Bardeesy N, Hurley RL, Witters LA, DePinho RA, Cantley LC. The tumor suppressor LKB1 kinase directly activates AMP-activated kinase and regulates apoptosis in response to energy stress. Proc Natl Acad Sci USA. 2004b;101:3329–3335. doi: 10.1073/pnas.0308061100. [DOI] [PMC free article] [PubMed] [Google Scholar]
- Shaw RJ, Lamia KA, Vasquez D, Koo SH, Bardeesy N, Depinho RA, Montminy M, Cantley LC. The kinase LKB1 mediates glucose homeostasis in liver and therapeutic effects of metformin. Science. 2005;310:1642–1646. doi: 10.1126/science.1120781. [DOI] [PMC free article] [PubMed] [Google Scholar]
- Shelly M, Cancedda L, Heilshorn S, Sumbre G, Poo MM. LKB1/STRAD promotes axon initiation during neuronal polarization. Cell. 2007;129:565–577. doi: 10.1016/j.cell.2007.04.012. [DOI] [PubMed] [Google Scholar]
- Singla V, Reiter JF. The primary cilium as the cell's antenna: signaling at a sensory organelle. Science. 2006;313:629–633. doi: 10.1126/science.1124534. [DOI] [PubMed] [Google Scholar]
- Stiles BL, Kuralwalla-Martinez C, Guo W, Gregorian C, Wang Y, Tian J, Magnuson MA, Wu H. Selective deletion of Pten in pancreatic beta cells leads to increased islet mass and resistance to STZ-induced diabetes. Mol Cell Biol. 2006;26:2772–2781. doi: 10.1128/MCB.26.7.2772-2781.2006. [DOI] [PMC free article] [PubMed] [Google Scholar]
- Takahashi N, Kishimoto T, Nemoto T, Kadowaki T, Kasai H. Fusion pore dynamics and insulin granule exocytosis in the pancreatic islet. Science. 2002;297:1349–1352. doi: 10.1126/science.1073806. [DOI] [PubMed] [Google Scholar]
- Tuttle RL, Gill NS, Pugh W, Lee JP, Koeberlein B, Furth EE, Polonsky KS, Naji A, Birnbaum MJ. Regulation of pancreatic beta-cell growth and survival by the serine/threonine protein kinase Akt1/PKBalpha. Nat Med. 2001;7:1133–1137. doi: 10.1038/nm1001-1133. [DOI] [PubMed] [Google Scholar]
- Weinberg N, Ouziel-Yahalom L, Knoller S, Efrat S, Dor Y. Lineage tracing evidence for in vitro dedifferentiation but rare proliferation of mouse pancreatic beta-cells. Diabetes. 2007;56:1299–1304. doi: 10.2337/db06-1654. [DOI] [PubMed] [Google Scholar]
- Woods A, Azzout-Marniche D, Foretz M, Stein SC, Lemarchand P, Ferre P, Foufelle F, Carling D. Characterization of the role of AMP-activated protein kinase in the regulation of glucose-activated gene expression using constitutively active and dominant negative forms of the kinase. Mol Cell Biol. 2000;20:6704–6711. doi: 10.1128/mcb.20.18.6704-6711.2000. [DOI] [PMC free article] [PubMed] [Google Scholar]
- Woods A, Johnstone SR, Dickerson K, Leiper FC, Fryer LG, Neumann D, Schlattner U, Wallimann T, Carlson M, Carling D. LKB1 is the upstream kinase in the AMP-activated protein kinase cascade. Curr Biol. 2003;13:2004–2008. doi: 10.1016/j.cub.2003.10.031. [DOI] [PubMed] [Google Scholar]
- Zaret KS. Pancreatic beta cells: responding to the matrix. Cell Metab. 2006;3:148–150. doi: 10.1016/j.cmet.2006.02.006. [DOI] [PubMed] [Google Scholar]
Associated Data
This section collects any data citations, data availability statements, or supplementary materials included in this article.