Abstract
Introducing flood control to an area of endemic waterborne diseases could have significant impacts on spatio-temporal occurrence of cholera. Using 21-years of data from Bangladesh, we conducted cluster analysis to explore changes in spatial and temporal distribution of cholera incidence since construction of flood control structures. Striking changes in temporal cluster patterns emerged, including a shift from dry season to rainy season clusters following flood protection and delayed clustering inside the protected areas. Spatial differences in pre-flood protection and post-protection cholera clusters are weaker. Changes in spatio-temporal cholera clustering, associated with implementation of flood protection strategies, could affect local cholera prevention efforts.
Keywords: cholera, Bangladesh, cluster, flood protection, spatial scan statistic
Introduction
Alteration of natural environments for development purposes often has unanticipated consequences for disease ecologies as traditional human-environmental interactions are changed. Studies of modified aquatic systems in Africa and Asia, involving the damming or impoundment of water sources, have almost universally shown not only a magnification of disease incidence but also changing spatio-temporal patterns of occurrence (Hughes & Hunter, 1970; Hunter 2003; Hunter et al., 1982; Keiser et al., 2005; Singh et al., 1999; Sow et al., 2002; Waddy, 1975). This study sought to determine whether the introduction of flood protection to a rural region of Bangladesh in the late 1980s resulted in similar changes in spatio-temporal patterns of cholera incidence through an exploration of clustering patterns.
Matlab, Bangladesh is a rural region located approximately 50km southeast of the capital city, Dhaka (Figure 1). According to local hospital records, cholera and other diarrheal diseases were endemic to the area in the 1960s and continue to persist today. Running from north to south through Matlab is the Dhonagoda River. The Dhonagoda floods annually during the monsoon season, resulting in fields, roads and households in some areas lying under several feet of water for weeks at a time.
Figure 1.
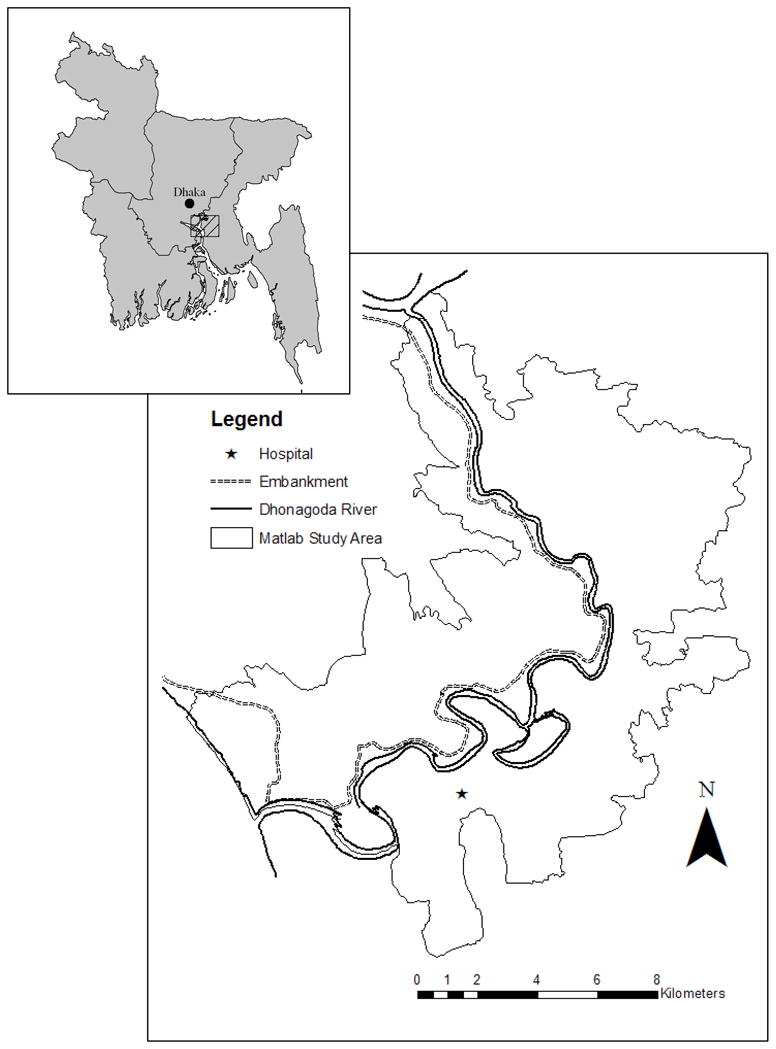
Location and Main Physical Features of Matlab, Bangladesh
In the 1980s, Matlab was targeted by the Government of Bangladesh as a site for flood mitigation efforts. Completed in 1989, the Meghna-Dhonagoda Irrigation Project (MDIP) resulted in flood protection for approximately half of the Matlab study area (Emch, 2000). The MDIP involved construction of a large earthen embankment along the northern edge of the Dhonagoda, as well as the installation of culverts, bridges and pumping stations (Ansary et al., 1997). The population inside the flood protected area still receives massive amounts of rainfall during the monsoon, but is not subject to the Dhonagoda overflowing its banks as water from upstream pours into the area. For Matlab residents living outside the flood protected area, seasonal patterns continue much as they did before, with perhaps slightly increased flood levels as water that previously spread across the area north of the river is now forced south by the embankment.
To explore possible impacts on cholera incidence associated with the introduction of flood protection, we looked at occurrence of hot-spot clusters in both space and time. We endeavored to answer two questions: 1) Does incidence of cholera cluster in both space and time in Matlab? 2) Have cluster patterns changed since flood protection was introduced? We believe that differences in cluster patterns of cholera can indicate whether the human-environmental interactions leading to cholera infection in Matlab were changed by the introduction of flood protection. Previous studies, conducted over a much shorter time period, have shown residence in the flood protected area of Matlab to be a risk factor in cholera incidence (Ali et al., 2002b; Emch, 1999; Emch, 2000). We were interested in investigating whether this relationship between flood protection and cholera would be maintained in a longitudinal cluster analysis, using data from a period that crossed the years prior to and following the introduction of flood protection.
We hypothesized that not only did cholera, a highly infectious and transmissible disease, cluster in Matlab, but that there would have been significant changes in the location of clusters following the completion of the MDIP embankment. We anticipated that cluster results from the pre-flood protection period would exhibit little, if any, spatial variation across the study area given the similar water environment shared year-round by all residents prior to 1989. Instead, we expected that pre-flood protection clusters would show a strong temporal pattern, driven by cholera seasonality.
Pronounced spatial differences in cluster pattern, we reasoned, would then emerge in the post-flood protection analysis. In particular, we hypothesized that there would be clear differentiation between clustering in the protected and unprotected regions in the rainy season, when flood protection structures impact cholera incidence. We, somewhat counter intuitively, expected to see more clusters detected in the protected area because clusters represent unusual spikes or dips in spatiotemporal cholera incidence, and the surface of cholera incidence would be more likely to be uneven inside the MDIP embankment than in the unprotected, flooded area of Matlab. We anticipated finding little or no spatial differentiation in dry season clustering across the study area following MDIP completion, since theoretically all of Matlab is experiencing the same water environment when there is no flooding.
Background
Approximately 200,000 people live in Matlab, and population density is high, at nearly 1000 people per square kilometer (Ali et al., 2002a). The majority of Matlab’s residents are engaged in agricultural production, primarily of rice, and are of extremely low socioeconomic status. Residential housing patterns are organized around baris, groupings of households connected through the patrilineal line. Upon marriage, women leave the baris of their birth to go live in their husband’s bari. The number of households in baris range from one to dozens across Matlab, with an average of five to six per bari (Ali et al., 2005). Bari residents share communal water sources located close to the family compounds, including rivers, canals and ponds. There is also water sharing across baris, particularly when water sources are large and border several family lands, such as with the Dhonagoda River.
Bangladesh has a subtropical monsoon climate. Little to no rainfall occurs in the dry months of December to May. As heat builds at the end of the dry season in April and May, the monsoons rains arrive, deluging the country with feet of rain from June to November. The regularity of the monsoon climate encourages the regularity of Bangladesh’s cholera cycles.
Cholera in Bangladesh exhibits high seasonality, with incidence peaking in September through December, at the end of the rainy season. There is typically a smaller outbreak in April or May, just prior to the monsoon (Faruque et al., 2005; Longini et al., 2002). Although the precise cause triggering the outbreaks during the rainy season are not understood, they have been correlated with increases in water levels, copepod counts, plankton levels and bacteriophage populations (Colwell et al., 1992; Faruque, 2005; Huq, 2005). The dry season outbreaks, in comparison, occur when surface water sources are at their lowest point. At this point in the year, residents of Matlab are using depleted water sources harboring potentially dense populations of Vibrio cholerae bacteria (hereafter V. cholerae).
Multiple strains of V. cholerae bacteria cause epidemic cholera, and well-documented and significant shifts have taken place in the types responsible for the majority of cholera cases in Matlab. Two cholera serogroups exist, O1 and O139, and within the O1 serogroup there are two biotypes: Classical and El Tor (Longini et al., 2002). Classical and El Tor cholera co-circulated in Matlab at the beginning of the study period until 1988 when Classical disappeared. El Tor then predominated until the highly virulent O139 emerged in 1993 (Ali et al., 2002a; Longini et al., 2002).
Data
We drew on health, demographic and geographic datasets to evaluate our research questions. Health and population data were gathered under the auspices of ICDDR,B’s Health & Demographic Surveillance System (HDSS), in operation since 1966. Every resident of Matlab is assigned a unique identification number in the HDSS that connects them to a village, a bari and a household. Twice monthly, each bari is visited by a trained ICDDR,B community health worker and information on demographic events such as births, deaths and migrations is recorded (Myaux et al., 1997).
During these visits, inquiries are made about illness in the bari and patients are referred to the main ICDDR,B hospital in Matlab. Treatment at this facility is both free and specialized in the treatment of diarrheal diseases, and residents are also provided free transportation to the hospital if they cannot make the trip on their own (Ali et al., 2002a; Emch & Ali, 2003). Diagnostic information is then linked to the demographic records of the hospitalized individual within the HDSS.
We created a database of all 9580 laboratory-defined cholera cases observed in Matlab from January 1, 1983 to December 31, 2003. This study period was chosen to give a seven year baseline of cholera distribution before the MDIP construction was completed (1983–1989), followed by 14 years (1990–2003) where cholera patterns could differentiate between the flood protected and unprotected area. These cases were then linked, via the bari ID number assigned by ICDDR,B, to mid-year background populations and geographic locations within a Geographic Information Systems (GIS) spatial database. This master geodatabase of monthly cholera counts and mid-year population for each of 7490 baris was queried for subsequent cluster analysis.
Methods
This study is interested in local clustering of cholera incidence, the scale at which a spatial scan statistic has been found to be good at detecting clusters (Song & Kuldorff, 2003). SaTScan™ is freely available software that implements a space-time scan statistic for point data (Kulldorff, 1997; Kulldorff & IMS, 2006;Kulldorff & Nagarwalla, 1995). It has been frequently used in cluster analysis of both infectious and chronic diseases (Gosselin et al., 2005; Polack et al., 2005; Fang et al., 2004), and was previously used by Emch & Ali (2003) to analyze cholera incidence over a 3-year timeframe. Locating clusters of unusual disease incidence can inform hypothesis testing of population or environmental drivers of ill-health, as well as direct the prevention or treatment efforts of health care workers.
SaTScan detects, at the local level, rates or case counts that are unexpectedly high or low, and then tests whether these unexpected rates or cases could have occurred randomly. It does so by moving a cylindrical window over the study area, centering on one data point (in this case each bari) after another. At each point the radius of the scanning window is varied according to user-defined spatial parameters. At the same time, the height of the cylinder is varied according to user-defined temporal parameters. The result of this process is a collection of overlapping cylinders that each represent a possible space-time cluster. For each cylinder, the null hypothesis, that disease risk is the same inside as outside the cylinder, is tested against the alternative hypothesis, that risk is elevated within the cylinder. The relative risk for each cluster is reported, as is a p-value calculated based on 999 Monte Carlo simulations.
Conducting a longitudinal examination of disease incidence can raise concerns over confounding due to the dynamics of changing background populations. SaTScan overcomes this potential confounding in two ways. First, in the Poisson analysis the expected number of cases at each point is assumed to be determined by the proportion of the total population connected to that point. Thus, clusters that are detected are not an artifact of higher populations in some baris. Secondly, SaTScan allows for the introduction of temporal variation in background population by using successive mid-year bari population counts as the denominator in calculations. This is important when considering cholera over a 21-year timeframe, as bari populations fluctuate with births, deaths and migrations. In addition to considering changing background populations when detecting clusters, SaTScan does not make a priori assumptions about cluster location, size or duration, but rather considers all potential options. As a result, clusters indicated by SaTScan are not biased by factors such as a bari’s flood protection status or season of cholera incidence.
Our initial SaTScan analysis utilized all cholera cases over the entire 21-year timeframe and looked for purely temporal and purely spatial clusters in addition to the spatio-temporal clusters explored in all subsequent analyses. The space and time limitations were set to 50% of the study population and 50% of the study period. This allowed the program to scan for clusters of both large and small size and duration. The purpose of this analysis was to gain a sense of how cholera clustered in Matlab for the entire 21-year study period, whether the most statistically significant clusters occurred before or after the MDIP divided the study area into two. Results reported by SaTScan do not indicate typical cholera patterns in Matlab, instead they represent cholera events that are unusually high or low given background rates.
Next, cholera cases and background bari populations were divided into two time periods, 1983–1989 and 1990–2003, which were analyzed separately for significant spatio-temporal clusters. The first dataset was defined as a baseline of how cholera initially clustered in Matlab, in the years before there was any differentiation in human-environment interactions due to flood protection. The second dataset was used to determine if there was observable differentiation in size and timing of clusters in flood protected and unprotected areas. While the MDIP embankment was completed in mid-year of 1989, it broke during the monsoon that year. It was reconstructed in 1990 and held up through the rainy season, thus 1990 was the first year that residents inside the MDIP embankment were fully protected from river flooding.
Rather than using the SaTScan defaults of 50% space and 50% time as the upper bounds for detected clusters, we chose to artificially lower the time limit to one month and the space limit to first 5% and then 10% of the study area. This artificial spatio-temporal scaling allowed us to explore micro-scale clustering of cholera within Matlab. By setting the time limit to one month, we were able to detect clusters that could be categorized as either occurring during the rainy season (June through November) or the dry season (December through May).
The low spatial bounds provided two benefits. Firstly, cholera incidence in Matlab has been shown to be affected most by those neighbors who live within a small distance of a resident’s bari, rather than by residents several kilometers away (Emch, Ali & Yunus, 2007). The results returned by SaTScan with these small bounds were therefore more representative of small pockets of cholera that could be seen as neighborhood-level interactions rather than a process occurring at the level of the entire study area. Secondly, the majority of clusters were wholly contained within either the protected or unprotected areas and could more readily be categorized for analytical purposes. There was high spatial and temporal consistency in the clusters reported by the 5% and 10% analyses, so only the results of the 5% analysis are reported here.
We did not conduct separate cluster analyses for the flood protected and unprotected areas. Doing so would have set another artificial bound on the analysis, given that the significance of clusters would be reported in terms of only half of the study area’s population and case counts. Additionally, comparability of the two areas is already possible given SaTScan’s identification of specific cluster centroids and the ability in ArcGIS to determine if that centroid is in the flood protected or unprotected area. SaTScan results were imported into geographic information system software (ArcGIS 9.1) and joined to the Matlab bari layer for mapping purposes.
Results
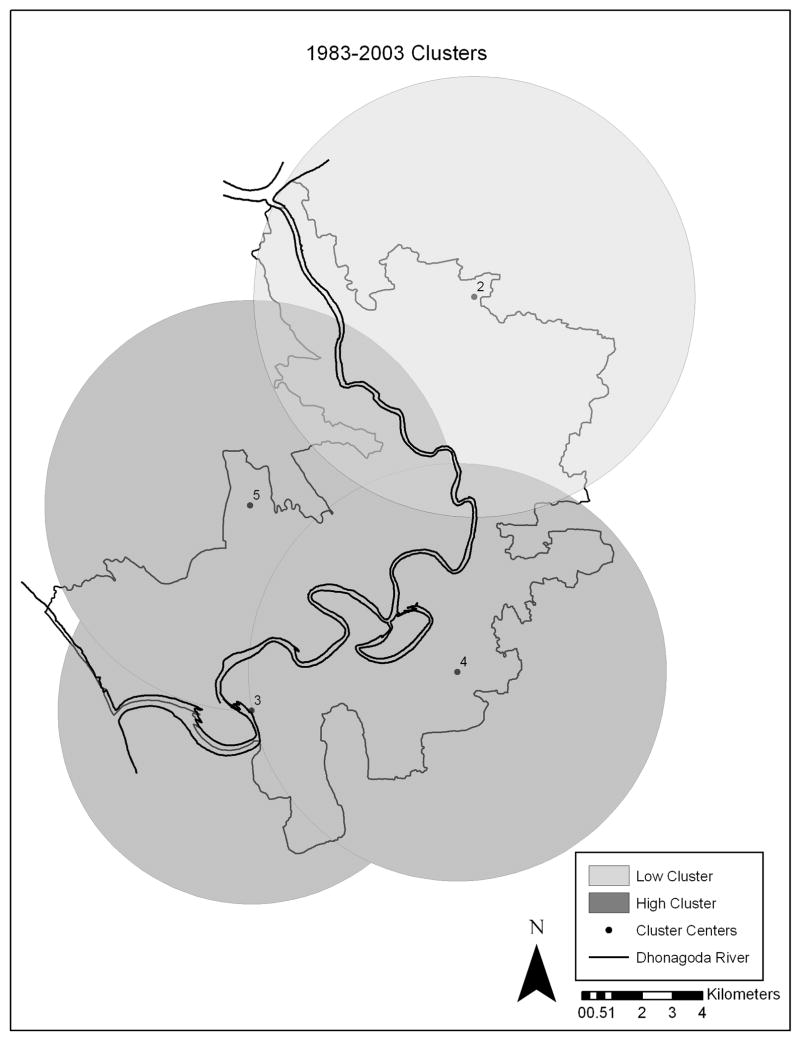
Results from the overall 1983–2003 analysis showed five significant clusters, three high and two low (Table 1). We explored occurrence of both high and low clusters because areas with lower than expected rates are of as much interest as those places with higher rates. The first low cluster, Cluster #1, had a relative risk of .27 and took place between 1999 and 2003. This cluster took place across all baris in the study area, as purely temporal clusters are exempt from the 50% spatial bounds. The other low cluster (Cluster #2) was purely spatial and centered in the non-flood protected northeast section of Matlab, had a relative risk of .10 and lasted the entire 21-year time period.
Table 1.
1983–2003 Cluster Results
| Cluster | Dimension | Type | Radius (km) | Start | End | P-Value | Relative Risk |
|---|---|---|---|---|---|---|---|
| 1 | Temporal | Low | All | 1999/1/1 | 2003/12/31 | 0.001 | 0.27 |
| 2 | Spatial | Low | 6.86 | 1983/1/1 | 2003/12/31 | 0.001 | 0.10 |
| 3 | Spatial | High | 6.02 | 1983/1/1 | 2003/12/31 | 0.001 | 3.43 |
| 4 | Space/Time | High | 6.50 | 1983/1/1 | 1987/12/31 | 0.001 | 2.38 |
| 5 | Space/Time | High | 6.39 | 1992/1/1 | 1995/12/31 | 0.001 | 3.00 |
Of the three high clusters reported by SaTScan, one was purely spatial and the other two were spatio-temporal. All three were located in the southern and western portion of Matlab, were highly statistically significant with p-values of .001, and had radii of six kilometers or more (Figure 3). Cluster #3 is a purely spatial cluster that took place between 1983 and 2003, with a relative risk of 3.43. Cluster #4 took place between 1983 and 1987, before MDIP construction, and is located primarily southeast of the Dhonagoda River, though its range does extend across the river into the future flood protected area. Cluster #5 occurred between 1992 and 1995, after MDIP construction was complete, and is centered in the flood protected region.
Figure 3.
1983–2003 Clusters
For all subsequent analyses, only those clusters that include 5 or more baris and with significant (<.05) p-values are reported in order to present only those results that can be considered both spatially and statistically meaningful. Though SaTScan was looking for both high and low spatio-temporal clusters, only high clusters were detected. The fact that no low clusters were reported in either the 5% or 10% analyses, though some were detected in the initial 21-year analysis, suggests that artificially lowering the spatio-temporal bounds has an effect on the detection of lower-than-expected trends in cholera incidence.
Spatial Differences
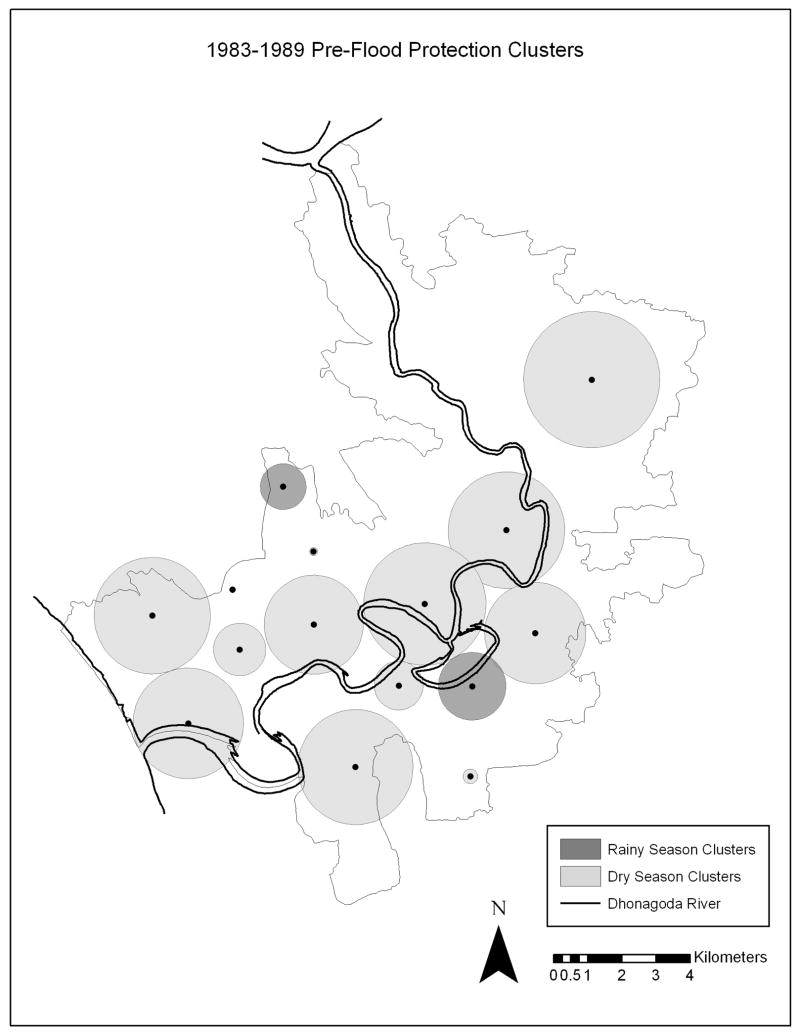
Fifteen significant clusters were detected in the 1983–1989, 5% space, one month time analysis (Table 2). The relative risks associated with these fifteen clusters are quite high, ranging from a low of 7.47 to a high of over 200. Also reported are the number of baris included in the clusters and the number of cholera cases observed inside the cluster versus the number expected, given background populations and total case counts in the study area. These clusters were then classified by their location in either the future-flood protected or future-unprotected areas of Matlab and mapped in order to examine whether any spatial variation in clusters existed prior to 1989. Of the fifteen clusters, 8 were centered in the future flood protected area and the remaining 7 in the future unprotected area (Figure 4). While the spatial locations of these clusters appear fairly diffuse over the study area, the majority occur in the central and southwestern portions of Matlab.
Table 2.
| Table 2. 1983–1989 Cluster Results, Sorted by flood protection status, season and relative risk | ||||||||
|---|---|---|---|---|---|---|---|---|
| Cluster | Flood Protection Status (Future) | Season | Radius (km) | P-value | Number of Baris | Observed | Expected | Relative Risk |
| 1 | Protected | Rainy | 0.63 | 0.001 | 59 | 29 | 0.40 | 73.36 |
| 2 | Protected | Dry | 0.08 | 0.001 | 6 | 5 | 0.02 | 212.65 |
| 3 | Protected | Dry | 0.11 | 0.001 | 8 | 8 | 0.07 | 107.24 |
| 4 | Protected | Dry | 0.72 | 0.001 | 74 | 16 | 0.31 | 51.88 |
| 5 | Protected | Dry | 1.52 | 0.001 | 496 | 44 | 2.13 | 20.91 |
| 6 | Protected | Dry | 1.60 | 0.001 | 637 | 37 | 2.08 | 17.94 |
| 7 | Protected | Dry | 1.36 | 0.001 | 380 | 34 | 2.18 | 15.72 |
| 8 | Protected | Dry | 1.60 | 0.001 | 350 | 26 | 2.27 | 11.54 |
| 9 | Unprotected | Rainy | 0.93 | 0.001 | 157 | 24 | 0.91 | 26.46 |
| 10 | Unprotected | Dry | 0.20 | 0.001 | 7 | 7 | 0.03 | 214.03 |
| 11 | Unprotected | Dry | 1.68 | 0.001 | 337 | 68 | 2.30 | 30.02 |
| 12 | Unprotected | Dry | 1.39 | 0.001 | 183 | 43 | 1.45 | 29.95 |
| 13 | Unprotected | Dry | 1.58 | 0.001 | 483 | 63 | 2.28 | 28.06 |
| 14 | Unprotected | Dry | 0.67 | 0.001 | 312 | 17 | 1.11 | 15.34 |
| 15 | Unprotected | Dry | 1.87 | 0.008 | 239 | 15 | 2.01 | 7.47 |
| Table 2. 1990–2003 Cluster Results, Sorted by flood protection status, season and relative risk Illustration Captions | ||||||||
|---|---|---|---|---|---|---|---|---|
| Cluster | Flood Protection Status | Season | Radius (km) | P-value | Number of Baris | Observed | Expected | Relative Risk |
| 1 | Protected | Rainy | 0.47 | 0.001 | 80 | 52 | 0.26 | 199.64 |
| 2 | Protected | Rainy | 0.22 | 0.001 | 13 | 9 | 0.05 | 188.06 |
| 3 | Protected | Rainy | 0.73 | 0.001 | 164 | 70 | 0.62 | 114.05 |
| 4 | Protected | Rainy | 0.85 | 0.001 | 135 | 54 | 0.55 | 99.70 |
| 5 | Protected | Rainy | 0.95 | 0.001 | 244 | 76 | 0.89 | 86.46 |
| 6 | Protected | Rainy | 1.66 | 0.001 | 263 | 68 | 1.19 | 58.04 |
| 7 | Protected | Rainy | 1.74 | 0.001 | 437 | 80 | 1.58 | 51.27 |
| 8 | Protected | Rainy | 0.65 | 0.010 | 38 | 7 | 0.22 | 31.58 |
| 9 | Protected | Rainy | 1.68 | 0.001 | 381 | 42 | 1.56 | 27.07 |
| 10 | Protected | Dry | 0.24 | 0.001 | 19 | 38 | 0.19 | 203.87 |
| 11 | Unprotected | Rainy | 0.67 | 0.001 | 114 | 68 | 0.32 | 215.15 |
| 12 | Unprotected | Rainy | 0.25 | 0.001 | 14 | 17 | 0.10 | 176.47 |
| 13 | Unprotected | Rainy | 0.58 | 0.001 | 38 | 34 | 0.25 | 135.05 |
| 14 | Unprotected | Rainy | 0.68 | 0.001 | 101 | 47 | 0.39 | 121.15 |
| 15 | Unprotected | Rainy | 0.54 | 0.001 | 54 | 26 | 0.25 | 103.13 |
| 16 | Unprotected | Rainy | 1.33 | 0.001 | 193 | 96 | 0.95 | 102.99 |
| 17 | Unprotected | Rainy | 0.66 | 0.001 | 91 | 31 | 0.33 | 94.81 |
| 18 | Unprotected | Rainy | 1.04 | 0.001 | 117 | 24 | 0.37 | 64.40 |
| 19 | Unprotected | Rainy | 0.33 | 0.034 | 29 | 6 | 0.16 | 37.27 |
| 20 | Unprotected | Rainy | 1.52 | 0.001 | 226 | 41 | 1.35 | 30.53 |
| 21 | Unprotected | Dry | 0.62 | 0.001 | 101 | 81 | 0.53 | 153.84 |
| 22 | Unprotected | Dry | 0.94 | 0.001 | 81 | 48 | 0.32 | 152.37 |
| 23 | Unprotected | Dry | 0.69 | 0.001 | 85 | 30 | 0.37 | 80.48 |
| 24 | Unprotected | Dry | 0.39 | 0.001 | 224 | 42 | 0.68 | 61.87 |
| 25 | Unprotected | Dry | 1.19 | 0.001 | 221 | 40 | 1.02 | 39.35 |
| 26 | Unprotected | Dry | 0.47 | 0.014 | 81 | 8 | 0.38 | 21.28 |
| 27 | Unprotected | Dry | 2.88 | 0.001 | 251 | 31 | 1.50 | 20.75 |
Figure 4.
1983–1989 Pre-Flood Protection Clusters
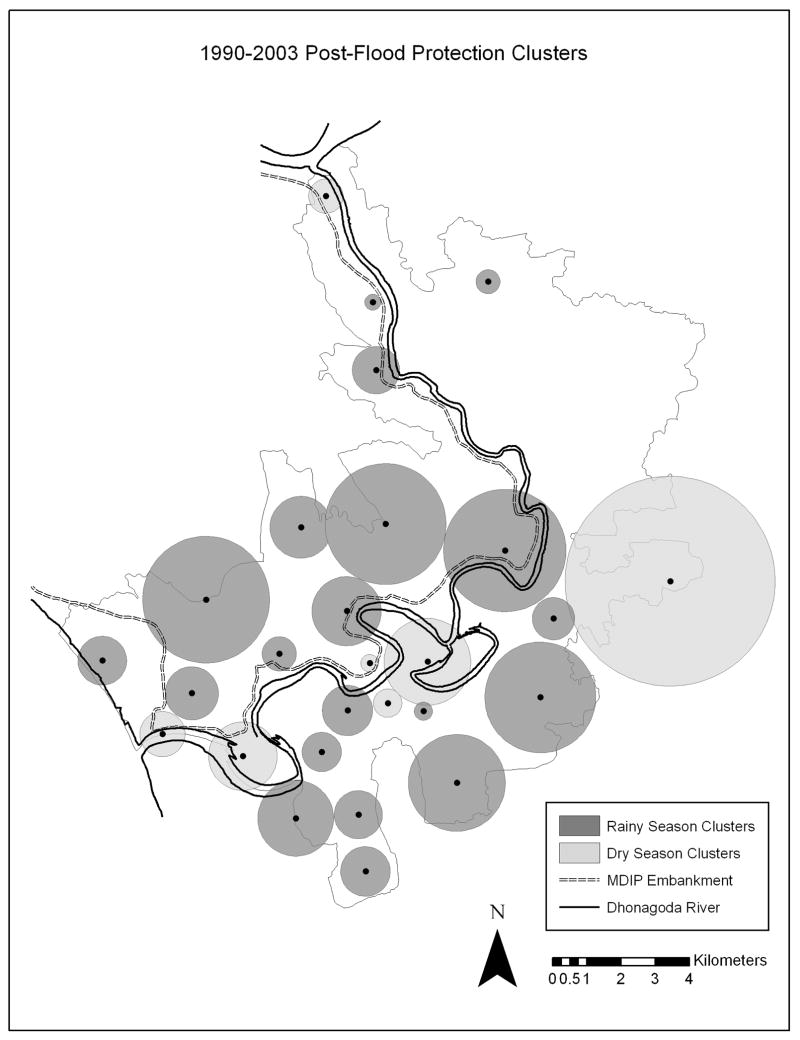
Twenty-seven highly significant clusters were detected between 1990 and 2003 (Table 3). Relative risks within these clusters were again quite high, ranging to well above 200, and no cluster contained less than ten baris. When classified and mapped, ten of the 1990–2003 clusters were centered in the flood protected area while seventeen were in the unprotected area (Figure 5). Similarly to the 1983–1989 cluster map the post-flood protection clusters are primarily distributed across the central and southwestern portion of Matlab, with only a few small clusters found in the northeast section of the study area.
Figure 5.
1990–2003 Post-Flood Protection Clusters
Seasonal Differences
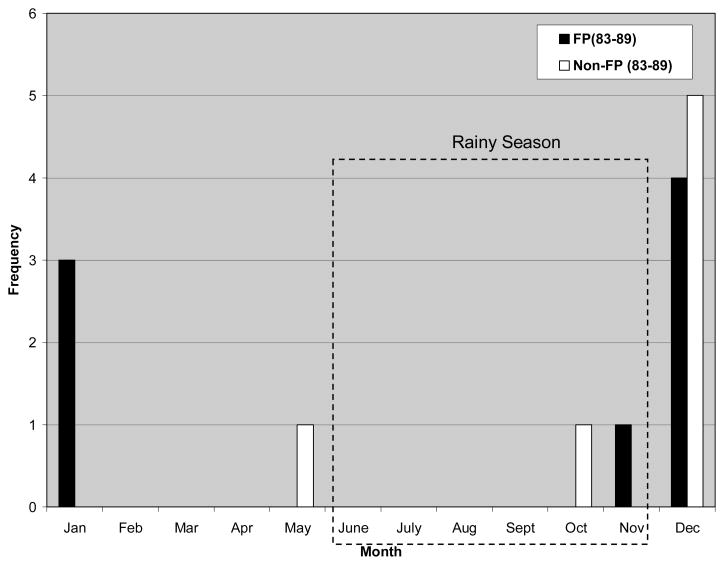
When clusters were categorized into dry versus rainy season occurrence, prior to the introduction of flood protection in Matlab clusters were primarily detected during the dry season. Of the 15 clusters reported in the 1983–1989 analysis (Figure 6), only two occur in the six months of the rainy season, here defined as June-November, and are evenly apportioned between the future flood protected and unprotected areas. They take place in October and November, at the very end of the rainy season when water levels are the highest. The remaining thirteen clusters take place either in December and January, the very beginning of the dry season when flood waters are still receding, or in May, when Matlab is at its driest or only beginning to experience rainfall. These dry season clusters are evenly split between the two areas divided by the MDIP in 1989.
Figure 6.
1983–1989 Pre-Flood Protection Clusters by Month
FP: Clusters taking place in the future flood protected area.
Non-FP: Clusters taking place in the future unprotected area.
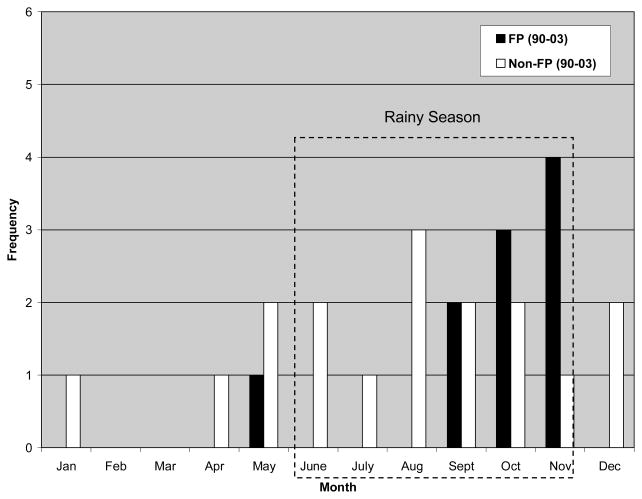
In contrast, during the 1990–2003 period the majority of clusters were detected in the rainy months of June-November. Only seven out of twenty-seven clusters detected took place in the dry season (Figure 7). The shift from dry to rainy clusters that took place after MDIP completion was not exactly the same across Matlab. Of the twenty dry season clusters that took place between 1990 and 2003, eleven occurred in the unprotected area south of the river, nine occurred in the flood protected north. The eleven flood protected rainy clusters occurred in the months between September and October, at the very end of the rainy season. In contrast, the nine clusters in the unprotected area of Matlab take place in every month of the rainy season.
Figure 7.
1990–2003 Post-Flood Protection Clusters by Month
FP: Clusters taking place in the future flood protected area.
Non-FP: Clusters taking place in the future unprotected area.
Annual Trends
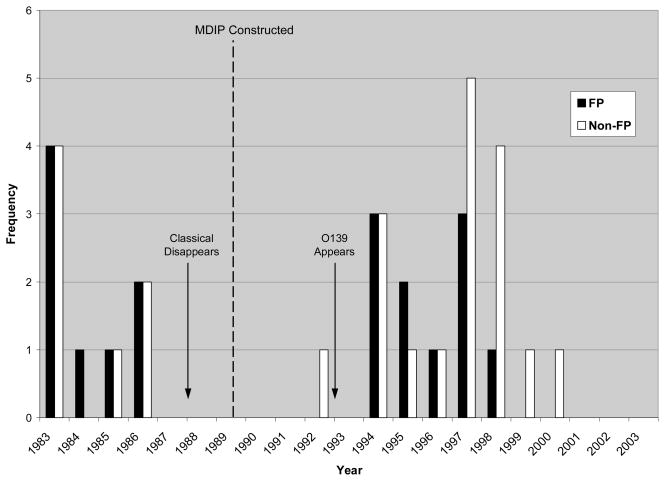
When examined on an annual rather than monthly timescale, the results for the 1983–1989 time period show no significant clusters occurring after 1986 (Figure 8). Indeed, the majority, 8 out of 15, take place in 1983. Although clusters are reported across both sections of Matlab in 1985 and 1986, none are detected between 1987 and 1989. This gap in reported cluster years continues in the 1990–2003 analyses; no clusters are reported until 1992. For three years on either side of the 1989 embankment construction, then, cholera prevalence in both the flood protected and unprotected areas conformed to statistically expected rates, no significant clusters of unexpectedly high or low incidence were detected.
Figure 8.
1983–1989 and 1990–2003 Clusters by Year
FP: Clusters taking place in the future flood protected area.
Non-FP: Clusters taking place in the future unprotected area.
Similar to the results depicted in a monthly representation of 1990–2003 clusters, there appear to be timing differences between the flood protected and unprotected detection of clusters. The gap in cluster detection ends sharply in the early 1990s, and the majority of clusters are detected in flood protected areas of Matlab. In 1997 this shifts, however, and many more clusters are detected in the unprotected areas. No clusters are detected in either the protected or unprotected areas after 2000, indicating that there were no greater than expected spikes in cholera incidence during the final four years of the study period.
Discussion & Conclusions
Our longitudinal analysis of how cholera in Matlab has been affected by the introduction of flood protection structures by the government of Bangladesh in the late 1980s found that the introduction of flood protection to Matlab significantly altered temporal patterns of cholera. While both spatial and temporal cluster patterns observed in the overall 21-year timescale changed when pre-MDIP and post-MDIP cholera were considered separately, the seasonal shift in clustering was more pronounced than changes in spatial patterns. While our cluster analysis neither tests nor makes assertions regarding flood protection status as a causal factor in cholera transmission, the findings do suggest that the construction of the MDIP had a significant impact on regional incidence patterns of cholera.
Results from the 21-year overall analysis revealed three broad patterns: an overall decrease in cholera incidence in Matlab, differences in the geography of high versus low spatial clusters of cholera and a shift in the location of unusually high spatiotemporal cholera clusters. The purely temporal cluster which took place across the entire study area between 1999 and 2003 is an indication that cholera prevalence in Matlab has, regardless of spatial location, fallen considerably in the past several years. This is likely the result of overall improvement in socioeconomic status of rural Bangladeshis. The two purely spatial clusters serve as an indication that consistently higher-than-expected prevalence of cholera existed in this southern portion of the study area regardless of temporal considerations, in contrast to persistently low cholera in the northeast. This finding is consistent with previous studies that identified southern Matlab as the foci of cholera incidence (Emch & Ali, 2003). The low cluster in northeastern Matlab might be an artifact of distance decay to the main hospital in Matlab, which is located in the southwest, or of the high coverage in that area during the cholera vaccine trails conducted in the 1980s (Ali et al., 2005). Comparing the two spatiotemporal clusters reported, we see that between 1983 and 1987 a large cluster was detected in southeastern Matlab, outside of the future protected area, whereas between 1992 and 1995 a large cluster took place inside the MDIP embanked region. Thus, given every case of cholera over the entire study period, the location of unusually high incidence of the illness shifted from southeastern Matlab prior to implementation of flood protection to northwestern Matlab, and inside the MDIP, in the years following flood protection.
This large, overall shift in clustering from the future non-embanked to the embanked area of Matlab was not repeated, however, when the data was stratified by time period. An even spatial distribution across Matlab was observed in the 1983–1989 cluster patterns, with half of the fifteen clusters detected inside and half detected outside the future MDIP area. This was as we expected, since prior to the introduction of flood protection there was little, if any, differentiation in environment and water-use behaviors between the areas that were subsequently divided by the MDIP embankment. In the period following the completion of the MDIP, we had anticipated that visually apparent changes in cholera patterns would emerge, that more clusters would be seen inside the protected area, particularly in the rainy season. We believed that unusual spikes in cholera events would be seen more frequently inside the protection of the MDIP embankment, whereas in the unprotected area the occurrence of cholera would be more spatially and temporally smooth. Surprisingly, however, there was not a strong spatial variation observed when we mapped the clusters reported for 1990–2003. Approximately two thirds of the clusters had their centers located in the unprotected area, the remaining third were located within the MDIP embankment. This suggests that the introduction of flood protection to Matlab did not have the major impacts on the spatial distribution of rainy season cholera clusters we had hypothesized.
Rather than distinct spatial shifts we had expected to see between the pre- and post-flood protection periods, the construction of the MDIP had a large effect on the temporality of cholera clustering. Classifying clusters according to season suggested that a shift from dry season to rainy season clustering has taken place since the introduction of flood protection. This shift did not occur equally between the flood protected and unprotected areas, however, as cholera clusters were detected earlier in the rainy season outside the MDIP embankment than within. While the overall shift from dry to rainy clustering was an unexpected result, the delayed clustering within the flood protected area is logical. Without the rising waters of the Dhonagoda, cholera incidence within the MDIP is more heavily influenced by monsoon rainfall. Being protected from swift river flooding delays cholera clustering inside the flood protected area.
Although our results suggest that unexpectedly high cholera clusters occur later in the rainy season in the protected area than unprotected area, these protected clusters took place earlier in the 1990–2003 period. This suggests that perhaps the flood protected areas of Matlab were initially more impacted by the arrival of virulent O139 cholera in the early 1990s. Perhaps, then, the alteration of the normal flood/drought cycle by the construction of the MDIP accelerated the impact of O139.
The transition from dry season clustering to rainy season clustering has implications for both Matlab’s residents and for ICDDR,B health workers. Local knowledge and awareness of cholera is based on long-term patterns of incidence, and shifts in these patterns can leave residents open to unexpected and unanticipated infections in times when they are not as guarded in their behaviors. Our findings also suggest that ICDDR,B can expect to have spatially and temporally smoother, low-level demand for cholera treatment in the dry season than previously, and that there will be greater demand for treatment and prevention in highly clustered areas during the rainy season.
Our study used seven years of cholera data prior to the construction of MDIP flood protection structures to determine baseline cholera clustering patterns. While we make the assumption that the years between 1983 and 1989 are representative of how cholera incidence clustered in Matlab before the flood experience of the population was split, this could be incorrect. It is possible that cyclical patterns of cholera clustering exist for Matlab that we are unable to detect within the data available. We therefore make the above statements about temporal changes with this caution.
The construction of the MDIP flood protection structures seems to have taken place at a time of stable cholera rates in Matlab, as indicated by a lack of clusters reported in the years immediately prior to and directly after MDIP construction in 1989. The absence of clusters reported between 1987 and 1989 might be due to the waning of immunity conferred during cholera vaccine trials in Matlab in 1985 (Ali et al., 2005), leading to an even risk surface across Matlab. These trials could also be responsible for the clusters observed in 1985 and 1986, though the spatial distribution of the vaccine trials was not controlled for in our analysis, In addition to this gap in clustering in the middle years of the analysis, cholera incidence seems smoother in space and time in the later years of the study period, as evidenced by the low cluster detected after 1999 in the 21-year analysis and the absence of any clusters reported after 2000 in the 1990–2003 analysis.
Our study did not control for age, sometimes an important confounding factor in cholera studies given high incidence among young children and their mothers. We decided not to control for age based upon the belief that age structures are similar across the Matlab study area. In addition, the study did not account for the steadily decreasing rates of cholera within Matlab over the past two decades due to generally increased socioeconomic status of rural Bangladeshis. Generally decreasing rates are likely across Matlab, but if there are differentials between the flood protected and unprotected areas, then that would be expressed in cluster detection.
Cluster analysis does not take water-use and sanitation behaviors into account, important variables in cholera incidence and potential confounders of the results described in this paper. Perhaps differences in spatio-temporal clustering we observed are less attributable to MDIP construction and due more to differences in behaviors across Matlab. Further analysis of clusters taking specific behaviors into account could strengthen the applicability of our findings.
Restrictions within user-imposed limits on the SaTScan software could affect the validity of the results. The space-time cluster detection within SaTScan uses a circular window, not an ideal shape for detection of clusters that occur along a linear route, such as a river (Aamodt et al., 2006). The small spatial and temporal bounds we imposed during cluster detection can also potentially decrease the strength of the results, but the general overlap between the 5% and 10% spatial clusters suggest that this isn’t an insurmountable limitation. As well, the detection of patterns described in previous literature, such as higher recorded incidence in April/May at the end of the dry season and again during the rainy season, as well as the spiking arrival of O139 in early 1993, suggest that SaTScan is a valid tool for analysis.
Our results indicate that the introduction of flood protection in Matlab has changed patterns of cholera incidence previously experienced in the area. Unusual spikes in cholera incidence, as indicated by the presence of significant clusters, now occur more frequently in the rainy season, perhaps at a time when, given historic patterns, cholera is expected and residents are more sanguine about potential infection. Future analyses will examine whether the introduction of flood protection affected all types of cholera incidence equally, an interesting question given the spikes of clusters that appeared in our results in the years when O139 arrived in Matlab. An examination of how the O1 and O139 serogroups have responded to the MDIP construction could suggest more detailed or different targeting strategies for the two types.
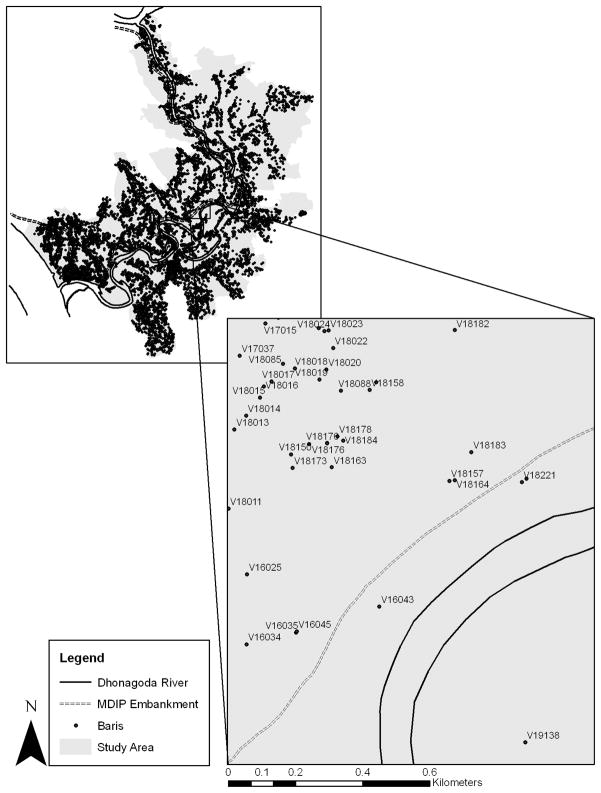
Figure 2.
Matlab GIS with Bari Locations Identified
References
- Aamodt G, Samuelsen SO, Skrondal A. A simulation study of three methods for detecting disease clusters. International Journal of Health Geographics. 2006:5–15. doi: 10.1186/1476-072X-5-15. [DOI] [PMC free article] [PubMed] [Google Scholar]
- Ali M, Emch M, Ashley C, Streatfield PK. Implementation of a medical geographic information system: concepts and uses. Journal of Health, Population, and Nutrition. 2001;19(2):100–110. [PubMed] [Google Scholar]
- Ali M, Emch M, Donnay JP, Yunus M, Sack RB. Identifying environmental risk factors for endemic cholera: a raster GIS approach. Health & Place. 2002a;8(3):201–210. doi: 10.1016/s1353-8292(01)00043-0. [DOI] [PubMed] [Google Scholar]
- Ali M, Emch M, Donnay JP, Yunus M, Sack RB. The spatial epidemiology of cholera in an endemic area of Bangladesh. Social Science & Medicine (1982) 2002b;55(6):1015–1024. doi: 10.1016/s0277-9536(01)00230-1. [DOI] [PubMed] [Google Scholar]
- Ali M, Emch M, von Seidlein L, Yunus M, Sack DA, Rao M, Holmgren J, Clemens JD. Herd immunity conferred by killed oral cholera vaccines in Bangladesh: a reanalysis. Lancet. 2005;366(9479):44–49. doi: 10.1016/S0140-6736(05)66550-6. [DOI] [PubMed] [Google Scholar]
- Ali M, Emch M, Yunus M, Sack RB. Are the environmental niches of Vibrio cholerae O139 different from those of Vibrio cholerae O1 El Tor? . International Journal of Infectious Diseases. 2001;5(4):214–219. doi: 10.1016/s1201-9712(01)90074-8. [DOI] [PubMed] [Google Scholar]
- Ansary S, Fulton L, Bhuiya A, Chowdury M. An Impact Evaluation of the Meghna-Dhonagoda Embankment. International Centre for Diarrhoeal Disease Reasearch, Bangladesh (ICDDR,B) & the Bangladesh Rural Advancement Committee (BRAC); Dhaka, Bangladesh: 1997. [Google Scholar]
- Colwell RR, Huq A, Islam MS, Aziz KM, Yunus M, Khan NH, Mahmud A, Sack RB, Nair GB, Chakraborty J, Sack DA, Russek-Cohen E. Reduction of cholera in Bangladeshi villages by simple filtration. Proceedings of the National Academy of Sciences of the United States of America. 2003;100(3):1051–1055. doi: 10.1073/pnas.0237386100. [DOI] [PMC free article] [PubMed] [Google Scholar]
- Emch M. Relationships between flood control, kala-azar, and diarrheal disease in Bangladesh. Environment and Planning A. 2000;32:1051–1063. [Google Scholar]
- Emch M. Diarrheal disease risk in Matlab, Bangladesh. Social Science & Medicine (1982) 1999;49(4):519–530. doi: 10.1016/s0277-9536(99)00146-x. [DOI] [PubMed] [Google Scholar]
- Emch M, Ali M. Spatial Cluster Analysis for Etiological Research and Identification of Socio-environmental Risk Factors. In: Khan OA, Skinner R, editors. Geographic Information Systems and Health Applications. Idea Group Pub; Hershey, PA: 2003. pp. 172–187. [Google Scholar]
- Emch M, Ali M, Yunus M. Risk areas and neighborhood-level risk factors for Shigella dysenteriae 1 and Shigella flexneri: Implications for vaccine development. Health & Place. 2008;14:96–105. doi: 10.1016/j.healthplace.2007.05.004. [DOI] [PubMed] [Google Scholar]
- Fang Z, Kulldorff M, Gregorio DI. Brain cancer mortality in the United States, 1986 to 1995: a geographic analysis. Neuro-Oncology. 2004;6(3):179–187. doi: 10.1215/S1152851703000450. [DOI] [PMC free article] [PubMed] [Google Scholar]
- Faruque SM, Naser IB, Islam MJ, Faruque AS, Ghosh AN, Nair GB, Sack DA, Mekalanos JJ. Seasonal epidemics of cholera inversely correlate with the prevalence of environmental cholera phages. Proceedings of the National Academy of Sciences of the United States of America. 2005;102(5):1702–1707. doi: 10.1073/pnas.0408992102. [DOI] [PMC free article] [PubMed] [Google Scholar]
- Gosselin P, Lebel G, Rivest S, Douville-Fradet M. The Integrated System for Public Health Monitoring of West Nile Virus (ISPHM-WNV): a real-time GIS for surveillance and decision-making. International Journal of Health Geographics. 2005;4:21. doi: 10.1186/1476-072X-4-21. [DOI] [PMC free article] [PubMed] [Google Scholar]
- Hughes CC, Hunter JM. Disease and “development” in Africa. Social Science & Medicine (1982) 1970;3(4):443–493. doi: 10.1016/0037-7856(70)90022-3. [DOI] [PubMed] [Google Scholar]
- Hunter JM. Inherited burden of disease: agricultural dams and the persistence of bloody urine (Schistosomiasis hematobium) in the Upper East Region of Ghana, 1959–1997. Social Science & Medicine (1982) 2003;56(2):219–234. doi: 10.1016/s0277-9536(02)00021-7. [DOI] [PubMed] [Google Scholar]
- Hunter JM, Rey L, Scott D. Man-made lakes and man-made diseases. Towards a policy resolution. Social Science & Medicine (1982) 1982;16(11):1127–1145. doi: 10.1016/0277-9536(82)90115-0. [DOI] [PubMed] [Google Scholar]
- Huq A, Sack RB, Nizam A, Longini IM, Nair GB, Ali A, Morris, Glenn J, Huda Khan MN, Siddique AK, Yunus M, Albert MJ, Sack DA, Colwell RR. Critical factors influencing the occurrence of Vibrio cholerae in the environment of Bangladesh. Applied and Environmental Microbiology. 2005;71(8):4645–4654. doi: 10.1128/AEM.71.8.4645-4654.2005. [DOI] [PMC free article] [PubMed] [Google Scholar]
- Keiser J, De Castro MC, Maltese MF, Bos R, Tanner M, Singer BH, Utzinger J. Effect of irrigation and large dams on the burden of malaria on a global and regional scale. The American Journal of Tropical Medicine and Hygiene. 2005;72(4):392–406. [PubMed] [Google Scholar]
- Kulldorff M Information Management Systems (IMS) SaTScan™7.0: Software for the spatial and space-time scan statistics 2006 [Google Scholar]
- Kulldorff M. A spatial scan statistic. Communications in Statistics: Theory and Methods. 1997;26(6):1481–1496. [Google Scholar]
- Kulldorff M, Nagarwalla N. Spatial disease clusters: detection and inference. Statistics in Medicine. 1995;14(8):799–810. doi: 10.1002/sim.4780140809. [DOI] [PubMed] [Google Scholar]
- Longini IM, Jr, Yunus M, Zaman K, Siddique AK, Sack RB, Nizam A. Epidemic and endemic cholera trends over a 33-year period in Bangladesh. The Journal of Infectious Diseases. 2002;186(2):246–251. doi: 10.1086/341206. [DOI] [PubMed] [Google Scholar]
- Myaux J, Ali M, Felsenstein A, Chakraborty J, de Francisco A. Spatial distribution of watery diarrhoea in children: identification of “risk areas” in a rural community in Bangladesh. Health & Place. 1997;3(3):181–186. doi: 10.1016/s1353-8292(97)00013-0. [DOI] [PubMed] [Google Scholar]
- Polack SR, Solomon AW, Alexander ND, Massae PA, Safari S, Shao JF, Foster A, Mabey DC. The household distribution of trachoma in a Tanzanian village: an application of GIS to the study of trachoma. Transactions of the Royal Society of Tropical Medicine and Hygiene. 2005;99(3):218–225. doi: 10.1016/j.trstmh.2004.06.010. [DOI] [PMC free article] [PubMed] [Google Scholar]
- Singh N, Mehra RK, Sharma VP. Malaria and the Narmada-river development in India: a case study of the Bargi Dam. Annals of Tropical Medicine and Parasitology. 1999;93(5):477–488. doi: 10.1080/00034989958212. [DOI] [PubMed] [Google Scholar]
- Song C, Kulldorff M. Power evaluation of disease clustering tests. International Journal of Health Geographics. 2003;2(1):9. doi: 10.1186/1476-072X-2-9. [DOI] [PMC free article] [PubMed] [Google Scholar]
- Sow S, de Vlas SJ, Engels D, Gryseels B. Water-related disease patterns before and after the construction of the Diama Dam in northern Senegal. Annals of Tropical Medicine and Parasitology. 2002;96(6):575–586. doi: 10.1179/000349802125001636. [DOI] [PubMed] [Google Scholar]
- Waddy BB. Research into the health problems of manmade lakes, with special reference to Africa. Transactions of the Royal Society of Tropical Medicine and Hygiene. 1975;69(1):39–50. doi: 10.1016/0035-9203(75)90009-7. [DOI] [PubMed] [Google Scholar]


