

Abstract
Rationale and Objectives
Noninvasive molecular imaging of glioma tumor receptor activity was assessed with diagnostic in vivo fluorescence monitoring during targeted therapy. The study goals were to assess the range of use for treatment monitoring and stratification of tumor types using EGFR status with administration of fluorescently labeled epidermal growth factor (EGF), and determine its utility for tumor detection compared to magnetic resonance imaging (MRI).
Materials and Methods
Epidermal growth factor receptor positive and negative (EGFR+ and EGFR−) glioma tumor lines (U251-GFP and 9L-GFP, respectively) were used to assess these goals, having a 20-fold difference between their EGF uptakes.
Results
Treatment with cetuximab, in the EGFR+ tumor-bearing animals led to decreased EGF tumor uptake, whereas for the EGFR− tumors no change in fluorescence signal followed treatment. This diagnostic difference in EGFR expression could be used to stratify the tumor-bearing animals into groups of potential responders and non-responders, and receiver operator characteristic (ROC) analysis revealed an area under the curve (AUC) of 0.92 in separating these tumors. The non-localized growth pattern of U251-GFP tumors resulted in detection difficulty via standard MRI, however high EGFR expression made them detectable through fluorescence imaging (ROC-AUC = 1.0). The EGFR+, U251-GFP tumor-bearing animals could be noninvasively stratified into treated and untreated groups based on fluorescence intensity difference (p = 0.035, ROC-AUC = 0.90).
Conclusions
EGFR expression was tracked in vivo with fluorescence, and determined to be of use for stratification of EGFR+ and EGFR− tumors, detection of EGFR+ tumors and monitoring of molecular therapy.
Keywords: EGFR, Glioma, Spectroscopy, MRI, Cetuximab
Introduction
While malignant gliomas account for a small percentage of cancers diagnosed, they have proven to be some of the least responsive to aggressive therapies, including surgical resection, radiation therapy and temozolomide chemotherapy 1. As a result, average patient survival from date of diagnosis is in the range of 9 – 12 months 2 and morbidity rates approach 100%. Given the poor performance of conventional therapies, new treatment approaches are necessary. Glioblastoma mulitiforme (GBM) has a defined set of ‘molecular lesions’ as well as identified disruptions in signaling pathways and therefore may respond more readily to newly developed targeted therapies 3. One such target is epidermal growth factor receptor (EGFR) which is overexpressed in 40 – 50% of all GBMs 3, 4. Overexpression of EGFR appears to be correlated with glioma grade and an unfavorable prognostic relationship has been shown between EGFR amplification and overall GBM patient survival 5. Part of the difficulty in development and testing of targeted therapies is the need to track biomarkers and surrogate measures of response to therapy in individual subjects. In particular, molecular expression is known to increase or decrease significantly in response to therapy, and the ability to track expression during courses of therapy may become critically important. In this study, a novel optical method is considered to monitor targeted therapy diagnostically in vivo.
Overexpression of EGFR in glioblastoma multiforme as well as many other types of cancer has been shown to promote development and progression of malignancy given its association with cellular proliferation, angiogenesis, metastasis and apoptosis inhibition 6. Anti-EGFR monoclonal antibodies target the extracellular domain of the receptor and have been shown to successfully block its activation 7. The IMC-C225/cetuximab antibody has been commercially developed by ImClone, and is in clinical trials for several cancer types. Clinical trials for GBMs are still in their preliminary stages although preclinical data suggested that systemic cetuximab treatment decreased proliferation and increased apoptosis in xenograft models of GBM grown both subcutaneously and orthotopically, when the cell line overexpressed EGFR 8, 9. The ability to noninvasively track monoclonal antibody binding, tumor response and EGFR expression in situ would have considerable value if it could be performed reliably with high sensitivity. Tumor tissues changes at the molecular level occur prior to any detectable tumor size changes, thus the ability to dynamically and quantitatively assess and track the molecular profile in vivo could provide substantial patient benefit. Additionally there is good evidence to support the fact that signaling pathways change in response to receptor blocking therapy 10, and so having the ability to track dynamic changes could significantly improve the potential of developing multi-receptor targeting approaches.
In the current study, cetuximab was used as a monotherapy to treat two types of tumors, an ‘EGFR positive expression model’ (EGFR+) with high EGF uptake and an ‘EGFR negative expression model’ (EGFR−) with low EGF uptake. The EGFR+ model was expected to respond to cetuximab therapy, while the EGFR− model was expected to be largely unaffected by cetuximab therapy. The goal of this molecular imaging study was three-fold; first, to determine whether EGF uptake could be used for tumor detection in vivo, using fluorescently labeled EGF to detect EGFR+ tumors. Second, to determine whether noninvasive detection of fluorescently labeled EGF could be used as a metric to guide treatment decision making through its ability to assess EGFR status of a tumor. The ability to noninvasively detect high EGF uptake in vivo would allow tumors to be stratified into groups that would potentially respond to cetuximab therapy and groups that would likely not benefit from the treatment. Third, to assess the utility of fluorescently labeled EGF to track treatment efficacy of EGFR targeted cetuximab therapy.
Materials & Methods
Cell Culture & Brain Tumor Model
Two brain tumor cell lines, both transfected with green fluorescent protein (GFP), were used for in vitro and in vivo experiments; the rat gliosarcoma (9L-GFP) and the human glioma (U251-GFP). The 9L-GFP cell line was a gift from Dr. Bogdanov 11. The cells were cultured in Dulbecco's Modification of Eagle's Medium (DMEM) supplemented with 10% fetal bovine serum (FBS) and 1% penicillin/streptomycin from a stock solution of 10,000 IU penicillin and 10,000 μg/ml streptomycin (Mediatech, Inc., Herndon, VA). All cells were incubated at 37° Celsius in a 95% air and 5% carbon dioxide humidified environment.
Both cell lines were used for orthotopic brain tumor implantation, explained briefly as follows. Male nude mice, about six weeks in age were anesthetized with a ketamine/xylazine mixture administered intraperitoneally (IP) in a 90:10 mg/kg ratio. A small incision was made in the scalp exposing the landmarks on the skull. A 1 mm dremel drill was used to create a hole 2 mm behind the bregma and 2 mm to the left of the midline. 1 × 10⁶ cells were implanted stereotactically 2 mm deep in the brain in 10 μl of phosphate buffered saline (PBS) using a Hamilton syringe. The cells were injected over a 5-minute period, after which the needle was slowly retracted from the brain. Bone wax (Ethicon Inc., Piscataway, NJ) was used to close the hole in the skull while the incision in the scalp was closed using Vetbond (J.A. Webster, Inc., Sterling, MA). Mice were examined daily to ensure proper healing of the scalp. All control mice were implanted with 10 μl of PBS without cells to mimic the surgical procedures performed on the tumor-bearing mice.
Both the 9L-GFP and U251-GFP cell lines grew in 100% of the tumor implanted mice. The growth patterns of the two lines were vastly different where the 9L-GFP tumors grew as large masses of tumor displacing the normal brain while the U251-GFP tumors grew as small pockets of tumor infiltrated into the normal brain. Even with these very different growth patterns, tumor implanted animals had similar life expectancy following tumor implantation of around 30 days. Thus, the clinical outcome of these tumor types was quite similar although they modeled different brain tumor types.
In Vitro Fluorescence Monitoring of Cetuximab
The two cell lines were compared in vitro for epidermal growth factor (EGF) uptake with and without cetuximab (Erbitux®, ImClone, Bristol-Myers Squibb Co, Princeton, NJ) administration. EGF uptake was assessed by measuring the fluorescence intensity of EGF bound Alexa Fluor 647 (EGF-AF647) (Invitrogen – Molecular Probes, Carlsbad, CA). The fluorescence was measured via a FACScan flow cytometer (Becton Dickinson, San Jose, CA) using a 633 nm laser for excitation and a 661/16 nm band pass filter to collected the emission. Cells were plated in triplicate at 5 × 10⁴ in 6-well plates. EGF uptake was measured for untreated cells and cells that had been treated with 0.01, 0.1, 1, 10 and 100 μg/ml cetuximab. Cetuximab was applied for 12, 24, 48 or 72 hours prior to the administration of EGF-AF647. Following the appropriate incubation time with cetuximab, 5 μg/ml EGF-AF647 was incubated with each sample for 30 minutes prior to preparation for fluorescence quantification via flow cytometry. The EGF-AF647 dye containing media was removed from the cells and the culture dish was washed once with PBS prior to trypsinization. The trypsin was diluted with PBS and the cells were centrifuged at 1000 g (Jouan Centrifuge, Model C312) for 5 minutes after which the supernatant was removed and the cells were resuspended in 500 μl of PBS for measurement via flow cytometry.
Multichannel Transmission Fluorescence Spectroscopy
The multichannel transmission spectroscopy system has been described in detail previously 12. Briefly, the system consisted of sixteen Acton research Insight spectrometers (Acton Research, Acton MA). Sixteen spectroscopy fiber bundles ran from the tissue surface to the spectrometer input units. A 690 nm laser source was coupled into a bifurcated branch of any one of the spectroscopy bundles via a precision rotary stage (Velmex, Bloomfield, NY). In this study, only eight channels of the system were used and as such, eight fibers encircled the head of the mouse in a coronal plane (Figure 1(A)) held in place by a custom designed mouse positioning system. Each fiber was illuminated sequentially while the other seven fibers acted as transmission-spectroscopic detectors, yielding a total of 56 measurements for a given subject. Fluorescence emission was filtered with a 720 nm long pass (LP) filter before entering the spectrograph. Excitation intensities for each source-detector pair were also recorded using the CCD after being filtered with neutral density filters of optical density = 2. The excitation measurements were used to normalize the fluorescence emission data.
Figure 1.
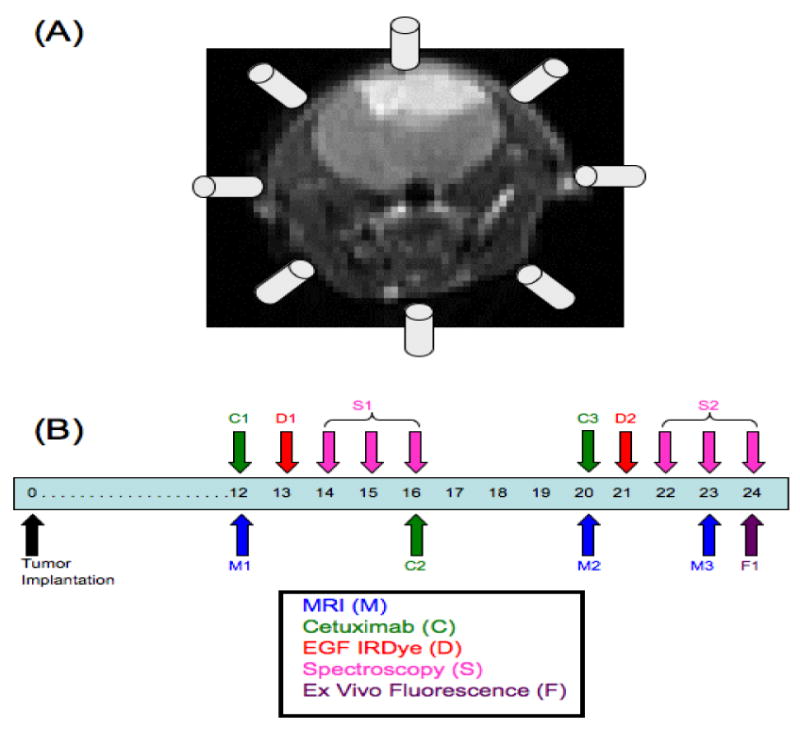
(A) Eight of the sixteen available channels from the multichannel transmission spectroscopy system were used to encircle the head of the mouse in a coronal plane during measurement collection. The in vivo experimental timeline is shown in (B) where the experiment began with tumor implantation on day 0. Each mouse in the study received MRI (M), EGF-IRDye (D) and fluorescence spectroscopy monitoring (S) on the days shown. Only mice in the treated groups received cetuximab therapy (C) on the days shown.
The targeted fluorophore used in this study was epidermal growth factor (EGF) conjugated IRDye 800CW (EGF-IRDye) (LI-COR Biosciences, Lincoln, NE). The fluorescence peak was processed using a spectral fitting routine described elsewhere 12 to extract the excitation and auto-fluorescence contamination. After being integrated, the fluorescence intensity value was normalized to the excitation intensity to account for positional differences between measurements of a single mouse and optical property variations 13.
Spectral Data Post-Processing
After completion of the spectral fitting and normalization to the excitation, the fluorescence to transmittance ratio was obtained for each mouse at the 56 measurement points. The fluorescence to transmittance ratio at each measurement point was then normalized to the average of the non-tumor-bearing control group (n = 8) at each measurement point. This normalization was calculated as: (I(EGF) – I(Ctrl))/I(Ctrl) where I(EGF) represented the EGF-IRDye fluorescence to transmittance ratio intensity of the individual animal and I(Ctrl) represented the EGF-IRDye fluorescence to transmittance ratio intensity of the average control mouse. This produced 56 normalized measurements points from around the mouse head, which were then averaged into a single number to allow for direct comparison of animals within groups.
MRI of Murine Brain Tumors
Magnetic resonance imaging (MRI) was completed using a Philips 3T Achieva MRI scanner, with a research rodent coil insert designed specifically for imaging mice and rats. A plastic insert was used to ensure the mouse was at the isocenter of the RF coil. T1 turbo spin echo (TSE) (slice thickness = 0.75 mm, slice number = 18, TR = 434 ms, TE = 9.7 ms, matrix size = 256 × 256, signal average = 2) contrast enhanced (CE) with gadolinium DTPA and T2 TSE (slice thickness = 0.75 mm, slice number = 18, TR = 3000 ms, TE = 80 ms, matrix size = 256 × 256, signal average = 3) sequences were routinely used to visualize brain structure and vascular changes due to tumor growth. T2 fluid attenuated inversion recovery (FLAIR) (slice thickness = 0.75 mm, slice number = 18, TR = 11,000 ms, TE = 120 ms, matrix size = 576 × 576, signal average = 1), T1 fast field echo (FFE) (slice thickness = 0.75 mm, slice number = 18, TR = 182 ms, TE = 4.6 ms, matrix size = 256 × 256, signal average = 3) and T1 inversion recovery (IR) (slice thickness = 0.75 mm, slice number = 18, TR = 2500 ms, TE = 15 ms, matrix size = 256 × 256, signal average = 1, inversion time = 400 ms) sequences were adapted from standard sequences and used to provide additional contrast for brain tumors that were difficult to visualize using standard T1 TSE CE and T2 TSE sequences. T1 TSE images were also collected before and after the administration of gadolinium DTPA without moving the mouse to allow for T1 difference images to be calculated.
In Vivo Fluorescence Monitoring of Cetuximab
Cetuximab treated and untreated groups of intracranially implanted 9L-GFP (n = 8 treated, n = 9 untreated) and U251-GFP (n = 8 treated, n = 8 untreated) mice were compared to cetuximab treated and untreated sham surgery control mice (n = 4 treated, n = 4 untreated). Following tumor implantation on day 0, the mice were examined for tumor presence via MRI on day 12 of the experiment (Figure 1(B)). Mice bearing tumors from each cell line were randomly stratified into a cetuximab treated or untreated group and the first dose of cetuximab therapy (1 mg/mouse) was administered IP following MR imaging 8, 9, 14-16. EGF-IRDye was administered intravenously (IV) at a concentration of 1 nmole 17 to the treated and untreated groups. The cetuximab therapy groups received their EGF-IRDye administration 12 hours after cetuximab therapy. Fluorescence measurements were obtained using the multichannel spectroscopy system 24, 48 and 72 hours following EGF-IRDye administration (Figure 1(B)). A second dose of cetuximab therapy was administered to the therapy groups following the 72 hour spectroscopy measurement on day 16 of the experiment to keep the animals' cetuximab plasma concentration constant 15. The EGF-IRDye was allowed to clear from systemic circulation between day 16 and 20 of the experiment. On day 20, a second set of MR images were collected and the third dose of cetuximab therapy was administered to the treated groups. The EGF-IRDye was again administered to all animals, 12 hours after cetuximab therapy in the treated groups. Fluorescence measurements were obtained using the multichannel spectroscopy system 24, 48 and 72 hours after EGF-IRDye administration (Figure 1(B)).
Ex Vivo Fluorescence Analysis
Following the 72 hour spectroscopy measurement (day 24), the mice were sacrificed, brains extracted and imaged on the Odyssey Infrared Imaging System (LI-COR Biosciences, Lincoln, NE) for ex vivo EGF-IRDye fluorescence quantification and on the Typhoon 9410 Variable Mode Imager (GE Healthcare Life Sciences) for GFP fluorescence. The 800 nm channel was used on the Odyssey Infrared Imaging system to detect EGF-IRDye fluorescence. GFP fluorescence was imaged using the Typhoon 9410 Variable Mode Imager with a 488 nm laser for excitation and a 526 nm short pass (SP) filter to collect the emission. The ex vivo tissue could be directly compared between EGF-IRDye and GFP fluorescence images since the tissue was in the same orientation when both images were obtained. All ex vivo brains were preserved in 10% formalin for routine pathology processing with H&E stain. The H&E slides were compared to ex vivo fluorescence images to confirm tumor presence.
Statistical Analysis
Differences between all groups were established through box and whisker plots and unpaired 2-tailed students-t tests to establish p-values for comparison of all groups of interest. All box and whisker plots shown illustrate the median as the centerline and the interquartile range as the box showing 75% of the data. The upper whisker represents Q3 + 1.5(Q3 - Q1) and the lower whisker represents Q1 - 1.5(Q3 - Q1), where Q is the quartile. Each open circle represents the normalized EGF-IRDye fluorescence to transmittance ratio of one animal.
The ability to quantify EGF-IRDye fluorescence spectroscopy as a method to stratify tumor groups based on EGFR status and monitor EGFR targeted therapy was assessed by receiver operator characteristic (ROC) analysis. Tumor detection by MRI and EGF-IRDye fluorescence spectroscopy was also compared through ROC analysis. The values for sensitivity and specificity were estimated based upon the number of true positives, false positives, true negatives and false negatives, where tumor status was confirmed through ex vivo analysis. Sensitivity was calculated as the number of true positive (TP) cases divided by the number of true positive and false negative (FN) cases (Sensitivity = TP/(TP + FN)). Specificity was calculated as the number of true negative cases (TN) divided by the number of true negative and false positive (FP) cases (Specificity = TN/(TN + FP)) 18.
ROC curves were constructed using different intensity threshold levels on the EGF-IRDye fluorescence to transmittance ratio collected from the control, 9L-GFP and U251-GFP tumor-bearing mice. For MR images, the tumor to normal tissue ratios were calculated for all 9L-GFP and U251-GFP tumor-bearing mice which were compared by using different intensity threshold levels to the ratios of the left hemisphere to right hemisphere intensity of the control mouse brains. As the intensity threshold was changed the true positive fraction (TPF) and false positive fraction (FPF) were calculated, where TPF is synonymous with sensitivity and FPF is representative of 1 minus the specificity of the tumor detection modality. The area under the curve (AUC) was calculated from the ROC curves and used as a direct measure of sensitivity and specificity of the multichannel transmission spectroscopy system for EGFR status stratification, treatment monitoring and detection as compared to MRI. An AUC of 1 would indicate that the modality had 100% sensitivity and specificity of detection while an AUC of 0.5 would indicate there was only 50% sensitivity and specificity, equivalent to random guessing of tumor status.
Results
In Vitro Fluorescence Monitoring of Cetuximab Therapy
An in vitro study was completed to determine if the difference in fluorescently labeled EGF uptake could be detected between cetuximab treated and untreated cells. When untreated, the U251-GFP cell line had approximately 20-fold higher EGF uptake than the 9L-GFP cell line and thus was considered EGFR+, while the 9L-GFP cell line was considered EGFR− (Figure 2). When the U251-GFP cell line was treated with varied concentrations of cetuximab therapy, vastly decreased fluorescence intensity was seen as compared to untreated cells (Figure 2(A)). In contrast, when the 9L-GFP cell line was treated with varied concentrations of cetuximab therapy little change in fluorescence intensity was seen even though administered drug concentrations ranged from 0.01 – 100 μg/ml (Figure 2(B)). Cetuximab was administered to the cells for 12, 24, 48 or 72 hours prior to incubation with EGF-AF647 to determine the time interval between treatment and fluorescent monitor administration, which created the largest fluorescence difference between treated and untreated cells. As shown in Figure 2, for the EGFR+ U251-GFP cells the largest fluorescence difference between treated and untreated cells was seen 12 hours after cetuximab administration for the lower, more physiologically relevant cetuximab concentrations 15. For the highest cetuximab concentrations, (10 and 100 μg/ml) little fluorescence difference was seen for the different incubation times. Since the largest fluorescence difference was seen after a 12-hour incubation time in vitro for physiologically relevant cetuximab doses, the EGF-IRDye was injected 12 hours after cetuximab therapy for all in vivo experiments.
Figure 2.
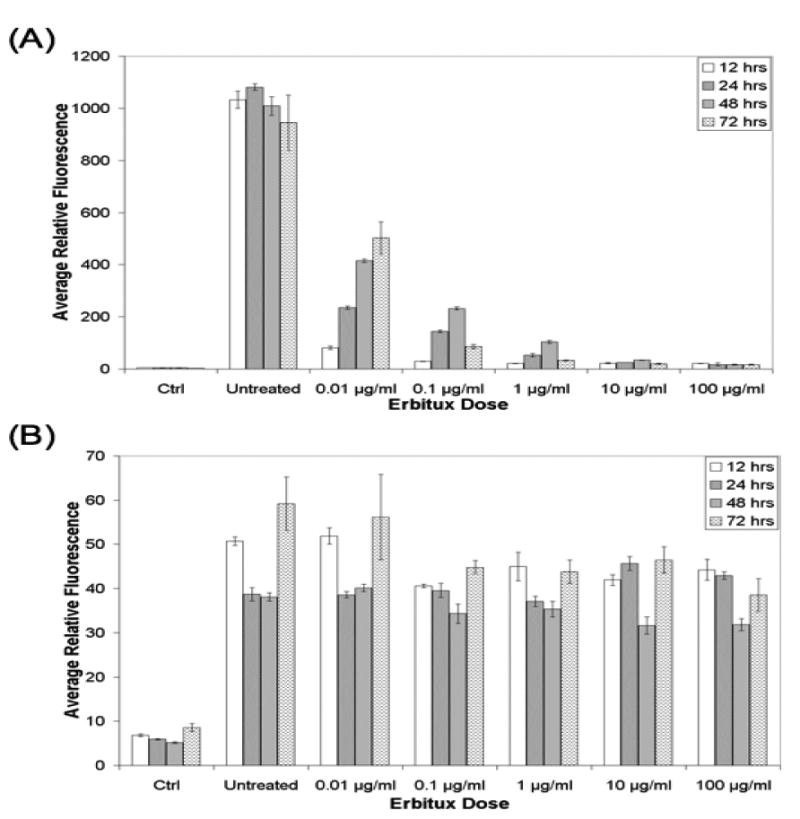
The EGF uptake of the (A) U251-GFP cells and (B) 9L-GFP cells as measured by EGF-AF647 fluorescence, following varied incubation time with difference concentrations of cetuximab. Ctrl indicated fluorescence for cells that were not incubated with EGF-AF647 to show the background signal at the excitation and emission wavelength used to measure the EGF-AF647 fluorescence. Untreated indicated the EGF-AF647 fluorescence signal from cells that were not treated with cetuximab therapy. Each bar represents the average of three samples and the error bars show the standard deviation of the mean.
Detection of EGFR+ and EGFR− Glioma with MRI and In Vivo Spectroscopy
MRI was performed on all mice to determine tumor status on days 12, 20 and 23 of the experiment (Figure 1(B)). MR imaging sequences used for tumor visualization included T1 turbo spin echo (TSE) with and without contrast enhancement to permit the calculation of difference images, T2 fluid attenuated inversion recovery (FLAIR), T1 fast field echo (FFE) and T1 inversion recovery (IR). Nearly all the mice in the 9L-GFP treated and untreated groups were detected with 100% sensitivity and specificity by all MRI sequences used for tumor detection (Table 1). In contrast, the U251-GFP treated and untreated tumors were very difficult to detect with MR imaging with an ROC-AUC of at best 0.85 to 0.88 for the treated and untreated groups, respectively. However due to their EGFR expression pattern, the U251-GFP tumors could be detected with 100% sensitivity and specificity by EGF-IRDye in vivo spectroscopy when untreated (Table 1).
Table 1.
ROC AUC analysis for MRI, EGF-IRDye in vivo spectroscopy and ex vivo measurements.
| 9L Tx vs. Ctrl | 9L NoTx vs. Ctrl | U251 Tx vs. Ctrl | U251 NoTx vs. Ctrl | 9L Tx vs. 9L NoTx | U251 Tx vs. U251 NoTx | 9L NoTx vs. U251 NoTx | |
|---|---|---|---|---|---|---|---|
| T1 + Gd | 1.00 | 1.00 | 0.50 | 0.54 | 0.57 | 0.50 | 0.96 |
| T2 FLAIR | 1.00 | 1.00 | 0.50 | 0.58 | 0.75 | 0.53 | 1.00 |
| T1 FFE | 1.00 | 0.94 | 0.75 | 0.88 | 0.69 | 0.70 | 0.75 |
| T1 IR | 1.00 | 1.00 | 0.85 | 0.83 | 1.00 | 0.60 | 1.00 |
| T1 Difference | 1.00 | 1.00 | 0.60 | 0.50 | 0.50 | 0.57 | 1.00 |
| W1, 24 hrs | 0.50 | 0.50 | 0.78 | 0.88 | 0.50 | 0.51 | 0.92 |
| W2, 24 hrs | 0.85 | 0.72 | 0.88 | 1.00 | 0.67 | 0.90 | 0.80 |
| Ex Vivo | 1.00 | 1.00 | 0.58 | 1.00 | 0.67 | 0.79 | 0.73 |
Noninvasive In Vivo Fluorescence Stratification of EGFR+ and EGFR− Glioma
Although spectroscopy measurements were collected at 24, 48 and 72 hours following EGF-IRDye administration, data analysis revealed that only the measurements collected 24 hours following EGF-IRDye administration showed significant fluorescence differences between groups due to the pharmacokinetic clearance of the systemically administered dye (LI-COR Biosciences Manufacturer's Instructions). Therefore, only the measurements collected on days 14 and 22 (Figure 1(B)) of the experiment were used to assess EGF uptake differences between the two tumor models. EGF-IRDye fluorescence of the U251-GFP tumor-bearing mice, both treated and untreated, was significantly higher than the control group on day 14 of the experiment (p-value = 0.003 for U251-GFP untreated, p-value = 0.037 for U251-GFP treated as compared to control) (Figure 3(A)). In contrast, the same analysis revealed that EGF-IRDye fluorescence of the 9L-GFP tumor-bearing mice was not significantly different from the control group (p-value = 0.86 for 9L-GFP treated, p-value = 0.87 for 9L-GFP untreated as compared to control) (Figure3 (A)). The U251-GFP untreated group also had significantly higher EGF-IRDye fluorescence than the 9L-GFP untreated group (p-value = 0.002). The fluorescence difference detected between the EGFR+ and EGFR− tumor-bearing animals could be used as a metric to noninvasively stratify tumors into groups that would potentially respond to cetuximab therapy and groups where cetuximab therapy would likely be ineffective based upon their EGFR status. Based on these results, a ROC curve was generated to determine the ability to noninvasively discern between EGFR+ and EGFR− tumors (Figure 3(B)), which resulted in an AUC = 0.92.
Figure 3.
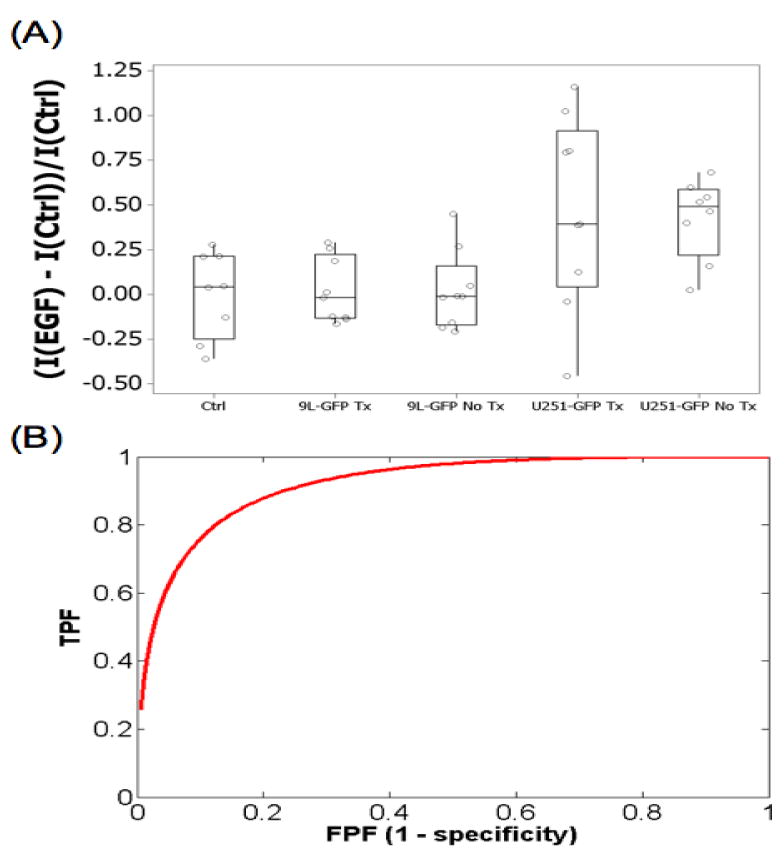
(A) The EGF-IRDye fluorescence on day 14 of the experiment for the treated and untreated U251-GFP and 9L-GFP groups as well as the control group. (B) Untreated EGFR+ U251-GFP and EGFR− 9L-GFP tumors could be stratified by ROC analysis with an AUC = 0.92.
Noninvasive Cetuximab Treatment Monitoring Using Fluorescently Labeled EGF
During the second set of spectroscopy measurements, 24 hours after EGF-IRDye administration (day 22), the fluorescence difference between the EGFR+ U251-GFP treated and untreated tumor-bearing mice was statistically significant (p-value = 0.035). As expected from in vitro studies, the U251-GFP untreated group had higher mean fluorescence than the treated group (Figure 4(A)). ROC analysis of the multichannel spectroscopy measurements as a method to stratify treated and untreated animals revealed an AUC = 0.90 (Table 1). The EGFR− 9L-GFP treated and untreated groups had very similar mean fluorescence 24 hours after EGF-IRDye administration (Figure 4(B)), which was not significantly different (p-value = 0.19). ROC analysis of the multichannel spectroscopy measurements as a method to stratify treated and untreated animals revealed an AUC = 0.67 (Table 1).
Figure 4.
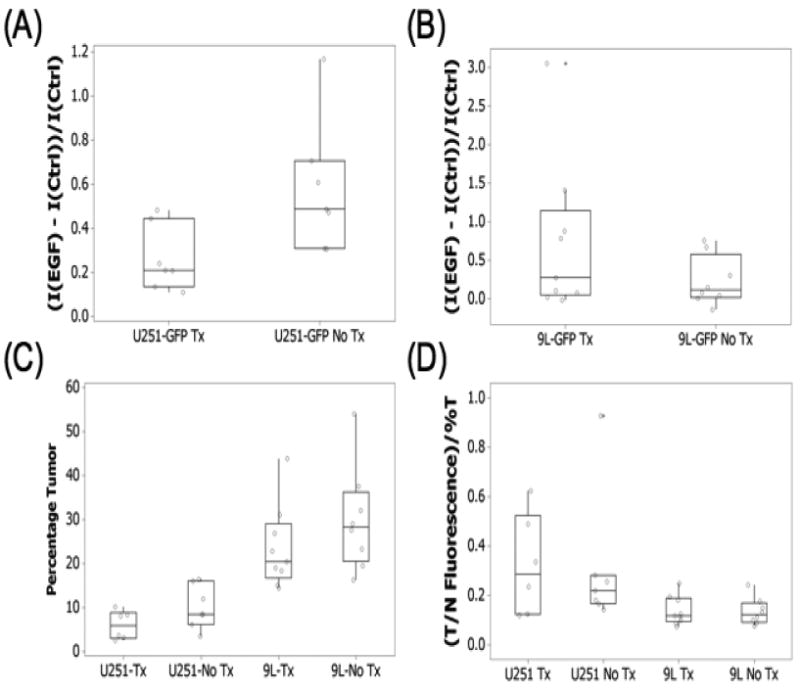
The EGF-IRDye fluorescence during the second week of the experiment, 24 hours after administration (day 22) for the treated and untreated (A) U251-GFP and (B) 9L-GFP tumor-bearing animals. The mice were sacrificed on day 24 of the experiment and their brains analyzed by (C) GFP fluorescence for tumor size, which is shown as a percentage of the brain and (D) EGF-IRDye fluorescence. The EGF-IRDye tumor to brain tissue fluorescence was normalized to the tumors size as determined by GFP fluorescence.
Ex Vivo EGF-IRDye Fluorescence Verification and Tumor Size Comparison
The ex vivo brain slices were examined for GFP fluorescence to confirm tumor presence and for EGF-IRDye fluorescence. These images were compared to corresponding H&E stained images. The GFP fluorescence and H&E stained images revealed that the U251-GFP (Figure 5) and 9L-GFP (Figure 6) tumors had very different in vivo growth patterns. The 9L-GFP tumors grew as large masses in the brain, which showed bright GFP fluorescence and dark purple staining by H&E (Figure 6). In contrast, the U251-GFP tumors showed a more diffuse growth pattern which, could be visualized without magnification by GFP fluorescence, although were difficult to visualized by H&E at 1× magnification (Figure 5). However, when the H&E stained slides were examined at higher magnification small areas of glioma cells were visible in the same region as that of the GFP fluorescence (data not shown). This difference in growth pattern between the U251-GFP and 9L-GFP gliomas resulted in a significant difference in size between the tumor types (p-value < 0.0001) (Figure 4(C)). The size difference was taken into account when analyzing the tumor EGF-IRDye fluorescence as shown in Figure 4(D). When the tumor to normal tissue ratio was normalized to the tumor size the U251-GFP tumors had significantly higher mean EGF-IRDye fluorescence than the 9L-GFP tumors (p-value = 0.02) (Figure 4(D)).
Figure 5.
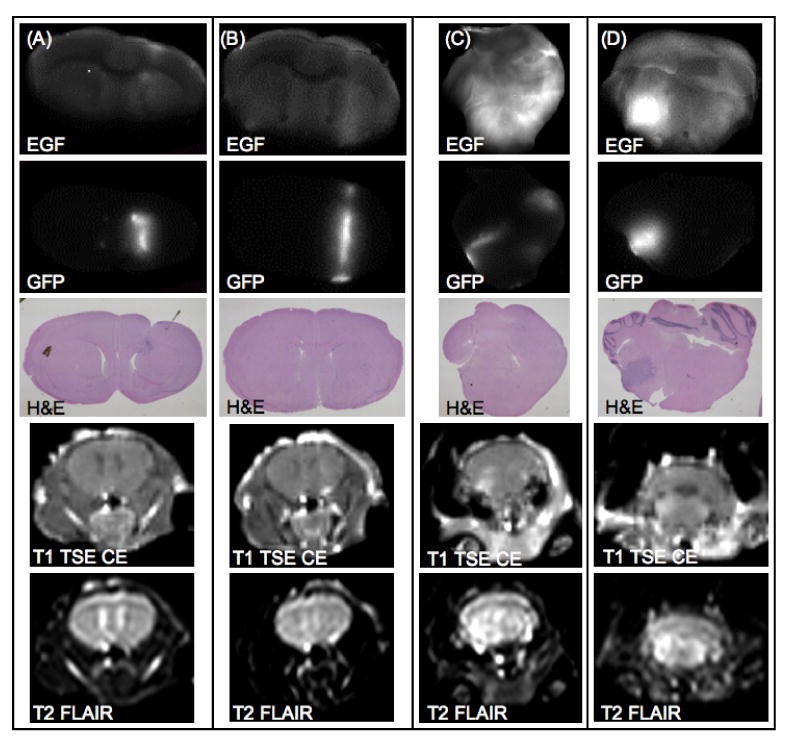
Ex vivo coronal images of representative examples from the U251-GFP tumor-bearing group are shown. Two example mice from the U251-GFP cetuximab treated group are shown in (A) and (B). Two example mice from the U251-GFP untreated group are shown in (C) and (D). EGF-IRDye fluorescence (row 1) was compared with GFP fluorescence (row 2) and H&E images (row 3) and demonstrated decreased fluorescence in the treated group as compared to the untreated group. Representative examples of in vivo MRI images showed that the U251-GFP tumors were difficult to detect using T1 TSE CE MRI (row 4) or T2 FLAIR MRI (row 5).
Figure 6.
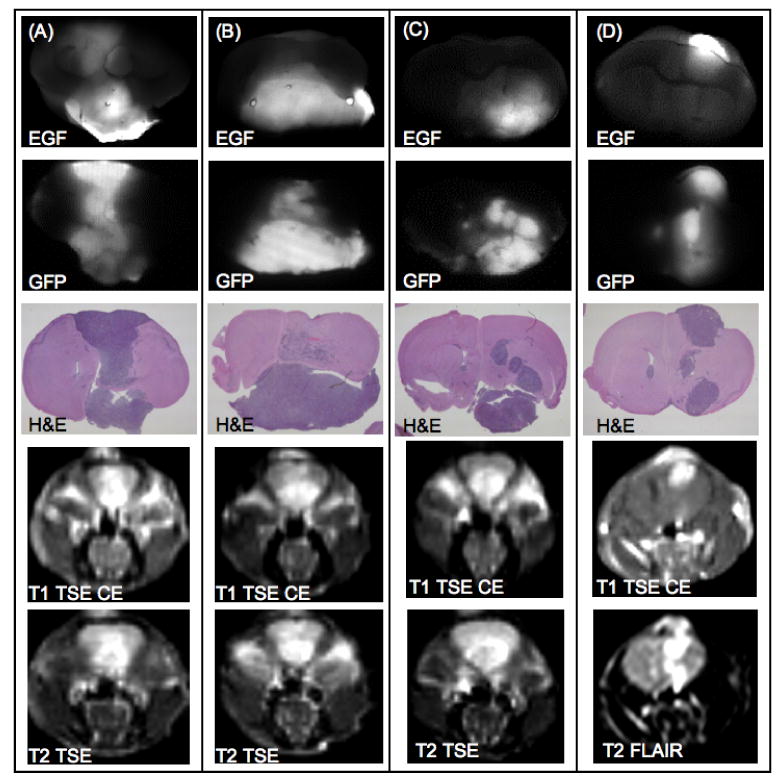
Ex vivo coronal images of representative examples from the 9L-GFP tumor-bearing group are shown. Two example mice from the 9L-GFP cetuximab treated group are shown in (A) and (B). Two example mice from the 9L-GFP untreated group are shown in (C) and (D). EGF-IRDye fluorescence (row 1) was compared with GFP fluorescence (row 2) and H&E images (row 3) and demonstrated heterogenous fluorescence within the tumor tissue that was similar for the treated and untreated tumors. Representative examples of in vivo MRI images showed visible tumor masses by T1 TSE CE MRI (row 4) or T2 TSE and T2 FLAIR MRI (row 5).
EGF-IRDye fluorescence was also examined ex vivo to determine the utility of the fluorophore for detection, EGFR stratification and cetuximab treatment monitoring. Both the treated and the untreated 9L-GFP tumor-bearing mice showed heterogeneous EGF-IRDye fluorescence that corresponded to tumor tissue as confirmed by GFP fluorescence and H&E stained images (Figure 6). When compared to control ex vivo brain tissue both the 9L-GFP treated and untreated tumors could be detected with 100% sensitivity and specificity (Table 1). No discernable difference in uptake of the fluorescently labeled EGF was noted between the 9L-GFP treated (Figure 6(A) and 6(B)) and 9L-GFP untreated animals (Figure 6(C) and 6(D)). ROC analysis revealed an AUC of 0.67 when the EGF-IRDye fluorescence of the 9L-GFP treated and untreated groups were compared ex vivo (Table 1).
A much different EGF-IRDye fluorescence pattern was noted in corresponding ex vivo image sets for the U251-GFP treated and untreated groups. Evaluation of the ex vivo EGF-IRDye fluorescence images in comparison to the GFP fluorescence and H&E images indicated that the U251-GFP treated animals had lower accumulation of EGF-IRDye (Figure 5(A) and 5(B)) as compared to the untreated group (Figure 5(C) and 5(D)). This fluorescence pattern affected tumor detection as compared to the control group, as the U251-GFP untreated group had an AUC of 1.0, while the U251-GFP treated group had an AUC of 0.58 by ROC analysis (Table 1). Interestingly, differentiating between the U251-GFP treated and untreated groups was more effective in vivo during the second week of measurements (AUC = 0.90) than ex vivo (AUC = 0.79).
Discussion
The U251-GFP cell line was used as the positive EGFR expression model while the 9L-GFP cell line was the negative EGFR control as it had 20-fold lower EGF uptake in vitro (Figure 2). The fluorescence signature of EGF uptake was monitored in vivo for both the EGFR+ and EGFR− models over the course of the therapy. The monoclonal antibody cetuximab, used in this study, binds to EGFR rendering it inactive, eliminating its ability to initiate signal transduction into the cell 19. Cetuximab competes with the ligands, EGF and TGFα for binding to EGFR with a 2-log higher affinity for the receptor 20 and cetuximab inhibits cell-cycle progression, angiogenesis and metastasis in cells and decreases tumor burden 21. Cetuximab therapy was administered to both groups of animals in order to track fluorescent EGF uptake changes associated with effective and ineffective therapy.
In vitro treatment monitoring experiments showed significant fluorescence decrease following cetuximab therapy of the U251-GFP cell line, while no fluorescence difference was seen between treated and untreated 9L-GFP cells (Figure 2). The time interval between administration of cetuximab and fluorescently labeled EGF that created the largest fluorescence difference in vitro was 12 hours, and so this time interval was used for in vivo treatment monitoring experiments (Figure 2(A)).
In vivo spectroscopy measurements were collected during two consecutive weeks, 24 hours after EGF-IRDye administration (days 14 and 22). During the first week of spectroscopy measurements the mean EGF-IRDye fluorescence of the EGFR− 9L-GFP tumors was not significantly different from the control group. According to ROC analysis, detection of the 9L-GFP tumors by EGF-IRDye spectroscopy was the same as random guessing of tumor status (AUC = 0.5 for 9L-GFP treated and untreated groups vs. control group, Table 1). In contrast, the EGFR+ line was significantly different from that of the control group (untreated p-value = 0.003 and treated p-value = 0.037). ROC analysis showed better detection of the EGFR+ untreated group (AUC = 0.88) as compared to the treated group (AUC = 0.78) as would be expected due to the availability of EGF binding sites. The U251-GFP untreated group also had significantly higher mean EGF-IRDye fluorescence as compared to the 9L-GFP untreated group (p-value = 0.002) (Figure 3(A)), which could be used for noninvasive stratification of tumors based on EGFR status (AUC = 0.92) (Figure 3(B)). As expected, at this time point, there was no ability to detect a difference between the 9L-GFP treated and untreated groups (AUC = 0.5, table 1). Similarly, there was little ability to detect a fluorescence difference between the U251-GFP treated and untreated groups (AUC = 0.51).
The fluorescence signature obtained during the second set of spectroscopy measurements, 24 hrs after EGF-IRDye administration showed noninvasive functional fluorescence spectroscopy could be used to monitor EGF uptake during cetuximab therapy. The mean fluorescence of the U251-GFP treated group was significantly lower than the untreated group (p-value = 0.035) due to decreased EGF-IRDye uptake by the cetuximab treated tumors (Figure 4(A)). ROC analysis revealed that the treated and untreated U251-GFP tumor bearing animals could be stratified into groups noninvasively with an AUC = 0.90, a vast improvement over measurements collected during the first week of spectroscopy measurements. As expected, the 9L-GFP EGFR− tumors did not have significantly different fluorescence intensity between the treated and untreated groups (AUC = 0.67, Table 1) (Figure 4(B)). This was in agreement with previously published studies which have shown that cetuximab therapy has not been effective on preclinical brain tumor models that do not overexpress EGFR 8, 9.
A confounding issue in this study was the difficulty of detection of the U251-GFP tumors by MRI. As shown in table 1, the 9L-GFP tumors were readily detectable by numerous MRI sequences with 100% sensitivity and specificity while the U251-GFP tumors could not be reliably detected by any of the MRI sequences used with ROC-AUC of at best 0.83 to 0.85 for the untreated and treated groups, respectively. Tumor presence for the U251-GFP groups could only reliably be confirmed ex vivo (Figure 5). Interestingly, due to the EGFR pattern of the U251-GFP tumors, they were detected more reliably by EGF-IRDye spectroscopy than by MRI (Table 1). The MRI detection difficulty could likely be attributed to significant differences in growth patterns of the two tumor types, where the 9L-GFP tumors grew as large masses (Figure 6) and the U251-GFP tumors grew as diffuse pockets of cells (Figure 5). This growth pattern difference also resulted in a significant size difference between the two tumor types, with the 9L-GFP treated and untreated groups significantly larger than the U251-GFP treated and untreated groups (p-value < 0.0001) (Figure 4(C)).
The difference in tumor size and growth pattern between the two tumor types also made the ex vivo EGF-IRDye fluorescence data more difficult to interpret. The large 9L-GFP tumors appear to have bright fluorescence whether treated or untreated (Figure 6), while the U251-GFP treated and untreated groups showed the expected pattern of fluorescence with the untreated group higher than that of the treated group (Figure 5). Thus, when the tumor to normal tissue ratio was examined ex vivo it appeared that the 9L-GFP tumors had higher fluorescence than the U251-GFP tumors. However, when the tumor to normal tissue fluorescence intensity was normalized to the tumor size the U251-GFP tumors showed higher fluorescence intensity (p-value = 0.02) (Figure 4(D)). Taking the tumor size (Figure 4(C)) and the ex vivo fluorescence intensity normalized to tumor size together (Figure 4(D)), it appears that the U251-GFP treated group had smaller tumor size than that of the untreated group and thus when the fluorescence was normalized to tumor size the U251-GFP treated group appeared to have the highest mean EGF-IRDye fluorescence intensity.
The importance of the growth pattern and size difference between the 9L-GFP and U251-GFP tumor types can best be interpreted by ROC analysis. The 9L-GFP and U251-GFP untreated groups were compared for detection by MRI and for in vivo and ex vivo EGF-IRDye fluorescence (Table 1). Differentiation between the 9L-GFP and U251-GFP groups using various MRI sequences showed relatively high sensitivity and specificity since the 9L-GFP tumors were readily detected by MRI while the U251-GFP tumors were not. However, this detection difference was not related to EGFR status, but rather to tumor to normal tissue ratio in contrast MRI. When the in vivo and ex vivo EGF-IRDye measurements were considered it was seen that as the 9L-GFP tumors increased in size the detected difference in fluorescence between the tumor types decreased in sensitivity and specificity (Week 1 AUC = 0.92, Week 2 AUC = 0.80, ex vivo AUC = 0.73).
Since each of the 9L-GFP cells had fewer EGFR receptors than the U251-GFP cells, it might be expected that EGF-IRDye fluorescence in U251-GFP tumors would show the highest intensity. However, due to the significant size difference between the tumors, higher overall EGF-IRDye signal was seen in the 9L-GFP tumors. This is likely not due to an increase in EGF receptors on each 9L-GFP tumor cell, but rather due to the exponential increase in 9L-GFP cells within the brain while by comparison the U251-GFP tumors cells within the brain were slowly increasing. Thus, EGF-IRDye tumor fluorescence is convolved with tumor volume which was increasing more rapidly in the EGFR− tumor type than in the EGFR+ tumor type.
Conclusions
This study demonstrated that a fluorescent probe could be used to detect EGFR+ tumors noninvasively, compared to non-tumor-bearing control mice with 100% sensitivity and specificity even when detection by MRI was not as accurate. It was shown that fluorescence spectroscopy could be used to stratify groups of EGFR+ and EGFR− tumors noninvasively prior to treatment, thus allowing knowledge of EGFR status prior to administration of treatment targeted to its overexpression. The functional information gained from noninvasive fluorescence spectroscopy also enabled EGF uptake to be assessed in both EGFR+ and EGFR− tumors during cetuximab therapy, where decreased fluorescence intensity corresponded to decreased EGF uptake, verified ex vivo.
Acknowledgments
Grant Support: This work was funded by NCI grants RO1CA109558 and PO1CA84203 as well as the Norris Cotton Cancer Center Shared Resources.
Footnotes
Publisher's Disclaimer: This is a PDF file of an unedited manuscript that has been accepted for publication. As a service to our customers we are providing this early version of the manuscript. The manuscript will undergo copyediting, typesetting, and review of the resulting proof before it is published in its final citable form. Please note that during the production process errors may be discovered which could affect the content, and all legal disclaimers that apply to the journal pertain.
References
- 1.Sathornsumetee S, Rich JN. New treatment strategies for malignant glioma. Expert Review of Anticancer Therapy. 2006;6(7):1087–104. doi: 10.1586/14737140.6.7.1087. [DOI] [PubMed] [Google Scholar]
- 2.Sathornsumetee S, Reardon DA, Desjardins A, Quinn JA, Vredenburgh JJ, Rich JN. Molecularly Targeted Therapy for Malignant Glioma. Cancer. 2007;110(1):13–24. doi: 10.1002/cncr.22741. [DOI] [PubMed] [Google Scholar]
- 3.Mischel PS, Cloughesy TF. Targeted Molecular Therapy of GBM. Brian Pathology. 2003;13(1):52–61. doi: 10.1111/j.1750-3639.2003.tb00006.x. [DOI] [PMC free article] [PubMed] [Google Scholar]
- 4.Krishnan S, Rao RD, James CD, Sarkaria JN. Combination of Epidermal Growth Factor Targeted Therapy with Radiation Therapy for Malignant Glioma. Frontiers in Biosceince. 2003;8:e1–13. doi: 10.2741/895. [DOI] [PubMed] [Google Scholar]
- 5.Halatsch ME, Schmidt U, Behnke-Mursch J, Unterberg A, Wirtz CR. Epidermal growth factor receptor inhibitors for the treatment of glioblastoma multiforme and other malignant brain tumors. Cancer Treatment Reviews. 2006;32:74–89. doi: 10.1016/j.ctrv.2006.01.003. [DOI] [PubMed] [Google Scholar]
- 6.Marshall J. Clinical Implications of the Mechanism of Epidermal Growth Factor Receptor Inhibitors. Cancer. 2006;107(6):1207–18. doi: 10.1002/cncr.22133. [DOI] [PubMed] [Google Scholar]
- 7.Harding J, Burtness B. CETUXIMAB: An epidermal growth factor receptor chimeric human-murine monoclonal antibody. Drugs of Today. 2005;41(2):107–27. doi: 10.1358/dot.2005.41.2.882662. [DOI] [PubMed] [Google Scholar]
- 8.Eller JL, Longo SL, Hicklin DJ, Canute GW. Activity of anti-epidermal growth factor receptor monocolonal antibody C225 against glioblastoma multiforme. Neurosurgery. 2002;51(4):1005–14. doi: 10.1097/00006123-200210000-00028. [DOI] [PubMed] [Google Scholar]
- 9.Eller JL, Longo SL, Kyle MM, Bassano D, Hicklin DJ, Canute GW. Anti-epidermal growth factor receptor monocolonal antibody cetuximab augments radiation effects in glioblastoma multiforme in vitro and in vivo. Neurosurgery. 2005;56:155–62. doi: 10.1227/01.neu.0000145865.25689.55. [DOI] [PubMed] [Google Scholar]
- 10.Sokolov K, Nida D, Descour M, Lacy A, Levy M, Hall B, et al. Molecular optical imaging of therapeutic targets of cancer. Advances in Cancer Research. 2007;96:299–344. doi: 10.1016/S0065-230X(06)96011-4. [DOI] [PubMed] [Google Scholar]
- 11.Moore A, Marecos E, Simonova M, Weissleder R, Bogdanov A. Novel gliosarcoma cell line expressing green fluorescent protein: a model for quantitative assessment of angiogenesis. Microvascular Research. 1998;56:145–53. doi: 10.1006/mvre.1998.2102. [DOI] [PubMed] [Google Scholar]
- 12.Davis SC, Pogue BW, Springett R, Leussler C, Mazurkewitz P, Tuttle SB, et al. Magnetic resonance-coupled fluorescence tomography scanner for molecular imaging of tissue. Review of Scientific Instruments. 2008;79(6):064302. doi: 10.1063/1.2919131. [DOI] [PMC free article] [PubMed] [Google Scholar]
- 13.Ntziachristos V, Turner G, Dunham J, Windsor S, Soubret A, Ripoll J, et al. Planar fluorescence imaging using normalized data. Journal of Biomedical Optics. 2005;10(6):064007-1–8. doi: 10.1117/1.2136148. [DOI] [PubMed] [Google Scholar]
- 14.Raben D, Helfrich B, Chan DC, Ciardiello F, Zhao L, Franklin W, et al. The effects of cetuximab alone and in combination with radiation and/or chemotherapy in lung cancer. Clinical Cancer Research. 2005;11:795–805. [PubMed] [Google Scholar]
- 15.Luo FR, Yang Z, Dong H, Camuso A, McGlinchey K, Fager K, et al. Correlation of pharmacokinetics with the antitumor activity of cetuximab in nude mice bearing the GEO human colon carcinoma xenograft. Cancer Chemotherapy and Pharmacology. 2005;56:455–64. doi: 10.1007/s00280-005-1022-3. [DOI] [PubMed] [Google Scholar]
- 16.Gauthier-Balin D, Delord JP, Rochaix P, Mallard V, Thomas F, Hennebelle I, et al. In vivo and in vitro antitumor activity of oxaliplatin in combination with cetuximab in human colorectal tumor cell lines expressing different levels of EGFR. Cancer Chemotherapy and Pharmacology. 2006;57:709–18. doi: 10.1007/s00280-005-0123-3. [DOI] [PubMed] [Google Scholar]
- 17.Kovar JL, Johnson MA, Volcheck WM, Chen J, Simpson MA. Hyaluronidase expression induces prostate tumor metastasis in an orthotopic mouse model. American Journal of Pathology. 2006;169(4):1415–26. doi: 10.2353/ajpath.2006.060324. [DOI] [PMC free article] [PubMed] [Google Scholar]
- 18.Pogue BW, Davis SC, Song X, Brooksby BA, Dehghani H, Paulsen KD. Image analysis methods for diffuse optical tomography. Journal of Biomedical Optics. 2006;11(3):033001-1–01-16. doi: 10.1117/1.2209908. [DOI] [PubMed] [Google Scholar]
- 19.Kim ES, Khuri FR, Herbst RS. Epidermal growth factor receptor biology (IMC-C225) Current Opinion in Oncology. 2001;13:506–13. doi: 10.1097/00001622-200111000-00014. [DOI] [PubMed] [Google Scholar]
- 20.Kim ES, Khuri FR, Herbst RS. Epidermal growth factor receptor biology (IMC-C225) Current Opinion in Oncology. 2001;13(6):506–13. doi: 10.1097/00001622-200111000-00014. [DOI] [PubMed] [Google Scholar]
- 21.Baselga J. The EGFR as a target for anticancer therapy - focus on cetuximab. European Journal of Cancer. 2001;37:S16–S22. doi: 10.1016/s0959-8049(01)00233-7. [DOI] [PubMed] [Google Scholar]