

Abstract
We report on the identification of a 0.3 Mb inherited recurrent but variable copy-number gain at Xq28 in affected males of four unrelated families with X-linked mental retardation (MR). All aberrations segregate with the disease in the families, and the carrier mothers show nonrandom X chromosome inactivation. Tiling Xq28-region-specific oligo array revealed that all aberrations start at the beginning of the low copy repeat LCR-K1, at position 153.20 Mb, and end just distal to LCR-L2, at 153.54 Mb. The copy-number gain always includes 18 annotated genes, of which RPL10, ATP6AP1 and GDI1 are highly expressed in brain. From these, GDI1 is the most likely candidate gene. Its copy number correlates with the severity of clinical features, because it is duplicated in one family with nonsyndromic moderate MR, is triplicated in males from two families with mild MR and additional features, and is present in five copies in a fourth family with a severe syndromic form of MR. Moreover, expression analysis revealed copy-number-dependent increased mRNA levels in affected patients compared to control individuals. Interestingly, analysis of the breakpoint regions suggests a recombination mechanism that involves two adjacent but different sets of low copy repeats. Taken together, our data strongly suggest that an increased expression of GDI1 results in impaired cognition in a dosage-dependent manner. Moreover, these data also imply that a copy-number gain of an individual gene present in the larger genomic aberration that leads to the severe MECP2 duplication syndrome can of itself result in a clinical phenotype as well.
Introduction
The general use of microarray-based comparative genome hybridization (array-CGH) has tremendously changed our view of the genome and especially its variability. Moreover, it is now well accepted that submicroscopic genomic imbalances are a major cause of developmental disorders due to copy-number changes of dosage-sensitive genes. On the X chromosome, a high incidence of causal microduplications was found, demonstrating that increased expression of tightly regulated genes can disturb normal cognitive development as well.1 The best known example is Pelizaeus-Merzbacher disease (PMD [MIM 312080]), caused by mutation in or deletions or duplications of the gene encoding proteolipid protein-1 (PLP1, [MIM 300401]) at Xq22. We previously described two novel nonrecurrent duplications on the X chromosome including HUWE1 (MIM 300697) or MECP2 (MIM 300005).2,3 As also observed for the PLP1 copy-number change, these aberrations have different breakpoints, precluding nonallelic homologous recombination (NAHR) because such an event results in recurrent aberrations of the same size and location. Therefore, replication-based recombination mechanisms at genomic regions with a presumed complex architecture were proposed as an explanation of the copy-number gains at the PLP1 and MECP2 loci.4–6 Copy-number gains almost always result in duplications although complex rearrangements resulting in triplications have been detected for the MECP2 and PLP1 loci as well.7,8 In these cases, the severity of the clinical features of these patients seems to correlate with the increased copy number.
Recurrent rearrangements are generally mediated by NAHR between flanking segmental duplications or low copy repeats (LCRs; genomic duplications of > 1 kb and > 90% identity), which result in deletions, duplications, amplifications, or inversions of the intermediate genomic segments.9 Several recurrent aberrations due to NAHR between two highly homologous repeat units have been described on the X chromosome, such as those at Xp22.3, which result in X-linked ichthyosis (MIM 308100),10 and those at Xq28, leading to incontinentia pigmenti (MIM 300248).11 Xq28 is of specific interest because it contains many sets of LCRs in close proximity to each other, which render this region prone to recombination that might lead to disease.4,7 In the nonrecurrent MECP2 duplication syndrome (MIM 300260), increased dosages of MeCP2 are most likely sufficient for the severe phenotype in these patients despite the presence of several other genes, including known mental retardation (MR)-related genes such as SLC6A8 (MIM 300036), L1CAM (MIM 308840), FLNA (MIM 300017), and GDI1 (MIM 300104).4 Therefore, a potential additive effect of increased dosages of one of the other duplicated genes is expected to be very small. Hence, these genes are thought not to be dosage sensitive.
Here, we present four unrelated MR families with an apparent complex copy-number gain of an identical 0.3 Mb region at Xq28, which harbors the MR-associated genes FLNA and GDI1 but not MECP2. Notably, the copy number of GDI1 perfectly correlates with the severity of the disease, which ranges from moderate nonsyndromic MR in a patient with a duplication of GDI1 to severe MR with epilepsy and brain anomalies in two brothers with five copies of GDI1.
For the recurrent aberration reported here, the breakpoints seem to be located within LCRs from two different classes, pointing to a peculiar NAHR mechanism that can occur at several other locations in the genome as well.
Subjects and Methods
Patients
The screening protocols were approved by the appropriate institutional review board of the university hospitals of Leuven (Belgium), Barcelona (Spain), Erlangen (Germany), and Freiburg (Germany), and informed consent was obtained from the parents of the affected patients. Genomic DNA from patients and from healthy controls was isolated from peripheral blood in accordance with standard procedures and was stored at 4°C.
Array-CGH and Quantitative PCR Analysis
Full-coverage X chromosome bacterial artificial chromosome (BAC) array-CGH was performed on DNA of the probands of families 1 and 2, essentially as described elsewhere.1,12 Cy5:Cy3 ratios for each clone were plotted in log2 scale relative to the position on the X chromosome. Clones with log2 ratios outside the −0.3 to 0.3 interval were considered aberrant. Full-coverage X chromosome BAC array-CGH on family 3 was performed as described previously.13 Finally, full-genome oligo-array-CGH on family 4 was performed with the use of premade 244K oligo arrays (Agilent Technologies, Palo Alto, CA, USA) spanning the entire genome, resulting in an average spacing of 12 kb. The hybridization was performed essentially as described elsewhere.14 Hybridization and feature extraction was performed as described elsewhere,15 and data were visualized by means of the CGHAnalytics 3.4 software (Agilent Technologies).
Confirmation, copy-number analysis, and initial delineation of the extent of the duplication were done by real-time quantitative polymerase chain reaction (qPCR) with the use of SYBRgreen on a LC480 apparatus (Roche, Basel, Switzerland). qPCR primers were designed with the LightCycler Probe Design2 software (Roche) and are given in Table S1, available online. Data were normalized against the PORCN (MIM 300651) locus at Xp11.23. All samples were run in duplicate, and data were analyzed with the instrument software and further analyzed in Excel via the comparative ddCt method (Sequence Detection System, bulletin no. 2; Applied Biosystems, Foster City, CA, USA). Screening for additional patients with a similar duplication in this region was performed by qPCR with the use of the primer pairs within the FLNA and GDI1 genes. Quantitation of the LCR sets (K1/K2 and L1/L2) was performed with LCR-specific primer pairs that recognize both members of each set.
Fine Mapping of the Copy-Number Gains at Xq28
Duplication mapping and exact copy-number analysis were performed in all four families. Differentially labeled patient versus male control DNA samples were hybridized onto a custom-designed 4 × 44K oligo array (Agilent Technologies) that covers the repeat-masked 152.70 Mb to 153.65 Mb region at tiling resolution. In addition, differentially labeled DNA from carrier mothers of families 2 and 4 were hybridized versus a female control sample to these custom arrays. Statistical data analysis was performed on the Cy3 and Cy5 intensities (g/rMeanSignal and g/rBGUsed), as provided by the Feature Extraction software, version 10.1. The log2 ratios were normalized with Loess normalization on the basis of the log ratios measured for the subset of clones within region between 152,765 kb and 152,865 kb on the X chromosome. Clones that were flagged by the Feature Extraction software as absent were omitted from subsequent analysis. Replicate clones were averaged, and unmapped clones were omitted from the analysis. Next, a heterogeneous Hidden Markov Model, BioHMM, was fitted on the log2 ratios and the corresponding clone information. Finally, the merging algorithm16 was applied for merging of segment levels if the distributions of the log ratios of the segments were not significantly different and if the difference of the two predicted level values were too close. Analysis was performed at the VIB Microarray Facility (Leuven, Belgium) in the R programming environment, in conjunction with the packages (a.o., snapCGH, and aCGH) developed within the Bioconductor project. All positions are based on the UCSC genome browser (NCBI build 36.1, Hg18, March 2006).
cDNA Expression Analysis by qPCR
Total RNA was extracted from white blood cells or Epstein Barr Virus–transformed peripheral-blood lymphocytes (EBV-PBLs) as described elsewhere.3 Real-time quantitation was performed with the SYBRgreen method on 50 ng of cDNA with cDNA-specific primers (Table S1) as described previously.3 The housekeeping genes GUSB (MIM 611499) and HPRT (MIM 308000) were used for normalization. Each 15 μl reaction well contained 0.5 μM of each primer and 1× SYBRgreen qPCR Master Mix (Roche). Reaction setup and data analysis were carried out as described above.
X Chromosome Inactivation
Lymphocyte-derived genomic DNA was subjected to the androgen-receptor gene (MIM 313700) methylation assay for assessment of the methylation status.17 A ROX-labeled genotyping marker, 100-500 (Applied Biosystems), was added, and the samples were separated on an ABI3130xl automated DNA sequencer (Applied Biosystems) and analyzed with the GeneMapper analysis software (Applied Biosystems) for peak-position and area-intensity calculations. Data were further processed in Excel.
Results
Clinical Description of the Families
Family 1 is of Belgian origin and consists of four affected males in two generations (Figure 1A). The index patient (IV.2) is a 6-year-old boy that came to our attention because of delayed psychomotor development, tiptoeing, and mild atactic gait. He was born after a normal pregnancy, occurring at term within normal parameters. He started to walk at the age of 21 months and had delayed speech development. Also, his fine motor skills are delayed. At clinical examination, he presented with mild facial asymmetry (Figure S1A). Growth parameters are within the normal range (length 113 cm [75th percentile], occipitofrontal circumference [OFC] 51 cm [50th percentile]). He has a nasal speech and mild articulation problems. There is a syndactyly of toes II and III bilaterally. His gait is mildly atactic, but there are no other cerebellar signs. Tendon reflexes in the lower legs are brisk, with clonus of both Achilles tendons and a positive Babinski sign. He has normal social interaction, and no behavioral problems have been reported. Cognitive evaluation via the Wechsler Preschool and Primary Scale of Intelligence showed a moderate mental retardation, with a total IQ of 50. MRI of the brain showed a mildly enlarged fourth ventricle. Karyotype and FMR1 mutation analysis was normal. Family history revealed the presence of several additional individuals with a similar phenotype. His maternal uncle, individual III.10, was born at term after a normal pregnancy. His psychomotor development was reported to be retarded, necessitating special schooling. Now, at the age of 37 yrs, he is moderate mentally retarded and lives and works on the farm of his healthy brother. On clinical examination, his OFC is 59 cm (> 97th percentile), with a high forehead, and his length is 170 cm (10th percentile). He has deep-set eyes, external strabismus of the right eye, and a prominent chin (Figure S1B). His speech is mildly dysarthric, and he also shows brisk tendon reflexes in the lower limbs and an inability to walk on his heels. He has a shy and quiet behavior. The two other affected males in the family, individuals III.16 and III.19, are brothers. The birth of the oldest brother, individual III.16, was traumatic. He developed a severe psychomotor delay, pronounced hemiplegia, deafness, and epilepsy. His younger brother, individual III.19, is moderately retarded and works in a sheltered work environment. At clinical examination, his length is 171 cm (10th percentile) and his OFC is 56 cm (75th percentile). He has a high forehead, deep-set eyes, alternating external strabismus (Figure S1C), and unclear speech. His thumbs are short, and there is cutaneous syndactyly of toes II and III bilaterally. His gait is stiff, but there are no signs of ataxia or spasticity in the lower limbs. He has a shy and friendly behavior. All carrier females in this family are asymptomatic.
Figure 1.
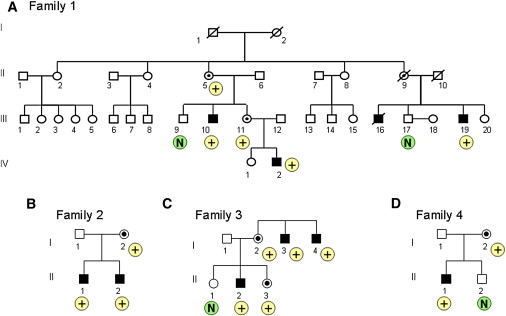
Pedigrees of Families with an Increased Copy Number at Xq28
(A) Family 1, (B) family 2, (C) family 3, and (D) family 4. The result of the qPCR with the GDI1 primer set is indicated below the individual as “N” in case of a normal copy number, and with “+” in case of an increased copy number.
Family 2 is of German origin and consists of two affected brothers (Figure 1B). The oldest brother (II.1) was born after a normal pregnancy and within normal birth parameters (length 53 cm, weight 3680 g, OFC 34 cm). At the age of 8 months, the parents remarked that he showed almost no interest in his environment and was still very floppy. An MRI of the brain was performed and showed a classical Dandy-Walker malformation, with cerebellar hypoplasia and agenesis of corpus callosum. He developed seizures at 15 months of age and responded well to antiepileptic treatment. Recent examination at the age of 3.5 years showed a severely delayed boy who does not sit or walk and says only two meaningful words. He had surgery for hip dysplasia and is susceptible to colds and infections. His height and weight are normal (length 100 cm [25th–50th percentile], weight 14 kg [10th percentile]), but he is microcephalic (OFC is 46 cm; < 3rd percentile). His ears are large, and he has upslanting palpebral fissures, epicanthic folds, and thin lips. Because of axial hypotonia, he has skull and thorax asymmetry. He has short toes and peripheral muscular hypertony. He also has nystagmus. The clinical history in his younger brother (II.2) is similar: He was born after a normal pregnancy and within normal parameters. He also has a Dandy-Walker malformation, with agenesis of the cerebellar vermis and hypoplasia of the corpus callosum, but has no epilepsy to date. He was diagnosed with mild unilateral renal reflux. At his last examination, at the age of 19 months, he crawled but could not sit alone and showed axial hypotonia and hypertonic extremities. His OFC is 41 cm (< 3rd percentile), and his weight is 8.5 kg (< 3rd percentile). He has facial features similar to those of his older brother. Both brothers have a normal karyotype. Mutations in FMR1 (MIM 309550), L1CAM (MIM 308840), and ARX (MIM 300382), as well as subtelomeric rearrangements, were excluded. Duplication of the MECP2 gene was excluded by MLPA. The mother has a normal phenotype.
Family 3 is of Spanish origin and was briefly reported as case 6 by Madrigal et al.13 The index patient (II.2) belongs to a family with three affected males (Figure 1C). He was born to nonconsanguineous parents at 8 months of a pregnancy complicated by an acute pancreatitis. Because of neonatal seizures and cyanotic crises, he stayed in neonatal intensive care for 10 days. Imaging of the brain showed ventricular dilatation and large asymmetric cisterna magna. His gross motor milestones were within the normal range. His speech development was delayed. At age 7, a clinical examination showed mild dysmorphism with microcephaly (OFC 49.5 cm [< 3rd percentile]), a high palate, medial eyebrow flare, and prominent ears. He showed psychomotor difficulties in the handling of objects, hyperkinetic behavior, and learning disabilities. He attended school with extra educational support and was diagnosed with mild MR, with an IQ of 58. Neurological examination was normal. At present, he is unemployed and lives at home. He speaks in short sentences. His younger sister also carries the triplication but has a normal phenotype. X chromosome inactivation analysis in the phenotypically normal carrier mother showed a 100% skewed inactivation. We have no clinical details on two maternal uncles (I.3 and I.4) who are institutionalized.
Patient 4 is a sporadic case of German origin, born to healthy, unrelated parents (Figure 1D). The family history is negative regarding MR and congenital anomalies. He was born at 38 wks of gestation after a normal pregnancy, within normal birth parameters (birth weight 3040 g, length 51 cm, OFC 33 cm). He was investigated because of mild global psychomotor delay, with sitting at 12 months and walking at 20 months. Now, at the age of 2 yrs, he has begun to speak some words. There is mild dysmorphism, with brachcephaly, broad forehead, hypotelorism, and epicanthus inversus that is more pronounced at the left side. He has a rather flat midface with a flat nasal root and a short philtrum. He has a high palate and a small chin. OFC is 48 cm (25th percentile) and length is 83 cm (10th percentile). Metabolic screening, electroencephalography, and hearing test results were all normal. Results of an ultrasound examination of the brain during the newborn period and a CT scan at 8 months were normal. Karyotype was normal, as was FMR1 analysis.
Array-CGH and qPCR Analysis
Cohybridization of DNA from proband IV.2 of family 1 (labeled with Cy5) and DNA from an unrelated male MR patient (labeled with Cy3) on our BAC X-array revealed a microduplication at Xq28 (Figure S2A) with three clones having log2-normalized Cy5/Cy3 intensity ratios that deviate significantly from the arbitrarily set “normal” interval of −0.3 to 0.3. These are clone CTD-2511C7 (ratio of 0.98) and the completely overlapping clones RP5-865E18 and RP5-1087L19 (ratios of 0.50 and 0.52, respectively). Clone RP11-103M23 had a ratio of 0.27, which is just within the normal interval, indicating that only part of it could be affected. The flanking clones with normal ratios were RP11-119A22 (ratio of 0.06) at the proximal side and RP11-115M6 (ratio of −0.05) at the distal side, indicating that the aberration has a maximal size of 0.5 Mb. Similarly, we found aberrant ratios for the same clones in the proband II.1 of family 2 by the same X-array (Figure S2B). However, the deviation from the normal interval was much bigger compared to that obtained for family 1. Ratios for clones CTD-2511C7, RP5-865E18, RP5-1087L19, and RP11-103M23 were 1.71, 1.27, 1.10, and 0.49, respectively, indicating that this region would be present more than two times in the genome. qPCR confirmed both aberrations in the probands with primer sets 10 to 13 (Table S1). Compared to controls, a copy-number difference of 2.78 (±0.43) was found for family 1, indicating a triplication, whereas for family 2, relative abundances of 4.80 (±1.17) were detected, strongly pointing to five copies of that region (Figure S3). Segregation analysis using the same qPCR primer set showed that both aberrations segregate with the disease because increased copy-number values were also found for the affected males III.10 and III.19 for family 1 and II.2 for family 2, whereas the unaffected males III.9 and III.17 for family 1 yielded values close to 1.0. As expected, the obligate carrier mothers (III.11 in family 1 and I.2 in family 2), but also the grandmother of the proband in family 1 (II.5), carry the aberration (data not shown).
In family 3, the aberration was detected as three deviating clones spanning about 0.3 Mb, with the use of a different X-array platform described elsewhere.13 The Cy5/Cy3 log2 ratio of these clones was 0.88 (±0.10), indicating an increase greater than two-fold although the ratios obtained from different platforms cannot be compared. However, when compared to controls, qPCR revealed a copy number of 3.21 (±0.28) (Figure S3). The aberration in family 4 was detected with a whole-genome oligo array. Elevated log2 ratios (0.93 ± 0.34) were obtained for 49 oligos (average spacing of 5.3 kb) within the region 153.21 Mb to 153.53 Mb. qPCR analysis confirmed the duplication because a relative copy number of 1.82 (±0.19) (Figure S3) was obtained in the proband of this family compared to control male samples. The mother also carries the aberration, as demonstrated by the qPCR value of 1.48 (data not shown). The location and extent of the aberrations are schematically illustrated in Figure 2A. Interestingly, a duplication of 190 kb within this aberrant region was detected with the latter oligo array in a female patient as well as her healthy father, demonstrating the polymorphic nature of this aberration. This normal copy-number variant covers the region 153,355,101 to 153,542,123 (striped bar in Figure 2A) with increased log2 ratios for 27 oligos (data not shown).
Figure 2.
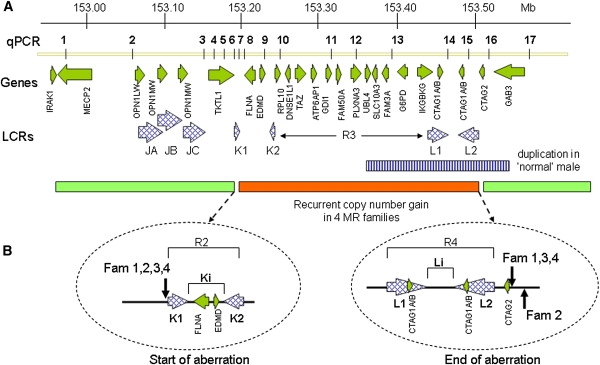
Schematic Representation of the Xq28 Region, 152.90–153.60 Mb, Showing the Recurrent Aberration Detected in Four Unrelated Families
(A) Indicated from top to bottom; the location of the qPCR primer pairs (1–17); annotated genes present in the interval; and the LCRs within the region. The amplified region is indicated at the bottom with the horizontal dark bar, which is flanked by the light bars with a normal copy number. The horizontal striped bar represents a copy-number polymorphism identified in a healthy male.
(B) Magnification of the start and end positions of the four aberrations. The vertical arrows point to the positions of these sites, demonstrating that they are located at the beginning of LCR K1 and at the end of LCR L2, respectively. The locations of the different regions (R2 to R4, Ki and Li), as referred to in the text, are shown as well.
The copy-number gain we identified in the four families was not found in 138 X chromosomes from controls, nor was it reported in the polymorphic database of genomic variants (DGV).
Precise Mapping of the Aberrations
For mapping and copy-number analysis of the aberrations, we performed custom oligo-array-CGH analysis on affected individuals of the four families and two carrier mothers (arrays and data are available at GEO with accession numbers GPL9083 and GSE17813, respectively). Variability for the LCRs JA, JB, and JC (region R1 in Figures 3 and 4) harboring the opsin gene cluster (MIM 303800) is evident from these arrays but is not further discussed here. For family 1, we independently hybridized patients III.19 and IV.2 and found identical data demonstrating the robustness of this assay. The aberration started at 153.218 Mb and finished at 153.535 Mb, yielding an aberration size of 317 kb. However, the copy number was not equal throughout this aberration. The region R2 (153.218 to 153.277 Mb), which includes the LCR set K1/K2 as well as the FLNA (MIM 300017) and EMD (MIM 300384) genes is present in two copies (mean ratio of 0.58) (Table S2) as schematically illustrated in Figure 3A. The same copy number (mean ratio of 0.63) was found for the region R4 (153.440 to 153.535 Mb) that includes the second LCR set L1/L2 with the CTAG1A/B (MIM 300156) and CTAG2 (MIM 300396) genes. Region R3 in between both LCR sets (153.277 to 153.440 Mb) was present in three copies (mean ratio of 0.97) (Table S2) and carries the genes RPL10 (MIM 312173), DNASE1L1 (MIM 300081), TAZ (MIM 300394), ATP6AP1 (MIM 300197), GDI1 (MIM 300104), FAM50A (MIM 300453), PLXNA3 (MIM 300022), LAGE3, UBL4A (MIM 312070), SLC10A3, FAM3A (MIM 300492), G6PD (MIM 305900), and IKBKG (MIM 300248) (Figure 3A). Family 2 (patient II.1) had a very similar profile except that the copy number for each subregion was different, i.e., three copies for R2 and R4 (mean ratio of 0.99 for 153.218 to 153.276, and 1.07 for 153.428 to 153.542 Mb) and five copies for R3 (mean ratio of 1.43) (Figure 3B). The same profile was obtained for his mother (I.2), although the ratios were smaller because of the presence of the normal X chromosome. In family 3 (patient II.2), the borders of the aberrant subregions as well as the mean ratios were almost the same as those obtained for family 1, revealing two copies for R2 (153.218 to 153.273 Mb; mean 0.76) and R4 (153.443 to 153.530 Mb; mean 0.82) (Figure 4A and Table S2) and three copies for the R3 region in between. Finally, in family 4 (patient II.1), the aberration was somewhat different in that R2 was present in two copies (mean 0.53), followed by three copies of only a 31 kb interval (R3': 153.277 to 153.308 Mb: mean 0.91) harboring the genes RPL10, DNASE1L1, and TAZ. The flanking telomeric region was duplicated again up to LCR L2 (R4': 153.308 to 153.535 Mb) (Figure 4B). The copy numbers of the different regions (R2 to R4) were confirmed by qPCR from at least two independent experiments (data not shown).
Figure 3.
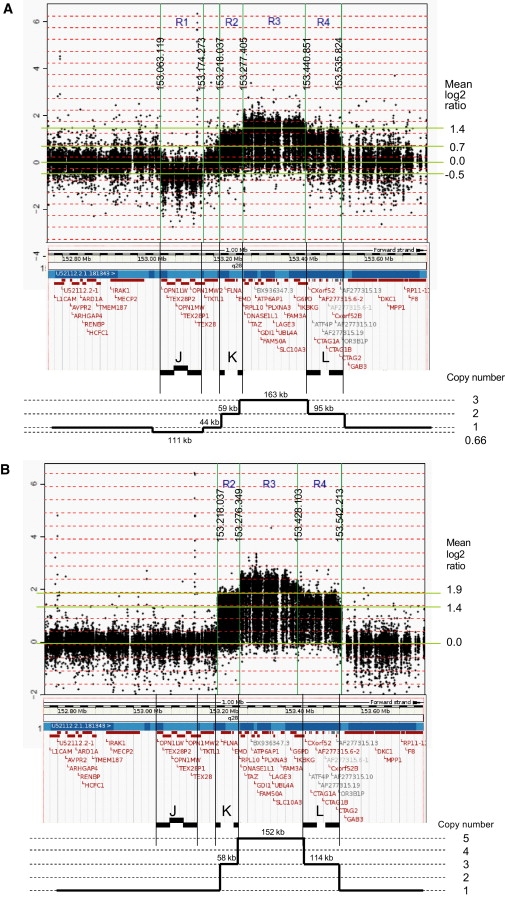
Custom 44K Oligo-Array-CGH Plots for Analysis of the Copy Numbers within the Region 152.70 Mb to 153.65 Mb at Xq28
(A) Patient IV.2 of family 1.
(B) Patient II.1 of family 2.
The borders of the copy-number-variable regions (R1 to R4) are indicated by vertical lines with the positions of the breakpoints shown. The mean log2 Cy5/Cy3 ratio (y axis) of each region is given at the right. Below each plot the Ensembl view of the corresponding region is shown with the LCR sets (J, K, L) indicated. At the bottom, we show a schematic representation of the copy number of each region, based on the array-CGH data.
Figure 4.
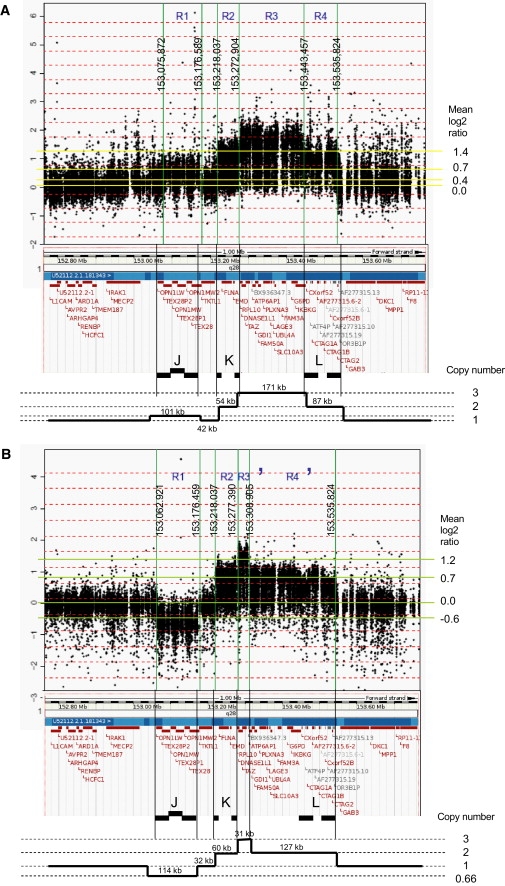
Custom 44K Oligo-Array-CGH Plots for Analysis of the Copy Numbers within the Region 152.70 Mb to 153.65 Mb at Xq28
(A) Patient II.2 of family 3.
(B) Patient II.1 of family 4.
The borders of the copy-number-variable regions (R1 to R4) are indicated by vertical lines with the positions of the breakpoints shown. The mean log2 Cy5/Cy3 ratio (y axis) of each region is given at the right. Below each plot the Ensembl view of the corresponding region is shown with the LCR sets (J, K, L) indicated. At the bottom, we show a schematic representation of the copy number of each region, based on the array-CGH data.
The aberrant region thus contains 18 annotated genes (Table 1). On the basis of the oligo-array data, FLNA and EMD are duplicated in families 1, 3, and 4 and thus present in two copies, whereas three copies are present in family 2. The genes RPL10, DNASE1L1, and TAZ are present in three copies in families 1, 3, and 4, whereas family 2 carries five copies. Finally, ATP6AP1, GDI1, FAM50A, PLXNA3, LAGE3, UBL4A, SLC10A3, FAM3A, G6PD, and IKBKG are present in two copies in family 4, three in families 1 and 3, and five in family 2.
Table 1.
Annotated Genes within the Recurrent Duplication at Xq28
| Start Position | End Position | Gene ID | Strand | MIM Numbera | Expression | Brain Levelsb |
|---|---|---|---|---|---|---|
| 153230091 | 153252845 | FLNA | - | 300017, 300049 | Ubiquitous | 101 |
| 153260981 | 153263075 | EMD | + | 310300 | Ubiquitous | 19 |
| 153279912 | 153283874 | RPL10 | + | Ubiquitous | 608 | |
| 153281816 | 153281950 | SNORA70 | + | nd | nd | |
| 153282773 | 153293621 | DNASE1L1 | - | Many | 11 | |
| 153293071 | 153303259 | TAZ | + | 300069,302060 | Ubiquitous | 23 |
| 153310172 | 153318056 | ATP6AP1 | + | Ubiquitous | 565 | |
| 153318715 | 153325008 | GDI1 | + | 300104 | Ubiquitous | 1642 |
| 153325702 | 153332190 | FAM50A | + | Many | 33 | |
| 153339817 | 153355179 | PLXNA3 | + | Many | 20 | |
| 153358435 | 153360790 | LAGE3 | - | Several | 14 | |
| 153365250 | 153368126 | UBL4A | - | Ubiquitous | 82 | |
| 153368842 | 153372189 | SLC10A3 | - | Many | 8 | |
| 153387700 | 153397567 | FAM3A | - | Many | 79 | |
| 153412800 | 153428981 | G6PD | - | 305900 | Ubiquitous | 57 |
| 153423653 | 153446455 | IKBKG | + | 308300 | Ubiquitous | 32 |
| 153466610 | 153468269 | CTAG1A | + | nd | nd | |
| 153499059 | 153500714 | CTAG1B | - | nd | nd | |
| 153533445 | 153535036 | CTAG2 | - | Few | 0 |
nd denotes no data.
MIM numbers are provided for associated clinical conditions.
Numbers based on Unigene (relative to 1,104,300 transcripts).
Of the genes within the aberrations, GDI1 shows highest expression in brain, and the expression levels of RPL10 and ATP6AP1 are relatively high according to Unigene and Genecards. Moderate brain mRNA levels were found for FLNA, UBL4A, and FAM3A, whereas all other genes had low to undetectable expression in brain tissue (Table 1). In situ hybridization in mouse brain showed strongest signals in the hippocampus for GDI1, RPL10, and ATP6AP1 (Allen mouse brain atlas). Taking into account the polymorphic variant identified in the normal male sample the genes within the aberrations that remain as prime candidate genes for a dosage-sensitive effect on brain development are FLNA, RPL10, ATP6AP1, and GDI1.
Bioinformatic Analysis of the Breakpoint Regions
On the basis of our high-resolution oligo-array mapping, all aberrations start at exactly the same position between oligomers located at 153,217,820 (normal ratio) and 153,218,037 bp (aberrant ratio), which coincides with the start of LCR K1 (Figure 2B). The end positions in the probands of families 1, 3, and 4 are located in between oligos at 153,535,824 (aberrant) and 153,535,842 bp (normal). For family 2, the end is located 7 kb more distal at 153,542,213 bp (last aberrant oligo), showing that all four distal breakpoints map just distal to LCR L2 and the CTAG2 gene (Figure 2B). Therefore, the size of this recurrent aberration is 317 kb in families 1, 3, and 4 and 324 kb in family 2. Most likely, the breakpoints are located within segmental duplications of two different LCR sets, with the proximal set K1/K2 and the distal set L1/L2. LCR K1 (153.218 to 153.229 Mb; direct orientation) is 11.3 kb in size and shows > 99.6% identity with its counterpart LCR K2 (153.266 to 153.277 Mb; indirect orientation), located 37 kb more telomeric (Figure 2). The 37 kb region in between this set of K-LCRs, which we will call Ki, harbors the FLNA and EMD genes. The distal breakpoint is located at the end of the 35.7 kb large LCR L2 (153.494 to 153.530 Mb; indirect orientation). L2 has > 99% identity with L1 (153.437 to 153.472 Mb; direct orientation), which is located 22 kb more centromeric. The “in between” region, called Li, does not harbor any genes. All four copy-number gains thus seem to be flanked by unrelated oppositely oriented LCRs (Figure 2). To investigate the possibility that the recombination occurred at the identified breakpoint regions, we aligned a 2 kb sequence surrounding the common proximal breakpoint region (centered at 153,217,930 bp) with a 2 kb region at the distal breakpoint region of families 1, 3, and 4 (centered at 153,535,833 bp) by using PipMaker. Homology was found for only one AluYf4 fragment in the proximal 2 kb sequence with three Alu repeats of different subclasses (AluSg, AluSp, and AluJo) in the distal sequence, but these repeats did not span the breakpoint regions. Next, the possibility of NAHR between the different LCR sets was investigated by the use of Pipmaker to align the sequences of K1/K2 with L1/L2. This alignment only revealed homology of short interspersed repeat elements (SINEs) of the Alu subfamily present at 8% in K1/K2 and 36% in L1/L2. These SINEs are scattered throughout the LCRs and could have induced a NAHR event.
Toward a Recombination Model
In order to postulate a recombination model for this recurrent rearrangement for which a variable copy number was obtained, we first hypothesized a simple (direct or indirect) tandem amplification event, which is found in most nonrecurrent duplication and amplification events. We designed primer pairs at both sides of the deduced breakpoint regions and performed long-range PCR with different primer combinations at either side of the presumed breakpoint regions as described elsewhere.4 We did not obtain unique PCR bands for the patients in comparison to controls, making this type of simple rearrangement unlikely. Next, we hypothesized an inversion at Xq28 with breakpoints in between or within the two sets of LCRs (Ki and Li) in a patient's ancestor. If so, the inversion would invert the orientation of a subunit of each LCR set, making the region prone to NAHR, which could result in a variable copy-number gain (schematically illustrated in Figure S4). To test this inversion hypothesis, we designed forward and reverse primers at several locations within the unique sequences of Ki and Li. Because we obtained PCR products of the correct sizes for all 5 to 6 kb subregions that span the entire normal (noninverted) sequence of both Ki and Li regions in our patients as well as in controls, we did not get any evidence for such an inversion. Moreover, long-range PCR on DNA from patients with several primer combinations, of which one primer was located in Ki and the other in Li, did not result in PCR products not found in controls (data not shown). Finally, this model implies that the copy number should be four in family 2, which does not fit our qPCR data. Therefore, we did not find any evidence for the inversion-driven rearrangement model. All our data thus indicate that NAHR between LCRs of the same class provides the most likely mechanism. However, this makes cloning of the junction breakpoints an impossible task because of the > 99% identity between the LCR subunits (K1 and K2, and L1 and L2) and the multiple possible NAHR-driven inversion events that could have taken place between the subunits of each set.
On the basis of the oligo-array data, the copy number of both R2 and R4 regions is two in families 1, 3, and 4, demonstrating that these regions are duplicated. The intervening region (R3 for families 1 and 3; R3' for family 4), however, has a copy number of three. In family 2, the copy numbers of R2 and R4 are three, whereas that of the intervening region R3 is five. These data are in agreement with NAHR, as schematically illustrated in Figure 5.
Figure 5.
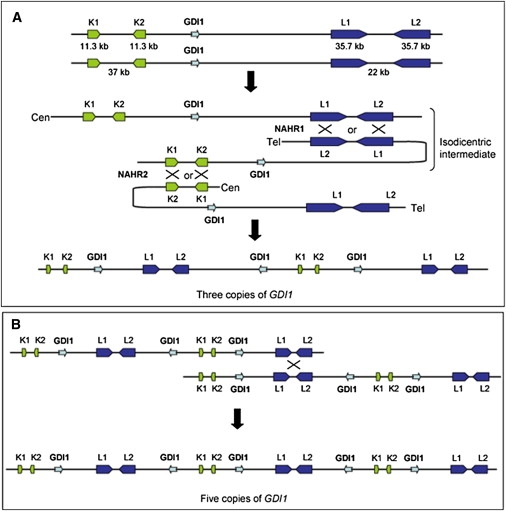
Recombination Model that Can Explain the Variable Copy-Number Gains at Xq28
(A) The model is based on two consecutive NAHR events in meiosis I. The first is between L1 and L2 on different chromatids directly followed by NAHR between K1 and K2, present on homologous chromatids.
(B) In family 2, the copy number was extended to five because of a third NAHR, most likely between sister chromatids in meiosis II.
Therefore, we propose a NAHR-driven model in which the triplication in families 1, 3, and 4 occurred between L1 and L2 on two different chromatids during meiosis I, yielding an isodicentric X chromatid intermediate, directly followed by a second NAHR event between K1 and K2 with a chromatid of the other homologous chromosome (Figure 5). This two-step mechanism results in two copies of R2 and R4 (and partially R4'), and three copies of the intervening R3 sequences (and R3'). For family 2, an additional NAHR event resulted in three copies of R2 and R4 and five copies of R3. This model is in agreement with our data, taking into account a partial loss of one copy in family 4 as the result of an aberrant NAHR event (see Discussion).
mRNA Expression Studies
For expression analysis, we focused on those genes that have the highest levels of expression in brain (GDI1, RPL10, and ATP6AP1) or for which mutations have been reported to play a role in XLMR (GDI1 and FLNA). First, we measured the stability of expression of these four genes in EBV-PBLs derived from five control individuals (three males and two females), normalized to GUSB expression. A highly stable expression pattern was obtained for three genes (GDI1: 1.00 ± 0.18; ATP6AP1: 1.00 ± 0.20; FLNA: 1.00 ± 0.17), demonstrating a tight regulation of mRNA levels of these genes. Expression of RPL10 was somewhat more variable (1.00 ± 0.66) in this cell type, although unrelated to sex. Moreover, the expression levels of the four genes within the aberration in EBV-PBLs was fairly high because mean dCt values (Ct gene – Ct GUSB) were always below or equal to zero (GDI1: −0.5; RPL10: −1.0; ATP6AP1: 0.0; FLNA: −0.5). Finally, relative expression of murine Gdi1, normalized to Hprt, was measured in cortex and hippocampus of five male mice. Highly stable mRNA levels were obtained for both tissue types (data not shown). Next, qPCR analysis on cDNA from patient III.19 of family 1 revealed a 3- to 4-fold increase in mRNA levels of GDI1, RPL10, and ATP6AP1, whereas the mRNA level of FLNA was only 2-fold higher when compared to controls (Figure 6). In family 2 with five copies, lymphocytes obtained from both affected brothers (II.1 and II.2) had GDI1, RPL10, ATP6AP1, and FLNA mRNA levels 8-, 12-, 6-, and 5-fold higher than controls, respectively. The expression of three control genes located at other locations on the X chromosome, HPRT (Xq26.2), HUWE1 (Xp11.22), and PORCN (Xp11.23), did not show significantly altered cDNA levels from the patients from both families when compared to controls (Figure 6). In family 3, only the GDI1 expression levels were measured in total RNA extracted from blood lymphocytes, normalized to GUSB. qPCR revealed a 4-fold increase in two affected males (I.3 and II.2) in comparison with two male controls (data not shown). Gene expression levels could not be tested in patient 4 because of unavailability of material.
Figure 6.
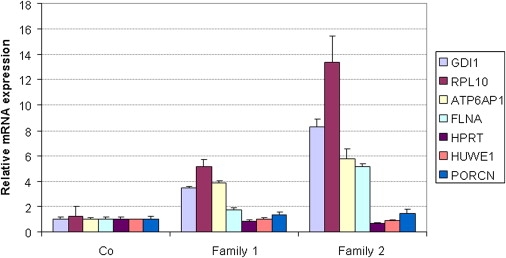
mRNA Expression Analysis of GDI1, RPL10, ATP6AP1, and FLNA in Affected Members of Families 1 and 2 with a Copy-Number Gain at Xq28
cDNA was prepared from RNA extracted from blood (controls, family 2) or EBV-PBL cell lines (controls, family 1). Compared to controls, all affected individuals showed significant increased mRNA levels for all four genes. Expression was determined by qPCR and normalized to the expression of HPRT. Expression levels are calculated relative to the mean levels obtained in the control samples (fold difference; y axis). Standard deviations of at least two independent experiments are indicated for each bar.
X-Inactivation
Analysis of the X-inactivation pattern in carrier females of the families revealed a preferential use of the normal X chromosome not carrying the copy-number gain. In family 1, the proband (IV.2) carries the 327 allele at the AR locus. His carrier mother (III.11) has the alleles 321/327 with 85% of the cells inactivating the X chromosome with the 327 allele. The grandmother via maternal line (II.5), who is also a carrier, inactivates the same chromosome in 83% of her cells. X-inactivation analysis in the carrier mothers of family 2 (this study) and family 3 showed a skewed inactivation of 94% (own data) and 100%,13 respectively. In family 4, the carrier mother (I.2) has the AR alleles 316/321 and inactivates the 316 allele that is transmitted to her affected son, in 70% of her cells.
Discussion
In males, duplication of any part of the X chromosome except the pseudoautosomal region leads to functional disomy of the genes located within the aberration. We have shown that increased gene dosage of XLMR genes can result in an MR phenotype, showing that a two-fold increase of the apparently critical quantity of the corresponding protein can affect normal cognitive development.1–3,13,18 This phenomenon most likely holds for many other brain-expressed genes that are not implicated in any disease to date and reflects the central neuronal homeostasis that is critical for normal brain function.19 Therefore, the use of array-CGH in the study of mental retardation remains essential.
We identified three XLMR families and one sporadic patient carrying a copy-number gain of apparently the same 0.3 Mb region at Xq28. The aberrant region that was not present in DGV contains 18 annotated genes of which GDI1 and FLNA have previously been associated with X-linked mental retardation. Rab GDP-Dissociation Inhibitor 1 (GDI1) is a central regulator of Rab GTPase family members. GDI1 recycles Rab proteins from the membrane and sequesters the inactive GDP-bound form of Rab in the cytosol for use in multiple rounds of transport. The balance between the membrane-bound form of Rab and the cytosolic reserve pool of the Rab-GDI1 complex is critical for vesicular trafficking and neurotransmittor release.20 To guarantee this delicate balance, a critical dosage of GDI1 protein is required. Inactivating mutations in GDI1 are associated with nonsyndromic X-linked mental retardation (MIM 300104).21 However, it can be envisaged that increased dosage might also affect the complex Rab GTPase molecular switches, involved in neuronal cell signaling. No animal model for increased Gdi1 expression has been reported to date. Indeed, we demonstrated highly stable GDI1 mRNA levels at least in EBV-PBLs and blood lymphocytes from controls. The other duplicated gene implicated in a neurodevelopmental phenotype, FLNA, is associated with a broad range of congenital disorders affecting multiple organs.22 It codes for Filamin A, a widely expressed protein that crosslinks the actin in a regulated fashion into either networks or stress fibers that give the cell the ability to respond to environmental cues. Loss-of-function mutations, although lethal in males, result in defective neuronal migration leading to periventricular nodular heterotopia (PVNH [MIM 300049]) in females. On the contrary, clustered missense mutations in FLNA are associated with a diverse spectrum of congenital malformations in males and females, referred to as otopalatodigital spectrum disorders (OPD [MIM 300017]).22 We did not observe any anomalies affecting the skeletal system or neuronal migration deficits in our group of patients. Interestingly, Clayton-Smith and coworkers recently suggested that increased FLNA gene dosage may lead to intestinal pseudo-obstruction and bladder dysfunction, as observed in seven families.23 However, we did not detect these features in any of our families with duplication including FLNA. Moreover, a polymorphic copy-number gain including FLNA has been reported in a male24 and is present in the Database of Genomic Variants (DGV) as variation_31575.
Two other genes with high expression in brain are located within the aberration (RPL10 and ATP6AP1). Of these, the RPL10 gene that codes for a ribosomal protein has been associated with autism and MR.25 Because both genes also showed significantly increased mRNA levels at least in lymphocytes from two patients compared to controls, we cannot exclude an effect of increased dosages of both genes. The triplication of RPL10 in family 4 with just moderate MR argues against this gene as the cause of the dosage-dependent phenotype because it is also present in three copies in families 1 and 3 with a more severe phenotype. The correlation of gene dosage with phenotypic severity, however, is valid for ATP6AP1 and GDI1. Identification of additional aberrations in this region or functional in vitro or in vivo studies will help to pinpoint the causal gene. Moreover, the role of other genes within the aberration, such as UBL4A and FAM3A, cannot be excluded even though the apparent 190 kb copy-number polymorphism identified in a normal male individual seems to exclude a contribution of a double dosage of both genes in family 4. Nevertheless, their involvement in more than two-fold-increased dosages remains speculative. Of the remaining genes, four have already been implicated in unrelated diseases not associated with cognitive alterations (Table 1).
The clinical phenotype in families 1, 3, and 4 that carry a duplication or triplication is nonsyndromic mild to moderate MR, with some mild nonconsistent dysmorphic features in families 1 and 3 with the triplication. Of special note are the ventricular aberrations seen in both families, a large fourth ventricle in family 1, and a ventricular dilatation in family 3. In contrast, the two brothers of family 2 with five copies of this region display a much more severe phenotype, with severe developmental delay, hypotonia, epilepsy, and progressive microcephaly, together with a Dandy-Walker malformation. The difference in phenotypic severity of both patients of family 2 compared to the patients of the other families described here can be attributed to the much higher mRNA levels of brain-expressed genes. A correlation between gene dosage and severity has also been demonstrated for PLP1 in Pelizaeus-Merzbacher disease,8 amplification of chromosomal 4q21 region including SNCA [MIM 163890] in parkinsonism,26 and triplication of MECP2.7
Another conclusion from this study is that an increased copy number of individual genes present in a contiguous genomic aberration can in itself result in a clinical phenotype too. Indeed, in some patients with a duplication of the MECP2 region, the affected genomic interval described here is contained within the duplication.4,6 However, the phenotype associated with the MECP2 duplication syndrome is apparently not related to the number of genes involved because of the essential and causal role of increased MECP2 dosages. Our findings now illustrate that an increased dosage of genes within the MECP2 duplication can, in itself, also result in an MR phenotype, albeit much milder, and thus could have a modest effect on the phenotype of patients with the MECP2 duplication syndrome. The most likely candidate gene is GDI1 because it is highly expressed in brain especially in the hippocampus, mutations herein lead to XLMR, and it is stably expressed in mouse brain including hippocampus, suggesting a tightly regulated expression of this gene. A three- or even five-fold-increased dosage is thus very likely to worsen the phenotype. However, additional functional evidence is required to prove this hypothesis. The clinical features of our patients described in this study do not resemble at all the specific ones observed in patients with the MECP2 duplication syndrome, which argues against a position effect on MECP2 mRNA levels. Expression levels in EBV-PBLs derived from the proband of family 1 were well within the variability found in control samples (data not shown).
The carrier mothers show a nonrandom X-inactivation, which seems to be correlated with the copy number of GDI1 in that the carrier mothers of families 2 and 3 with four and two additional copies, respectively, (almost) completely skew whereas this pattern is 85% in the mother of family 1, with two additional copies, and 70% in the mother of family 4, who has one more copy of the gene.
Finally, the precise location and size of the aberrant region in all four families appears to be highly similar although the exact breakpoint sites could not be determined, probably because of the involvement of LCRs at the proximal as well as the distal breakpoint regions. In all four families, the aberrations start exactly at the beginning of LCR K1 and stop at the end of LCR L2 (just distal to CTAG2 in families 1, 3, and 4 and 7 kb more distal to that site in family 2). Even though the breakpoint positions are unknown, the four identified rearrangements point to a common mechanism that involves a member of the K- and L-type of LCRs. The lack of any homology between both sets of LCRs precludes NAHR between members of both LCR sets. The mechanism of Fork Stalling and Template Switching (FoSTeS),5 microhomology-mediated break-induced replication (MM-BIR),4,27 or coupled homologous and nonhomologous recombination28 is not very likely for this type of rearrangement given that these mechanisms have been described for nonrecurrent aberrations, which use microhomology at their junctions. Here, we propose a model in which the triplication in families 1, 3, and 4 resulted from two successive NAHR events between complementary LCRs during meiosis I with an isodicentric X chromatid as an intermediate (Figure 5). Interestingly, a similar model for a complex rearrangement at 8p23 has been proposed earlier. This group reported on two cases with a duplication and triplication on 8p23.1 and 8p23.2, respectively, and a third case with a dicentric chromosome 8, and they hypothesized a recombination model that consists of NAHR between two unrelated LCR sets (OR-REP and MYOM2-REP) during meiosis in heterozygous carriers of a polymorphic 8p23.1 inversion.29 The triplication of a smaller fragment (R3') in family 4 can then be explained by an erroneous NAHR event in which the K-LCR set together with a smaller repeat such as a LINE or SINE is used for recombination. Indeed, the breakpoint region as defined by the oligo array (153,308,905–153,308,932 bp; Table S2) is directly flanked by several LINEs and SINEs (UCSC browser). Such erroneous NAHR events have been described for other rearrangements.29 Moreover, our data provide evidence that a third NAHR event between sister chromatids in meiosis II can generate a further expansion of the copy number, as has been detected for family 2. We were unable to clone the junctions, which is not surprising given the very high sequence homology between the LCR subunits and the multiple rearrangements that take place between both classes of LCRs.30,31 We did not find any evidence for the alternative “polymorphic inversion”-based model. Inversion polymorphisms have been found in other diseases as a requirement for recurrent aberrant genomic rearrangements. Recurrent deletions and duplications on 17q21.3132–34 and recurrent deletions associated with Sotos syndrome35 are prime examples. Also, a potential inversion at this Xq28 site has not been reported yet and actually is not very likely because it could lead to disruption of the FLNA or EMD genes that would result in disease. Finally, a reciprocal deletion of the aberrant region described here has not been reported, strongly indicating that deletion of at least one of these genes is not compatible with life. Indeed, absence of, e.g., the IKBKG gene is lethal in males.11
Our data corroborate other studies that point to genomic instability of loci that contain multiple segmental duplications. In particular, the Xq28 region is known to be instable because of the many repeats resulting in several microrearrangements leading to disease.4,7 Our data, however, indicate that the way these rearrangements are established can be the result of several different mechanisms. Because many similar LCR-rich regions exist in the human genome, it is expected that similar variable copy-number aberrations exist. Detecting the aberration therefore is not sufficient. Defining the precise copy number of it can be very informative in explaining apparently similar aberrations with highly variable phenotypes. Finding other recurrent aberrations, which are flanked by two different LCR sets, will establish the proposed model as a new mechanism that can drive evolution but can also result in disease.
Supplemental Data
Supplemental Data include two tables and four figures and can be found with this article online at http://www.cell.com/AJHG.
Supplemental Data
Web Resources
The URLs for data presented herein are as follows:
Allen Mouse Brain Atlas, http://mouse.brain-map.org/welcome.do
Bioconductor, http://www.bioconductor.org
Database of Genomic Variants (DGV), http://projects.tcag.ca/variation/
Genecards, http://www-bimas.cit.nih.gov/cards/
Gene Expression Omnibus (GEO), http://www.ncbi.nlm.nih.gov/geo/
Online Mendelian Inheritance in Man (OMIM), http://www.ncbi.nlm.nih.gov/Omim/
Pipmaker, http://pipmaker.bx.psu.edu/pipmaker/
UCSC Genome Browser, http://genome.ucsc.edu/index.html?org=Human
Unigene, http://www.ncbi.nlm.nih.gov/sites/entrez?db=unigene
VIB MicroArrays Facility Leuven, Belgium, http://www.microarrays.be
Accession Numbers
The GEO accession numbers for the oligo arrays and the data for the probands of the four families reported in this paper are GPL9083 and GSE17813, respectively.
Acknowledgments
We are grateful to the patients and their families for their cooperation. We thank Detlef Böhm for performing the array-CGH experiments at the Center for Human Genetics in Freiburg (Germany), Stefanie Belet (VIB, K.U.Leuven, Belgium) for technical assistance with qPCR, and Richard Redon (The Welcome Trust Sanger Institute, Hinxton, UK) for suggesting the inversion polymorphism hypothesis. J.V. is supported by the IWT (Instituut voor aanmoediging van Innovatie door Technologie en Wetenschap), Flanders, Belgium. H.V.E. is a clinical investigator of the Fund for Scientific Research-Flanders, Belgium (FWO-Vlaanderen). This work was supported by Fundación Ramon Areces (V-2006-FRARECES-O) and CIBERER (the CIBER de Enfermedades Raras is an initiative of the ISCIII).
References
- 1.Froyen G., Van Esch H., Bauters M., Hollanders K., Frints S.G., Vermeesch J.R., Devriendt K., Fryns J.P., Marynen P. Detection of genomic copy number changes in patients with idiopathic mental retardation by high-resolution X-array-CGH: Important role for increased gene dosage of XLMR genes. Hum. Mutat. 2007;28:1034–1042. doi: 10.1002/humu.20564. [DOI] [PubMed] [Google Scholar]
- 2.Froyen G., Corbett M., Vandewalle J., Jarvela I., Lawrence O., Meldrum C., Bauters M., Govaerts K., Vandeleur L., Van Esch H. Submicroscopic duplications of the hydroxysteroid dehydrogenase HSD17B10 and the E3 ubiquitin ligase HUWE1 are associated with mental retardation. Am. J. Hum. Genet. 2008;82:432–443. doi: 10.1016/j.ajhg.2007.11.002. [DOI] [PMC free article] [PubMed] [Google Scholar]
- 3.Van Esch H., Bauters M., Ignatius J., Jansen M., Raynaud M., Hollanders K., Lugtenberg D., Bienvenu T., Jensen L.R., Gecz J. Duplication of the MECP2 region is a frequent cause of severe mental retardation and progressive neurological symptoms in males. Am. J. Hum. Genet. 2005;77:442–453. doi: 10.1086/444549. [DOI] [PMC free article] [PubMed] [Google Scholar]
- 4.Bauters M., Van Esch H., Friez M.J., Boespflug-Tanguy O., Zenker M., Vianna-Morgante A.M., Rosenberg C., Ignatius J., Raynaud M., Hollanders K. Nonrecurrent MECP2 duplications mediated by genomic architecture-driven DNA breaks and break-induced replication repair. Genome Res. 2008;18:847–858. doi: 10.1101/gr.075903.107. [DOI] [PMC free article] [PubMed] [Google Scholar]
- 5.Lee J.A., Carvalho C.M., Lupski J.R. A DNA replication mechanism for generating nonrecurrent rearrangements associated with genomic disorders. Cell. 2007;131:1235–1247. doi: 10.1016/j.cell.2007.11.037. [DOI] [PubMed] [Google Scholar]
- 6.Carvalho C.M., Zhang F., Liu P., Patel A., Sahoo T., Bacino C.A., Shaw C., Peacock S., Pursley A., Tavyev Y.J. Complex rearrangements in patients with duplications of MECP2 can occur by fork stalling and template switching. Hum. Mol. Genet. 2009;18:2188–2203. doi: 10.1093/hmg/ddp151. [DOI] [PMC free article] [PubMed] [Google Scholar]
- 7.del Gaudio D., Fang P., Scaglia F., Ward P.A., Craigen W.J., Glaze D.G., Neul J.L., Patel A., Lee J.A., Irons M. Increased MECP2 gene copy number as the result of genomic duplication in neurodevelopmentally delayed males. Genet. Med. 2006;8:784–792. doi: 10.1097/01.gim.0000250502.28516.3c. [DOI] [PubMed] [Google Scholar]
- 8.Wolf N.I., Sistermans E.A., Cundall M., Hobson G.M., Davis-Williams A.P., Palmer R., Stubbs P., Davies S., Endziniene M., Wu Y. Three or more copies of the proteolipid protein gene PLP1 cause severe Pelizaeus-Merzbacher disease. Brain. 2005;128:743–751. doi: 10.1093/brain/awh409. [DOI] [PubMed] [Google Scholar]
- 9.Shaw C.J., Lupski J.R. Implications of human genome architecture for rearrangement-based disorders: The genomic basis of disease. Hum. Mol. Genet. 2004;13:R57–R64. doi: 10.1093/hmg/ddh073. Spec No 1. [DOI] [PubMed] [Google Scholar]
- 10.Ballabio A., Bardoni B., Carrozzo R., Andria G., Bick D., Campbell L., Hamel B., Ferguson-Smith M.A., Gimelli G., Fraccaro M. Contiguous gene syndromes due to deletions in the distal short arm of the human X chromosome. Proc. Natl. Acad. Sci. USA. 1989;86:10001–10005. doi: 10.1073/pnas.86.24.10001. [DOI] [PMC free article] [PubMed] [Google Scholar]
- 11.Smahi A., Courtois G., Vabres P., Yamaoka S., Heuertz S., Munnich A., Israel A., Heiss N.S., Klauck S.M., Kioschis P. Genomic rearrangement in NEMO impairs NF-kappaB activation and is a cause of incontinentia pigmenti. The International Incontinentia Pigmenti (IP) Consortium. Nature. 2000;405:466–472. doi: 10.1038/35013114. [DOI] [PubMed] [Google Scholar]
- 12.Bauters M., Van Esch H., Marynen P., Froyen G. X chromosome array-CGH for the identification of novel X-linked mental retardation genes. Eur. J. Med. Genet. 2005;48:263–275. doi: 10.1016/j.ejmg.2005.04.008. [DOI] [PubMed] [Google Scholar]
- 13.Madrigal I., Rodriguez-Revenga L., Armengol L., Gonzalez E., Rodriguez B., Badenas C., Sanchez A., Martinez F., Guitart M., Fernandez I. X-chromosome tiling path array detection of copy number variants in patients with chromosome X-linked mental retardation. BMC Genomics. 2007;8:443. doi: 10.1186/1471-2164-8-443. [DOI] [PMC free article] [PubMed] [Google Scholar]
- 14.Unger S., Bohm D., Kaiser F.J., Kaulfuss S., Borozdin W., Buiting K., Burfeind P., Bohm J., Barrionuevo F., Craig A. Mutations in the cyclin family member FAM58A cause an X-linked dominant disorder characterized by syndactyly, telecanthus and anogenital and renal malformations. Nat. Genet. 2008;40:287–289. doi: 10.1038/ng.86. [DOI] [PubMed] [Google Scholar]
- 15.Barrett M.T., Scheffer A., Ben-Dor A., Sampas N., Lipson D., Kincaid R., Tsang P., Curry B., Baird K., Meltzer P.S. Comparative genomic hybridization using oligonucleotide microarrays and total genomic DNA. Proc. Natl. Acad. Sci. USA. 2004;101:17765–17770. doi: 10.1073/pnas.0407979101. [DOI] [PMC free article] [PubMed] [Google Scholar]
- 16.Willenbrock H., Fridlyand J. A comparison study: Applying segmentation to array CGH data for downstream analyses. Bioinformatics. 2005;21:4084–4091. doi: 10.1093/bioinformatics/bti677. [DOI] [PubMed] [Google Scholar]
- 17.Allen R.C., Zoghbi H.Y., Moseley A.B., Rosenblatt H.M., Belmont J.W. Methylation of HpaII and HhaI sites near the polymorphic CAG repeat in the human androgen-receptor gene correlates with X chromosome inactivation. Am. J. Hum. Genet. 1992;51:1229–1239. [PMC free article] [PubMed] [Google Scholar]
- 18.Jehee F.S., Rosenberg C., Krepischi-Santos A.C., Kok F., Knijnenburg J., Froyen G., Vianna-Morgante A.M., Opitz J.M., Passos-Bueno M.R. An Xq22.3 duplication detected by comparative genomic hybridization microarray (Array-CGH) defines a new locus (FGS5) for FG syndrome. Am. J. Med. Genet. A. 2005;139:221–226. doi: 10.1002/ajmg.a.30991. [DOI] [PubMed] [Google Scholar]
- 19.Ramocki M.B., Zoghbi H.Y. Failure of neuronal homeostasis results in common neuropsychiatric phenotypes. Nature. 2008;455:912–918. doi: 10.1038/nature07457. [DOI] [PMC free article] [PubMed] [Google Scholar]
- 20.DerMardirossian C., Bokoch G.M. GDIs: Central regulatory molecules in Rho GTPase activation. Trends Cell Biol. 2005;15:356–363. doi: 10.1016/j.tcb.2005.05.001. [DOI] [PubMed] [Google Scholar]
- 21.D'Adamo P., Menegon A., Lo N.C., Grasso M., Gulisano M., Tamanini F., Bienvenu T., Gedeon A.K., Oostra B., Wu S.K. Mutations in GDI1 are responsible for X-linked non-specific mental retardation. Nat. Genet. 1998;19:134–139. doi: 10.1038/487. [DOI] [PubMed] [Google Scholar]
- 22.Robertson S.P. Filamin A: Phenotypic diversity. Curr. Opin. Genet. Dev. 2005;15:301–307. doi: 10.1016/j.gde.2005.04.001. [DOI] [PubMed] [Google Scholar]
- 23.Clayton-Smith J., Walters S., Hobson E., Burkitt-Wright E., Smith R., Toutain A., Amiel J., Lyonnet S., Mansour S., Fitzpatrick D. Xq28 duplication presenting with intestinal and bladder dysfunction and a distinctive facial appearance. Eur. J. Hum. Genet. 2008;17:434–443. doi: 10.1038/ejhg.2008.192. [DOI] [PMC free article] [PubMed] [Google Scholar]
- 24.Perry G.H., Ben-Dor A., Tsalenko A., Sampas N., Rodriguez-Revenga L., Tran C.W., Scheffer A., Steinfeld I., Tsang P., Yamada N.A. The fine-scale and complex architecture of human copy-number variation. Am. J. Hum. Genet. 2008;82:685–695. doi: 10.1016/j.ajhg.2007.12.010. [DOI] [PMC free article] [PubMed] [Google Scholar]
- 25.Klauck S.M., Felder B., Kolb-Kokocinski A., Schuster C., Chiocchetti A., Schupp I., Wellenreuther R., Schmotzer G., Poustka F., Breitenbach-Koller L. Mutations in the ribosomal protein gene RPL10 suggest a novel modulating disease mechanism for autism. Mol. Psychiatry. 2006;11:1073–1084. doi: 10.1038/sj.mp.4001883. [DOI] [PubMed] [Google Scholar]
- 26.Ross O.A., Braithwaite A.T., Skipper L.M., Kachergus J., Hulihan M.M., Middleton F.A., Nishioka K., Fuchs J., Gasser T., Maraganore D.M. Genomic investigation of alpha-synuclein multiplication and parkinsonism. Ann. Neurol. 2008;63:743–750. doi: 10.1002/ana.21380. [DOI] [PMC free article] [PubMed] [Google Scholar]
- 27.Hastings P.J., Ira G., Lupski J.R. A microhomology-mediated break-induced replication model for the origin of human copy number variation. PLoS. Genet. 2009;5:e1000327. doi: 10.1371/journal.pgen.1000327. [DOI] [PMC free article] [PubMed] [Google Scholar]
- 28.Woodward K.J., Cundall M., Sperle K., Sistermans E.A., Ross M., Howell G., Gribble S.M., Burford D.C., Carter N.P., Hobson D.L. Heterogeneous duplications in patients with Pelizaeus-Merzbacher disease suggest a mechanism of coupled homologous and nonhomologous recombination. Am. J. Hum. Genet. 2005;77:966–987. doi: 10.1086/498048. [DOI] [PMC free article] [PubMed] [Google Scholar]
- 29.Giorda R., Ciccone R., Gimelli G., Pramparo T., Beri S., Bonaglia M.C., Giglio S., Genuardi M., Argente J., Rocchi M. Two classes of low-copy repeats comediate a new recurrent rearrangement consisting of duplication at 8p23.1 and triplication at 8p23.2. Hum. Mutat. 2007;28:459–468. doi: 10.1002/humu.20465. [DOI] [PubMed] [Google Scholar]
- 30.Small K., Iber J., Warren S.T. Emerin deletion reveals a common X-chromosome inversion mediated by inverted repeats. Nat. Genet. 1997;16:96–99. doi: 10.1038/ng0597-96. [DOI] [PubMed] [Google Scholar]
- 31.Aradhya S., Bardaro T., Galgoczy P., Yamagata T., Esposito T., Patlan H., Ciccodicola A., Munnich A., Kenwrick S., Platzer M. Multiple pathogenic and benign genomic rearrangements occur at a 35 kb duplication involving the NEMO and LAGE2 genes. Hum. Mol. Genet. 2001;10:2557–2567. doi: 10.1093/hmg/10.22.2557. [DOI] [PubMed] [Google Scholar]
- 32.Koolen D.A., Vissers L.E., Pfundt R., de Leeuw N., Knight S.J., Regan R., Kooy R.F., Reyniers E., Romano C., Fichera M. A new chromosome 17q21.31 microdeletion syndrome associated with a common inversion polymorphism. Nat. Genet. 2006;38:999–1001. doi: 10.1038/ng1853. [DOI] [PubMed] [Google Scholar]
- 33.Shaw-Smith C., Pittman A.M., Willatt L., Martin H., Rickman L., Gribble S., Curley R., Cumming S., Dunn C., Kalaitzopoulos D. Microdeletion encompassing MAPT at chromosome 17q21.3 is associated with developmental delay and learning disability. Nat. Genet. 2006;38:1032–1037. doi: 10.1038/ng1858. [DOI] [PubMed] [Google Scholar]
- 34.Sharp A.J., Hansen S., Selzer R.R., Cheng Z., Regan R., Hurst J.A., Stewart H., Price S.M., Blair E., Hennekam R.C. Discovery of previously unidentified genomic disorders from the duplication architecture of the human genome. Nat. Genet. 2006;38:1038–1042. doi: 10.1038/ng1862. [DOI] [PubMed] [Google Scholar]
- 35.Visser R., Shimokawa O., Harada N., Kinoshita A., Ohta T., Niikawa N., Matsumoto N. Identification of a 3.0-kb major recombination hotspot in patients with Sotos syndrome who carry a common 1.9-Mb microdeletion. Am. J. Hum. Genet. 2005;76:52–67. doi: 10.1086/426950. [DOI] [PMC free article] [PubMed] [Google Scholar]
Associated Data
This section collects any data citations, data availability statements, or supplementary materials included in this article.