Short abstract
Many oncology practices have responded to rising supply costs and decreasing reimbursements by examining their operational processes and working to reduce costs and enhance practice efficiency.
Abstract
Purpose:
Oncology practices are experiencing increasing economic pressures as costs rise, the number of patients needing services increases, and reimbursements from payers remain flat or decrease. Many practices have responded to these challenges by examining business processes and making changes to improve efficiency and decrease costs. Benchmarking is a valuable tool for such practice improvement. This article presents results from the 2009 National Practice Benchmark.
Methods:
Oncology practices were invited to participate in an online benchmarking survey. Two hundred eight practices from 41 states responded to the survey, and demographic, operational, and financial data were collected for calendar year 2008 or the most recent fiscal year.
Results:
Data from 2008 were compared with previously collected 2007 data. The 2008 data show fewer small practices (with one to three full-time equivalent physicians) reporting and fewer sites of clinical service per practice. The most compelling data presented show that total practice expense increased 15% from 2007 to 2008, whereas total collected revenue increased by only 6%. Clearly there are fewer dollars available to support clinical operations.
Conclusion:
These results highlight some of the challenges faced by oncology practices today. Some practices have responded to these challenges by cutting costs (and sometimes eliminating services) and improving efficiency. For many practices, continued business management improvements will be necessary to provide adequate compensation for physician partners to warrant acceptance of the business risks associated with practice ownership and operation. In practices in which these improvements do not materialize, physicians will either close their practices and exit the field or seek other practice arrangements to continue to provide oncology services at less personal risk.
Introduction
In last year's survey of oncology practices, we predicted that there would be financial pressure in 2008. The data are now in, and they reveal that our industry is experiencing significant economic challenges, but importantly, many practices are adapting. The aging of the US population has resulted in more patients who need oncology services. Oncology-trained staff to care for these patients are becoming increasingly difficult to find and command high salaries. Supply costs, especially cost of chemotherapy drugs, are increasing, and reimbursements from many payers are at best flat and, in many cases, decreasing. Some practices have not been able to respond to these pressures and have instead elected to join hospital systems or merge with larger practices. A small number of practices have actually closed. However, many oncology practices have responded to these challenges by examining their business and operational processes and making improvements to decrease costs and enhance practice efficiency.
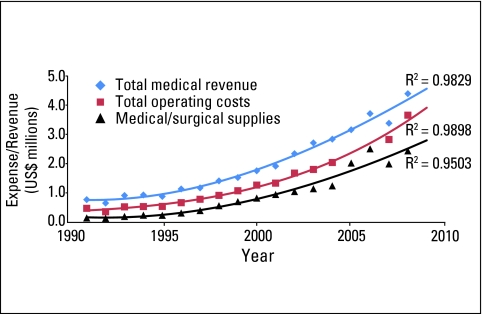
Figure 1 tracks total medical revenue, total practice expense, and cost of medical and surgical supplies (primarily drugs) from 1991 through 2008 on a per full-time equivalent (FTE) physician basis. This information was previously presented in Journal of Oncology Practice in July 2008.1 At that time, actual data were presented through 2007 with a projection for 2008, in which the lines for total medical revenue and total operating cost crossed. Actual 2008 data have now been added, and although the difference between the cost and revenue lines has narrowed, the lines do not cross. Practices continue to experience tremendous financial pressure; however, the potential catastrophe of expenses exceeding revenue has not materialized for most practices.
Figure 1.
Oncology trends per full-time equivalent physician. Trend line is third-order polynomial. Data from 1991 to 2003 from Medical Group Management Association (Englewood, CO); data from 2004 to 2008 from Oncology Metrics (Fort Worth, TX).
As practices have increased their focus on improving business processes, the need for meaningful benchmarks has grown. This article presents the results of the 2009 National Practice Benchmark (NPB): Report on 2008 Data.
Methods
The 2009 NPB is the fourth annual benchmarking survey developed and conducted by Oncology Metrics (Fort Worth, TX). Oncology practices across the United States were invited to participate via e-mail, and more than 2,000 invitations were sent using a proprietary database maintained by Oncology Metrics. Consistent with prior NPB protocol, practices were instructed to submit only one survey per practice, and survey results were screened to eliminate duplicate responses. The survey was completed by participants entirely online. As in previous surveys, practices were not required to answer all survey questions, results from incomplete surveys were included in the survey results, and nonsensical data were eliminated from specific data analysis.
The survey requested data for calendar year 2008 or the most recently completed 12-month accounting period. We received 208 responses from practices in 41 states. Ten survey responses were determined to be duplicates from the same practice and were deleted. Each respondent was asked to identify his or her role in the practice, and the results show that surveys were completed by practice administrators (45%), physicians (33%), directors of finance (6%), nurses (5%), billing staff (4%), and others (7%). The high percentage of physicians responding to the survey is noteworthy. Number of responses to individual questions varied from 54 to 198. Questions were developed to allow comparisons with the 2008 NPB (report on 2007 data), and data were requested in the following categories: practice demographics and general information, financial and operational data, staffing, services, and information systems.
Incentives for participation in the 2009 NPB included an electronic version of the survey report as well as gift cards for participants who completed all applicable questions. All complete surveys were also entered into a drawing for an Apple iTouch (Apple, Cupertino, CA).
Demographics
Practice structure and size are listed in Table 1, which includes comparisons between the 2007 and 2008 NPB data sets. Practice structure appears to be shifting, with the percentage of practices reported as physician owned dropping from 87% in 2007 to 74% in 2008. Although there was a small increase in the number of practices reporting management-company ownership, the larger increase was in the number of practices reporting “other” as their practice structure. Practices in this category were asked to specify their structures, and responses included academic, joint venture, and not for profit.
Table 1.
Practice Demographics
| Characteristic | 2008 NPB Report (2007 data) | 2009 NPB Report (2008 data) | 2007 Oncology Circle Data | 2008 Oncology Circle Data |
|---|---|---|---|---|
| Practice structure | ||||
| Total responses | 275 | 198 | ||
| Physician owned, % | 87 | 74 | ||
| Hospital owned, % | 10 | 10 | ||
| Management-company owned, % | 3 | 6 | ||
| Other, % | 0 | 11 | ||
| Practice size (No. of FTE HemOnc physicians) | ||||
| Total responses | 113 | 100 | ||
| Total FTE HemOnc physicians | 610 | 818 | ||
| 1-3, % | 46 | 35 | ||
| 3.1-6, % | 27 | 26 | ||
| 6.1-9, % | 16 | 16 | ||
| 9.1-13, % | 5 | 13 | ||
| 13.1-20, % | 3 | 4 | ||
| > 20, % | 4 | 6 | ||
| No. of clinic sites per practice | ||||
| 25th percentile | 1.7 | 4.0 | 2.8 | |
| Median | 2.2 | 5.0 | 4.2 | |
| Average | 4.2 | 6.2 | 5.2 | |
| 75th percentile | 4.9 | 7.8 | 5.8 |
Abbreviations: NPB, National Practice Benchmark; FTE, full-time equivalent; HemOnc, hematology/oncology.
Although the overall number of survey responses was smaller in 2009 than in 2008, the number of respondents reporting practice size as measured by the reported number of FTE hematology/oncology (HemOnc) physicians in the practice is comparable to that in 2008 (113 v 100 respondents). It is interesting to note that although the number of practices reporting FTE HemOnc physicians was smaller in 2009, the total number of FTE HemOnc physicians in the data set was significantly larger (818 v 610 physicians). These data indicate that the number of practices responding to the survey with one to three FTE HemOnc physicians is decreasing, whereas the number of larger practices (ie, those with nine or more FTE HemOnc physicians) is growing. This shift may represent changes in practice composition or may simply represent a change in the sample that does not represent the whole population of practices. Consistent with the methodology of past years, an FTE physician is described as working 4 days per week in the clinic, working a fifth day on clinic business, and sharing call equally with other physicians.
In addition to reporting the number of FTE HemOnc physicians in the practice, practices were instructed to report the number of FTE radiation oncologists, FTE gynecologic oncologists, and other FTE physicians. For many of the metrics in this study, analyses were performed on the basis of both FTE HemOnc and other FTE physicians; however, a majority of the metrics in this article were reported per FTE HemOnc physician. Any variation from this is noted.
In the 2009 NPB, practices were asked to report the number of clinic sites. This metric was reported by 104 practices, with an average of 4.2 sites per practice (Table 1). These data were not collected last year, so results could not be compared with those in 2008. In a separate survey of practices participating in the Oncology Circle, a benchmarking collaborative operated by Oncology Metrics, the number of clinic sites was collected, and those data are provided here for comparison purposes. It is important to note that the Oncology Circle is composed of approximately 35 geographically diverse practices, with an average of nine FTE HemOnc physicians per practice; they are larger than the average practice participating in the NPB. Regardless of this difference in practice demographics, the Oncology Circle practices reported fewer clinic sites in 2008 than in 2007, and the NPB respondents reported still fewer clinic sites per practice. Fewer sites of clinical service is consistent with higher economic efficiency and overall lower cost and is a reasonable response to economic stress. The authors speculate that observed reimbursement reductions are driving efforts to improve economic performance and consequently reducing the number of sites of service that an individual practice may choose to maintain.
The changes observed in the demographic data in this survey are consistent with anecdotal reports of changes in practice size and structure. The authors are personally aware of practices across the country that have undergone significant changes in the last year, including being purchased by hospitals or academic medical centers, closing clinic sites and consolidating operations, merging with other practices, and closing. The financial pressures faced by oncology practices today are real and are affecting practice operations.
Financial Results
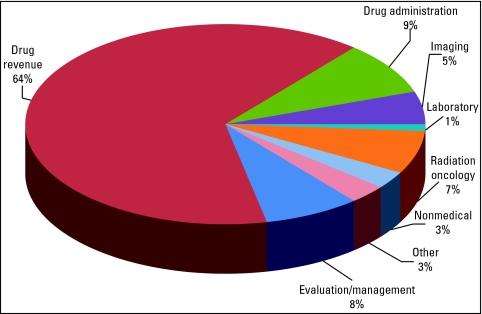
Survey respondents were asked to report several financial metrics and were provided with definitions for each requested metric to encourage consistency in the data reported. Expense data were limited to two data points: total practice expense (defined as all cash expenses for the practice for the time period, including all salaries paid) and cost of goods paid for (COGPF; defined as the total of all money paid for drugs minus rebates or other cost reductions received in the same period). Eight revenue-related metrics were requested: total revenue (cash collections for the period as reported on the practice profit and loss statement), nonmedical revenue (revenue earned for services other than the provision of medical care, such as medical directorships, research revenue, interest income, and so on), and six categories of service revenue (evaluation and management, drugs, drug administration, imaging, laboratory, and radiation oncology). A ninth category—other revenue—was calculated by subtracting the service revenue plus nonmedical revenue from total revenue. These data are readily available in all practices and are likely to be comparable across the sample. Figure 2 shows the revenue distribution for 2008 for the reporting practices. There was no significant change from 2007 data; drug revenue remained the powerful top-line—and bottom-line—economic engine of medical oncology.
Figure 2.
Revenue distribution in 2008.
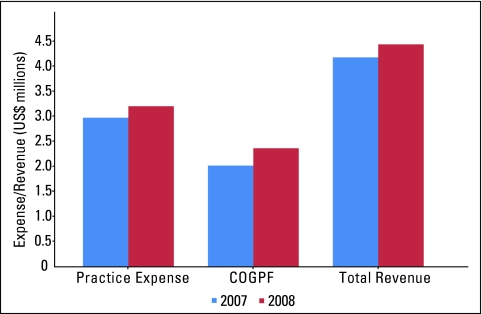
Figure 3 compares practice expense, COGPF, and total revenue for 2007 and 2008. The data sets for these two time periods are remarkably similar, with 79 respondents for practice expense for 2007 and 72 for 2008, 66 respondents for COGPF for 2007 and 70 for 2008, and 84 respondents for total revenue for 2007 and 76 for 2008. These similarities in the sample support year-to-year comparisons.
Figure 3.
Revenue and expenses per full-time equivalent hematology/oncology physician. COGPF, cost of goods paid for.
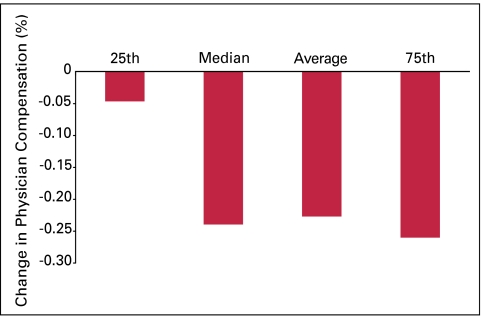
Although it is not surprising that an increase was seen in each of these categories from 2007 to 2008, the relative rate of increase of each is interesting. Practice expense and COGPF both increased 15% from 2007 to 2008, whereas practice revenue increased at a slower pace of 6%. This gap has resulted in fewer dollars available to support clinical operations at the bottom line. We cannot say for certain how practices have responded to this imbalance; however, we expect that this is frequently reflected in lower income for the physicians in practice, because physician owners are typically paid last. We did not ask the NPB participants to report any salaries; however, we do collect this information from the Oncology Circle practices, and in that group, we see that physician salaries decreased significantly in 2008 (Fig 4). In this sample, the consistency of salary reduction observed at the median, average, and 75th percentile suggests that this decrease in physician salary is widespread.
Figure 4.
Percent change in physician compensation from 2007 to 2008 in Oncology Circle practices.
Operations
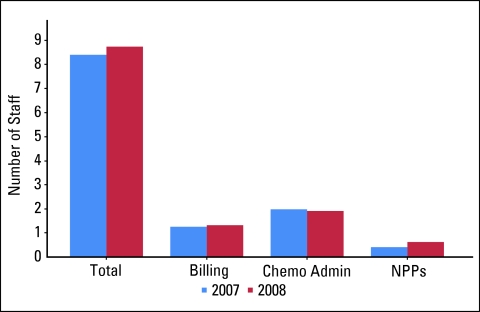
The NPB survey collected information in two important areas of practice operations: staffing levels and services. Staffing levels were reported by respondents on an FTE basis. The average number of FTE staff per FTE HemOnc physician in 2008 was 8.7, virtually unchanged from 8.4 reported in 2007. These data suggest that practices in the sample group did not seek cost savings through staff reduction in 2008. Data on several specific staffing categories were also reported. Billing and collections staff is defined as all staff involved in the billing and collections process, including financial counselors, coders, and charge-integrity staff. Chemotherapy administration is defined as the percentage of time that all staff spend on drug purchasing, drug management, drug preparation, and delivery to patients. This staffing category includes pharmacy and nursing personnel as well as nonclinical personnel if they are responsible for any of these tasks, particularly drug purchasing. Survey respondents were instructed to include the percentage of time all staff spend on these activities. The number of FTE nonphysician practitioners (NPPs) was also collected; NPPs are defined as nurse practitioners and physician assistants in the practice. Staffing levels remained virtually unchanged from 2007 to 2008 in each of these categories (Fig 5).
Figure 5.
Staffing levels per full-time equivalent hematology/oncology physician. Chemo admin, chemotherapy administration; NPP, nonphysician practitioner.
In addition to number of staff, current economic conditions have also increased practice interest in staff productivity. One area of particular interest is staffing in the chemotherapy suite, but this is a difficult area to measure. Asking practices to simply report the number of patients treated per chemotherapy administration staff member is not adequate, because the duties performed by these staff members vary significantly from practice to practice. Oncology Metrics has developed a productivity metric on the basis of the number of initial drug infusion codes per FTE chemotherapy administration staff member. We believe these initial codes are a surrogate for the number of infusion patients in the chemotherapy suite, because every patient who receives an infusion (chemotherapy or nonchemotherapy) is billed for one initial drug administration service. The average number of initial infusions per FTE chemotherapy administration staff member in 2008 was 780, virtually unchanged from 791 in 2007. These data show that the volume of chemotherapy services did not increase between 2007 and 2008.
Billing and collections staff productivity was determined by measuring medical revenue collected per FTE billing and collections staff member. The average for NPB respondents in 2008 was $3.9 million, with a median of $3.2 million. Although these data were not reported in the NPB for 2007, data from the Oncology Circle for 2008 showed an average of $3.4 million, and this is a reasonable standard measurement of gross productivity in this department. Not addressed in the survey was the pressing issue of measuring bad debt. As practices continue efforts to increase efficiency, the ability to measure and manage the money that could be collected but is not collected will be of critical importance.
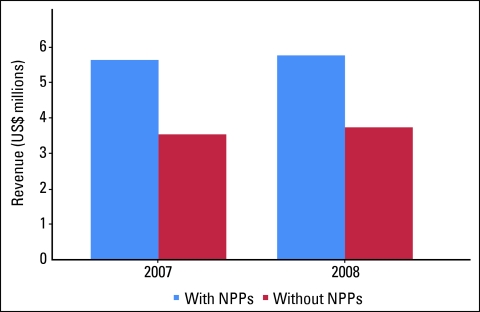
Data on use of NPPs were also collected. For 2007, 93 practices reported on this metric, and 62% reported utilizing NPPs in their practices. In 2008, practices utilizing NPPs increased to 73% of 104 reporting practices. There is great interest in NPPs in the oncology community and particular interest in if and how practice efficiency is affected by NPPs. Figure 6 shows the average revenue per FTE HemOnc physician for practices that work with NPPs and those that do not. These data were reported for 2007 (81 respondents) and 2008 (76 respondents) and continue to support efficiency gains, as measured by collections as the surrogate for work produced per medical oncologist. This trend is likely to continue as the demand among patients for oncology services increases as a result of the aging population and as the supply of oncologists grows more slowly.2
Figure 6.
Average revenue per full-time equivalent hematology/oncology physician. NPP, nonphysician practitioner.
Respondents to the 2009 NPB were asked to report on the scope of services offered by their practices. Medical oncology services were indicated by 93% of respondents, radiation oncology by 29%, gynecologic oncology by 10%, and surgical oncology by 12%. Thirty percent of practices indicated that imaging was part of their service line, 19% reported having a closed-door outpatient pharmacy, and 11% reported clinical research programs. The small number of practices reporting clinical research programs is striking. Comparative data are not available.
As demand for oncology services begins to outpace the supply of available oncologists, benchmarking this demand becomes increasingly important. New patient volume is one measure of demand and is important not only because of its relationship to these supply and demand concerns but also because new patient accrual drives clinical progress, provides the operational throughput necessary for efficient practice operations, and produces revenue to sustain practice viability.1 The authors have seen consistent growth in new patient volumes over the last decade and believe that this is an essential benchmark for practices to monitor. New patients per FTE HemOnc physician increased from a median of 308 and average of 361 in 2007 to a median of 339 and average of 378 in 2008.
Conclusion
The 2009 NPB reveals that so far, although rocked by the economic pressures of the past several years, most practices have been able to adapt and continue providing services to most patients. These adaptations include gains in efficiency, but they have been significantly funded through reductions in physician owner compensation. Significant productivity and business management improvements at the practice level are possible, are within the capability of many practices, and will be necessary to keep practices open and to slow or stop continued declines in physician owner compensation. In practices in which these improvements do not materialize, the business risk for physician owners will become higher than the potential for reward, and these physicians will either exit the field or seek arrangements to continue to provide oncology services at less personal risk.
Business and operational benchmarks such as those presented in this article continue to be valuable tools for day-to-day management of oncology practices but do not answer the questions being posed in ongoing national discussions of health care reform—questions about quality of care, comparative effectiveness, and outcomes, among others. At the practice level, these questions and others like them can only be answered when business and operational data are linked to clinical data in practice electronic medical records. Today there are a limited number of practices with fully functional electronic medical records, but that number is expected to increase over the next several years. When that happens, the true value of benchmarking—for both business purposes and patient care—will be optimized.
Authors' Disclosures of Potential Conflicts of Interest
The author(s) indicated no potential conflicts of interest.
Supplementary Material
References
- 1.Barr T, Towle E, Jordan W: The 2007 National Practice Benchmark: Results of a national survey of oncology practices. J Oncol Pract 4:178-183, 2008 [DOI] [PMC free article] [PubMed] [Google Scholar]
- 2.Erikson C, Salsberg E, Forte G, et al: Future supply and demand for oncologists. J Oncol Pract 3:79-86, 2007 [DOI] [PMC free article] [PubMed] [Google Scholar]
Associated Data
This section collects any data citations, data availability statements, or supplementary materials included in this article.


