Abstract
This study investigated a novel multi-electrode-array (MEA) design capable of long-term and highly selective recordings of axonal signals using PDMS microtunnels. We successfully grew neurons in culture so that only axons extended through narrow (10 µm wide by 3 µm high) and long (750 µm) microtunnels under which multiple electrodes were integrated. This permitted the recording of relatively large (up to 200 µV) electrical signals, including the propagation speed and direction of these travelling action potentials. To further demonstrate the operation of the device as a diagnostic tool for drug screening assays, the drug mepivacaine was applied in washout experiments. Here, we identified significant changes in mean spiking rate and conduction velocity.
Introduction
Planar MEAs are routinely used to record action potentials or “spikes” from cultured neurons. The recordable voltage potentials generally arise from cell bodies, rather than axons,1 because the quantity of the neural currents generated is directly proportional to the local cell-surface area.2 Mapping the exact origin of a biosignal to an individual cell body or neurite requires discrete and localized coupling to an electrode. As a rule of thumb, a spike must originate within 10 to 20 µm of an electrode to be of sufficient magnitude. This has prompted researchers to restrict cell body growth to the vicinity of electrodes to increase the probability of capturing spikes.3 Such improvements have increased overall spiking rates, but resolving signals from individual axons are still not commonplace because of their small size.
The additional capability to routinely record the smaller axonal signals, as well as to control their position, will be of significant interest for biomedical research and offer potential for drug screening. This will lead to better knowledge of the properties and biophysical mechanisms of action potential propagation.4–7 Also, the functional connectivity among small networks of neurons and directionality of the pre- and post-synaptic connections between neurons could be more easily identified.
In this report, we apply recently developed MEMS technology to a new MEA design to make possible the goal of recording from isolated bundles of axons. Campenot microfluidic tunnels8 of cross-section roughly 3 by 10 µm were implemented.9–11 Axons can be induced to grow through these tunnels in sufficient numbers to suggest that biomolecular studies of axonal mRNA, for instance, can be achieved. Highly localized elecrical coupling to these axons is made possible by positioning electrodes underneath the tunnels. In conjunction, the small size of the tunnel creates a very high series resistance (16 M Ω), thereby amplifying the signal (voltage) in a similar method as seen in nerve cuffs.12.
Our design follows the concept of constructing well-defined geometries of neuronal growth through chemical or physical confinement (i.e. aragose, polydimethylsiloxane (PDMS), or parylene material).13–15 Such confinement methods can be coupled with electrode arrays. For example, subpopulations of neurons with limited interpopulation communication can be achieved.16 Also, sparse populations of neurons have been cultured within slightly larger tunnel structures enabling detection of separated cell body vs. axon signals and their propagation.8,14 Also, chemical patterning over nano-transistors is shown to reveal signal propagation in great detail.17
This paper reports the overall design, fabrication techniques, culture preparation, drug application and analysis of the recorded signals. Demonstrated is a reusable prototype, the recording of propagating signals whose velocity can be measured and whose amplitude is enhanced by the microtunnels. Application of a drug mepivacaine, which blocks Na+ channels,18 was administered and showed that changes in velocity are inducible and measurable. Finally, the discussion emphasizes the unique potential use for the study of cultured neural networks.
Materials and Methods
Design
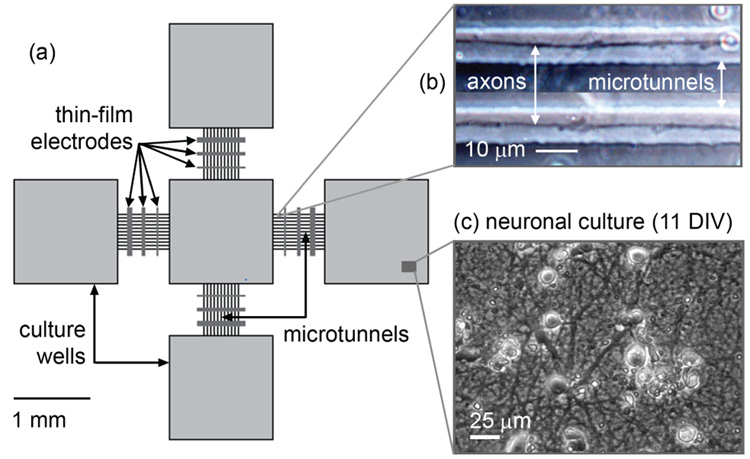
A configuration of five 1.5-mm square culture wells in a grid formation was designed (one center well and four on each side; see Fig. 1). The microstructure was fabricated with a PDMS layer (50 µm in height) bonded to a glass surface. Connecting the wells are four groups of 11 microtunnels, each 750 µm in length, 10 µm in width and 3 µm in height. The relatively small cross-sectional dimensions prevented cell bodies from entering the tunnels, restricting cellular growth inside them only to axons and dendrites.10 Surrounding the entire structure is a PDMS ring used to contain the culture bath. All culture wells are exposed to common growth medium.
Figure 1.
(a) Schematic of the design configuration. (b) Phase-contract image of axonal growth inside microtunnels. (c) Healthy neuronal growth inside culture well.
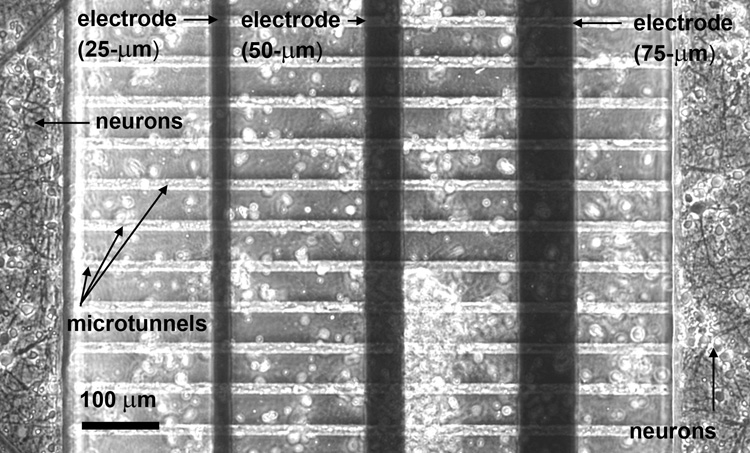
Three thin film gold electrodes spaced at a 200-µm pitch were patterned onto the glass substrate so as to lie at the bottom of each of the four groups of microtunnels (see Fig. 2). Three different widths, 25, 50 and 75-µm, were chosen to explore dependence of signal amplitude on electrode size. Their electrical properties and overall design criteria allow the sensing of action potential propagation along the axons. None of the electrodes were platinized or otherwise treated to reduce interface impedance.
Figure 2.
(a) Pictorial representation and (b) phase-contrast image of microtunnel archirtecture, electrode positions and neuronal growth. The electrodes are positioned underneath the PDMS layer. Axonal growth runs perpendicular to each electrode and is physically guided by the long and narrow microtunnels. During plating, neurons also land on top of the microtunnels (indicated by the white circles in (b)).
Microfabrication
MEA
The MEA was formed by chromium (20 Å) and gold (500 Å) evaporation onto 49-mm square glass substrates of soda-lime composition and 1-mm thickness (Erie Scientific, Inc.), and patterned using standard photoresist and chemical etching techniques.
Micro-mould
Dark-field transparency masks were used throughout (CAD/Art Services, Inc., Oregon, USA). Standard silicon wafers (3”, single-side polished) were pre-baked for 5 min at 150°C and ashed. Photoresist SU-8 2002 (Microchem, Inc.) was spun on at a nominal thickness of 3 µm, exposed for 48 sec through the microtunnel mask from a UV source at 6.0 mJ sec cm−2 and post-exposure baked at 95°C for 2 min. Then, the photoresist SU-8 2050 (Microchem, Inc.) was spun on at a nominal thickness of 50 µm, soft-baked at 95°C for 7 min and allowed to cool to room temperature. Next, the wafer was exposed for 24 sec with the culture well mask aligned to the microtunnels, post-exposure baked at 95°C for 6 min and allowed to cool. Finally, the wafer was developed for 4 min with gentle agitation with SU-8 developer (Microchem, Inc.).
PDMS
First, the surface was silanized in a desiccator for 2 hours from an evaporated (tridecafluoro- 1,1,2,2-tetrahydroocytl)-1-trichlorosilane solution in order to help release the mould from the master. Then, a mixture of PDMS/toluene (1:15) was spin-coated at 2100 rpm for 50 sec to a thickness no greater than 50 µm. The wafers were cured on a hot plate while the temperature was ramped from 60 to 90°C (120°C hr−1), held for 10 min, then lowered from 90 to 60°C (120°C hr−1) to avoid stress. Circular rings for the culture bath (12-mm o.d., 10-mm i.d.) were cut out from blocks of PDMS 3 mm high, then placed around the well structure and cured at 65°C for 3 hours. The structures were cut out and carefully peeled off the wafer and used within 1 hour. The MEA surfaces were ashed at 55 W for 30 sec. Immediately after, five drops of methanol were placed on the surface, allowing each PDMS piece to be easily positioned and finally aligned to the electrodes as the solution evaporated under a dissecting microscope. Finally, bonding was induced by heat using a hot plate at 60°C for 30 min.
Surface preparation
The following protocol was used to ensure adequate washout of toxins and therefore the greatest viability of long-term neurite growth within the PDMS microtunnels. Each surface was piranha etched (36 mL of 98% H2SO4 added to 60 mL of 30% H2O2) for 10 min, allowing only for minimal degradation to the PDMS layer. Then the devices were rinsed in distilled water (DI), blown dry with nitrogen and baked at 65°C for 10 min. To promote wetting, the devices were ashed for 30 sec at 55 W. Immediately after, poly-D-lysine (PDL) solution (100 µg ml−1, diluted in borate buffer at pH of 8.5) was physisorbed onto the surface and placed in an incubator overnight at 37°C regulated at 5% CO2. The following day surfaces were rinsed three times with sterile milli-Q H20 for 5 min each, followed by a 4-hour rinse and then a final overnight rinse to completely remove any non-physisorbed PDL from the microtunnels. Surfaces were kept submerged in sterile water and placed in the incubator up to 3 days before plating.
Culture Preparation
The established protocol of culturing neurons is as reported in the literature19 and approved by the University of Illinois. Embryonic day 18 (E18) rat cortical tissue was purchased from BrainBits, Inc. (Springfield, Illinois, USA) and dissociated according to the vendor’s protocol. The cells were re-suspended in Neurobasal™/B27/GlutaMAX™ (Invitrogen, Inc.) growth medium and plated at 600 cells mm−2. Cells landed inside the growth wells and on the PDMS. As a control, cells were additionally plated on coverglass in 6-well plates. After every 3 to 5 days, half of the conditioned medium was exchanged with fresh medium. Each MEA was placed in a separate Petri dish filled with 5 mL of sterilized water, minimizing evaporation of the medium.
Cleaning and re-usage
To clean the devices, the culture medium was replaced with 70% ethanol to kill the cells. Then the bath was rinsed in DI water and replaced with a 1% Tergazyme™ solution and placed at 8°C overnight to break down the tissue. The bath was rinsed in DI water overnight and then prepared as described in the surface preparation protocol. Devices were reused up to five times.
Drug experiments
Three experiments were performed, each with an individual cultured MEA at 10 to 14 DIV. Recordings were made before the addition of the drug, during drug dosage and after washout of the drug. On the day of recording, stock solutions of the drug were made in Neurobasal medium and warmed to 37°C at 7.4 pH. To begin the experiment, the culture medium was replaced with fresh Neurobasal solution to nullify effects of the conditioned medium. The spiking activity was recorded for 2 minutes as the control condition. Next, 200 µl of medium was removed by pipette and replaced with the stock solution to total 400 µl with a drug concentration of 1 mM. The addition of the drug at this concentration immediately suppressed all activity. The drug condition started once some activity recovered after washing out half the medium 6 or 8 times at 30 sec intervals, effectively reducing the concentration to 16 or 4 µM. Lastly, the initial spike rate was regained after two additional washouts, and the resulting activity recorded for the washout condition.
Data acquisition and analysis
Cultures on arrays were placed in the holder of a commercial data-acquisition system (MultiChannelSystems, Inc.). To maintain proper pH of the culture medium, a canister was placed over the device with a 5% CO2/10% O2/85% N gas mixture flowing inside the unit at 3 lbs in−1. A heating element underneath the device regulated the temperature to 37°C. The MCS Rack v3.5.5 data acquisition software was used with A/D conversion set at a 50-kHz sampling rate with a voltage input range of ±819 mV. The raw signals from all 12 microchannel electrodes were recorded.
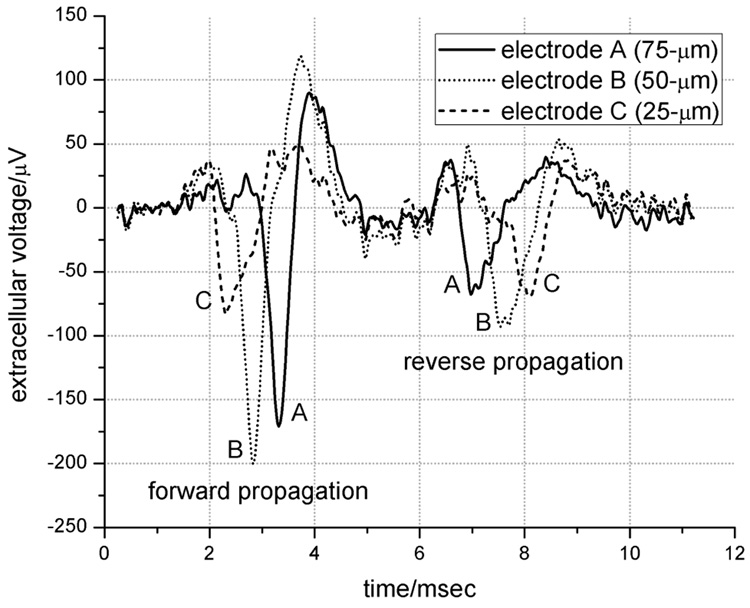
For viewing and graphing the data, Clampfit v9.2 (Molecular Probes, Inc.) software was used (see Fig. 3). Next, the data was directly imported into Offline Sorter v2 software (Plexon, Inc.). All spikes from the middle “reference” electrode with negative amplitudes greater than six standard deviations from the noise level were selected. Waveform detection length was set to 4 msec, with a 1.6-msec pre-threshold length and a 2.4-msec dead-time. Waveforms from each experimental condition (control, drug and washout) were automatically clustered together using the valley-seeking algorithm using three principal components. Typically, two to six clusters of waveforms, assumed to correspond to distinct neuron “units”, were distinguishable in most experimental conditions.
Figure 3.
Enhanced extracellular recording of an action potential. The two independent spikes (found by chance) propagate in opposite directions. The forward propagation timing is from electrode C to B to A, and vice-versa for the reverse direction. The background noise level is 15 µV P-P.
To match neuronal units as originating from the same axon in control, drug and washout conditions, we compared recorded waveforms and took as identical axons those whose signals varied no more than 12 µV rms from each other. (This assumes that the variation by condition is much less than the variation due to different axon identity.) Using Neuroexplorer v4 (Nex Technologies, Inc.), a crosscorrelogram analysis on the sorted data was done for all combinations of two units on different electrodes. This was used to identify highly correlated units and their delay times. Statistical analysis (SAS v9.1) was used to discard pairs of units with non-normal delay time distributions (p>0.05 for either Kolmogorov-Smirnov or Shapiro-Wilk). Mean conduction velocity was inter-electrode distance (200 µm) divided by the mean delay time. To test whether velocity changed with drug treatment, the student’s t-test was performed in order to reject the null hypothesis (|t|≥1.96, 95% confidence interval).
Results
Electrode Impedance
Four impedance measurements were taken for each electrode size, each measurement from a different set of microtunnels (10 mV @ 1 kHz; see Table 1). Two clean and one of the cultured MEAs, were compared to investigate the effect of cellular growth on impedance.
Table 1.
Theoretical and measured electrode impedance
| Minimum distance to open chamber (µm) |
Electrode Size (µm) |
R1 (MΩ) short path |
R2 (MΩ) long path |
R1‖R2 (MΩ) parallel |
11 parallel R1‖R2 (kΩ) |
MEA #1 (clean) |
MEA #2 (clean) |
MEA #3 (cultured) |
|---|---|---|---|---|---|---|---|---|
| 137.5 | 75 | 3.3 | 12.9 | 2.6 | 239 | 322±19kΩ, 6±2° | 291±9kΩ, 6±0° | 963±284kΩ, 18±11° |
| 162.5 | 25 | 3.9 | 13.5 | 3.0 | 275 | 417±32kΩ, 12±3° | 353±17kΩ, 11±1° | 1263±185kΩ, 19±2° |
| 350 | 50 | 7.8 | 7.8 | 3.9 | 355 | 507±18kΩ,7±1° | 424±36kΩ, 9±4° | 1663±38kΩ, 14±2° |
The resistance through a conductive tunnel can be modeled as a simple rectangular tube: R = σ L / (WxH), where the conductivity σ was that of phosphate buffered saline (72 Ω·cm), the width W = 10 µm, the height H = 3 µm, and the length L = 750 µm. This leads to a value of 15.6 MΩ for the entire tunnel. To compare to the resistance data in Table 1, note that each electrode sees two resistive parallel paths running toward opposite culture wells at ground potential. The three possible lengths L between the tunnel entrance and the center of the electrode are: 175 µm (short path), 575 µm (long path) and 375 µm (center). Further, each electrode intersects all 11 tunnels; hence each electrode sees (1/11)th of the resistance of an individual tunnel. As discussed below the measures are consistent with the model except when the tunnel is filled with axonal tissue.
Culture
A total of 31 MEAs were tested, 25 of them were healthy and survived for 3 to 6 weeks. The morphology of the neurons cultured on the device was identical to unconstrained cultures on coverglass controls. The dense cell populations inside the wells made growth conditions suitable for extended time periods. Medium exchanges were not necessary after a 2 week culture maturation stage. The prolonged usage of the medium may have been caused by a significant reduction in normal toxic ammonium levels, due to the substitution of glutamine for GlutaMAX as indicated from the product literature.
Axons freely extended into the microtunnels as early as 48 hours after plating, as evidenced in Fig. 2b. They grew in both directions in equal proportion, to the point of either reaching the adjacent culture well within 5 to 6 days, or colliding with processes growing in the opposing direction. This observation was further verified by the observance of bi-directional signal propagation in Fig 3.
Of the 25 healthy cultures 21 were electrically active. Spike rates between 3 and 22 Hz were recorded (11 microtunnels to each electrode) from at least one microtunnel group. The background noise of the electrodes ranged from 10 to 50 µV P-P. Spike amplitude was typically peaking between 100 and 200 µV, with a maximum of 220 µV. Cultures at 10 to 14 DIV exhibited synchronous bursting activity from all active electrodes, indicating that all culture wells were synaptically interconnected. The activity changed from predominant bursting patterns into continuous trains of single-unit spikes immediately after a media exchange. Isolated spikes within a train were much more easily distinguished than those within bursts.
Drug trials
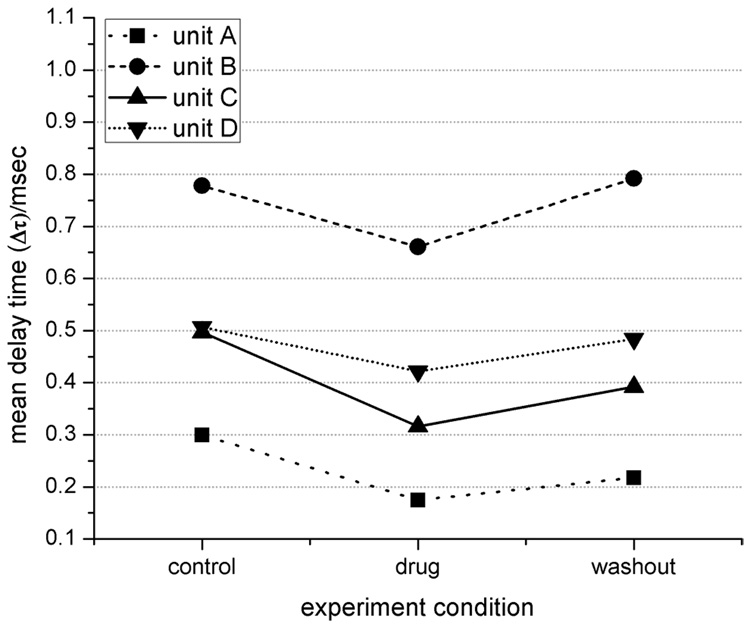
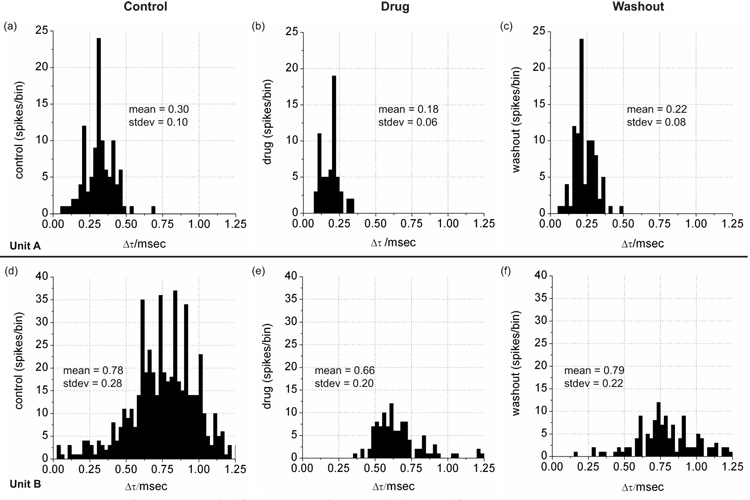
For the three mepivacaine trials (one MEA per trial), the total number of identified distinct waveforms were: 16, 6 and 10 for the control, drug and washout conditions respectively. In one trial, five discrete neural units were detected throughout all conditions, which allowed the monitoring of changes in propagation delay time based on drug dosage and washout. Overall, the drug induced a significant decrease in delay time in four cases (student’s t-test, p≤0.05) implying a significant increase in conduction velocity. Washing out the drug tended to reverse the effect back to the original value (see Fig. 4). In Fig. 5, data from two of these units are shown and indicate the variability of the change in distribution and mean value in delay time (Δt).
Figure 4.
Propagation delay time (Δt) of 4 units for each condition. A decrease in Δt indicates an increase in conduction velocity, and visa-versa. Units labeled A and B correspond to data in Fig 5.
Figure 5.
Histograms of the delay time (Δt) frequency data (bin size = 0.025 msec) for units labeled A and B Propagation speed over the 200-µm electrode separation distance is inversely related to delay time and varies between approximately 0.2 and 0.8 meters sec−1 (b,d).
Discussion
The small phase angle of 6 to 12° implies that the impedance is largely resistive, unlike electrodes from conventional MEAs. The dominant impedance component is the resistance within the long and narrow microtunnel, whereas most microelectrodes are dominated by the more capacitive electrode-electrolyte interface coupled with a smaller spreading resistance. For instance, the middle electrodes have the largest impedance, consistent with their longer resistive paths to ground but inconsistent with their intermediate (of the three electrodes) surface area that normally would predict total impedance.
The measured electrode impedance values from clean MEAs were only a factor of 1.5 larger from the theoretical calculations, and most likely due to slight decreases in cross-section from tolerance in fabrication. When neurites had grown into the tunnels, resistance increased up to a factor of 4. Thus, the channel resistivity was nearly 300 Ω-cm compared to 72 Ω-cm for saline solution, indicating a reduction in effective conductive cross-section. This suggests that the tunnels are filled, as brain tissue has a resistivity that is roughly five times that of cerebro-spinal fluid20.
Thespike amplitudes were larger than expected from axons. Spike amplitudes measured from somas from MEAs are most often in the range of 10 to 100 µV.21 Therefore, spike detection and analysis is routinely possible using these large signals with relatively small background noise.
The question arises as to why the axonal signals are larger and whether or not the magnitude of the signals is expected. We estimate the peak current of an action potential to be 1 mA cm−2 (see Appendix), yielding 3 nA for a 10-µm diameter soma, and a 45 µV signal (if it sees a 15 kΩ spreading resistance in an infinite volume22). We scaled results from Clark and Plonsey,23 wherein a 120-µm diameter, 10 meters sec−1 velocity crayfish axon has a net current of approximately 1 µA over a 1-mm long active region at the leading edge of the action potential (from Fig. 5 of Clark and Plonsey).24 For the present case, a 1-µm diameter axon25 would have a propagation speed of 1 meter sec−1, a 100-µm long active region and a net current of 0.8 nA. When inserted into a 15 kΩ spreading resistance (infinite volume), the signal would be 12 µV, a level not likely to be detected. If inserted into the 3 MΩ resistance from the center of the tunnel, the signal would be 2.4 mV, which would be reduced to 220 µV over the 11 parallel electrodes. Thus, amplitudes in the range of up to 200 µV appear reasonable. Further confirmation comes also from Clark and Plonsey, who modeled the signals from an axon within an insulating nerve trunk,24 and found mV level signals, even to nearly 10 mV, with the 300 Ω-cm resistivity that can be inferred for our recordings. There were differences in action potential amplitude at the three electrodes which were somewhat dependent on electrode size and distance from the nearest chamber and hence microtunnel resistance. Smaller signals (up to 120 µV) originated from the smallest electrode, while the middle and large electrodes produced larger signals.
Axonal propagation speed could be detected using the procedures developed, including correlation to identify action potentials propagating along separable neural units. From all the experiments, the conduction velocities of the units from control condition (N=23) ranged from 0.18 to 1.14 meters sec−1. Furthermore, all measurements have been generated from random spiking activity of the cell culture. It is difficult to determine if the geometry of the microtunnel affects the propagation velocity. However, these values recorded here are of the same magnitude as those from the literature. For example, the velocity of unmyelinated human nerve fibers was reported from 0.93±0.09 meters sec−1.4 Also, velocity measurements from cortical geniculate afferents were noted at 0.18±0.04 meters sec−1.26
The application of the drug mepivacaine to the culture medium verified that changing conduction velocity and spike rate by simple drug application is possible. However, the results were somewhat unexpected since the speed initially increased. The drug mepivicaine, which blocks sodium channels, was expected to slow the conduction velocity due to reduced sodium current needed to depolarize portions of the axon membrane ahead of the propagating action potential. An alternate explanation is that the drug, especially during recovery, blocks a fraction of the channels completely and in effect creates a saltory conduction pattern wherein the speed paradoxically increases, until such time as all channels return to normal and conduction velocity once again slows. Testing for this effect is beyond the scope of this study.
Conclusions
We have utilized MEMS technology to extend current MEA functionality by allowing high-yield selective recording of axonal action potentials in culture. The precise control of tunnel width, height and length results in two critical properties: (1) an open path largely permissive to axons and omissive to cell bodies, and (2) a high resistance pathway that permits amplification of the axonal signal. The first property has been shown before, although only in much shorter experiments lasting a few days.27 Here we were able to maintain the culture for several weeks. Taking advantage of the second property has not, to our knowledge, been reported before.
There are clear uses of this MEMS technology. It can easily be combined with commercially available MEAs and hence rapidly promulgated. The MEMS microwell technology, already established, now permits a model of neural networks wherein a pool of neurons within the well mimic a ganglion and the axons in the tunnel mimic a commisural pathway. Each is separately recordable and stimulatable, providing distinct records of input, communicated information, and output. Prospectively, establishing a certain degree of connective polarization between the sub-cultures is an explorable and enticing option. This can be accomplished by plating cells at different times, so that axons grow toward wells plated with few or no cells. We anticipate further experimentation to study how extending axons would interact with cultures of different cells or subpopulations and environments. Thus, this technology extends the scope of in-vitro communication models.
This device enables measurement of action potential velocity under controlled conditions, analogous to neurological measures on whole nerve. The addition of MEMS-based drug delivery systems can extend the capabilities of the device. For example, additional physical pathways running perpendicular along the tunnels could allow enhanced diffusion or provide an active transport mechanism of drug into the microtunnels. This arrangement will provide a more accurate way of monitoring the concentration of drug present in the tight pathways to be used as a novel screening device for neuroactive agents.
Supplementary Material
Acknowledgments
The authors would like to thank Rudy Scharnweber, David Khatami, Kate Musick, Frank Sommerhage and Kush Paul for their advice. This work was supported in part by National Institutes of Health research grant PHS 1 R01 NS052233 A.
Appendix
Estimate of current through a patch of neural membrane
Assumptions: Hodgkin-Huxley parameters, peak current occurs at Vm=0.
Conductances28: gNa = 25 mS cm−2 and gK = 3 mS cm−2
Reversal Potentials29: ENa = +50 mV and EK = −77 mV
Current densities:
(iNa)Vm=0 = gNaENa = 25 mS cm−2 × +50 mV = 1.25 mA cm−2
(iK)Vm=0 = gKEK = 3 mS cm−2 × −77 mV = −0.23 mA cm−2
Net inward current density:
1.25 mA cm−2 − 0.23 mA cm−2 = 1.02 mA cm−2
References
- 1.van Pelt J, Wolters PS, Corner MA, Rutten WLCA, Ramakers GJAA. Biomedical Engineering, IEEE Transactions on. 2004;51:2051–2062. doi: 10.1109/TBME.2004.827936. [DOI] [PubMed] [Google Scholar]
- 2.Buitenweg JR, Rutten WLC, Marani E. Biomedical Engineering, IEEE Transactions on. 2002;49:1580–1590. doi: 10.1109/TBME.2002.805555. [DOI] [PubMed] [Google Scholar]
- 3.Nam Y, Chang J, Khatami D, Brewer GJ, Wheeler BC. IEE Proc Nanobiotechnol. 2004;151:109–115. doi: 10.1049/ip-nbt:20040706. [DOI] [PubMed] [Google Scholar]
- 4.Kondo M, Iwase S, Mano T, Kuzuhara S. Muscle & Nerve. 2004;29:128–133. doi: 10.1002/mus.10490. [DOI] [PubMed] [Google Scholar]
- 5.Meeks JP, Mennerick S. Journal of Neuroscience. 2004;24:197–206. doi: 10.1523/JNEUROSCI.4845-03.2004. [DOI] [PMC free article] [PubMed] [Google Scholar]
- 6.Meeks JP, Mennerick S. Journal of Neurophysiology. 2007;97:3460–3472. doi: 10.1152/jn.01288.2006. [DOI] [PubMed] [Google Scholar]
- 7.Crotty P, Sangrey T, Levy WB. Journal of Neurophysiology. 2006;96:1237–1246. doi: 10.1152/jn.01204.2005. [DOI] [PubMed] [Google Scholar]
- 8.Campenot RB. Journal Of Neurobiology. 1994;25:599–611. doi: 10.1002/neu.480250603. [DOI] [PubMed] [Google Scholar]
- 9.Park JW, Vahidi B, Taylor AM, Rhee SW, Jeon NL. Nat. Protocols. 2006;1:2128–2136. doi: 10.1038/nprot.2006.316. [DOI] [PubMed] [Google Scholar]
- 10.Taylor AM, Rhee SW, Tu CH, Cribbs DH, Cotman CW, Jeon NL. Langmuir. 2003;19:1551–1556. doi: 10.1021/la026417v. [DOI] [PMC free article] [PubMed] [Google Scholar]
- 11.Ravula SK, Wang MS, Asress SA, Glass JD, Frazier AB. Journal of Neuroscience Methods. 2007;159:78–85. doi: 10.1016/j.jneumeth.2006.06.022. [DOI] [PubMed] [Google Scholar]
- 12.Veraart C, Grill WM, Mortimer JT. IEEE Transactions On Biomedical Engineering. 1993;40:640–653. doi: 10.1109/10.237694. [DOI] [PubMed] [Google Scholar]
- 13.Morin F, Nishimura N, Griscom L, LePioufle B, Fujita H, Takamura Y, Tamiya E. Biosensors & Bioelectronics. 2006;21:1093–1100. doi: 10.1016/j.bios.2005.04.020. [DOI] [PubMed] [Google Scholar]
- 14.Suzuki I, Sugio Y, Jimbo Y, Yasuda K. Japanese Journal of Applied Physics Part 2-Letters. 2004;43:L403–L406. [Google Scholar]
- 15.Tooker A, Meng E, Erickson J, Tai YC, Pine J. IEEE Engineering in Medicine and Biology Magazine. 2005;24:30–33. doi: 10.1109/memb.2005.1549727. [DOI] [PubMed] [Google Scholar]
- 16.Berdondini L, Chippalone M, van der Wal PD, Imfeld K, de Rooij NF, Koudelka-Hep M, Tedesco M, Martinoia S, van Pelt J, Le Masson G, Garenne A. Sensors and Actuators B-Chemical. 2006;114:530–541. [Google Scholar]
- 17.Patolsky F, Timko BP, Yu GH, Fang Y, Greytak AB, Zheng GF, Lieber CM. Science. 2006;313:1100–1104. doi: 10.1126/science.1128640. [DOI] [PubMed] [Google Scholar]
- 18.Lipkind GM, Fozzard HA. Mol Pharmacol. 2005;68:1611–1622. doi: 10.1124/mol.105.014803. [DOI] [PubMed] [Google Scholar]
- 19.Brewer GJ. Journal Of Neuroscience Methods. 1997;71:143–155. doi: 10.1016/s0165-0270(96)00136-7. [DOI] [PubMed] [Google Scholar]
- 20.Geddes LA, Baker LE. Medical & Biological Engineering. 1967;5:271–293. doi: 10.1007/BF02474537. [DOI] [PubMed] [Google Scholar]
- 21.Potter SM. Progress in Brain Research. 2001;130:49–62. doi: 10.1016/s0079-6123(01)30005-5. [DOI] [PubMed] [Google Scholar]
- 22.Kovacs GTA. In: Enabling Technologies for Cultured Neural Networks. Stenger DA, McKenna TM, editors. San Diego, CA: Academic Press; 1994. pp. 121–162. [Google Scholar]
- 23.Plonsey R. Bioelectric Phenomena. New York: McGraw-Hill; 1969. [Google Scholar]
- 24.Clark J, Plonsey R. Biophysical Journal. 1968;8:842–864. doi: 10.1016/S0006-3495(68)86524-5. [DOI] [PMC free article] [PubMed] [Google Scholar]
- 25.Peters A, Proskaue C, Kaiserma I. Journal of Cell Biology. 1968;39 doi: 10.1083/jcb.39.3.604. 604-&. [DOI] [PMC free article] [PubMed] [Google Scholar]
- 26.Colombe JB, Ulinski PS. Journal of Computational Neuroscience. 1999;7:71–87. doi: 10.1023/a:1008971628011. [DOI] [PubMed] [Google Scholar]
- 27.Claverol-Tinturé E, Cabestany J, Rosell X. IEEE Transactions on Biomedical Engineering. 2007;54:331–335. doi: 10.1109/TBME.2006.880903. [DOI] [PubMed] [Google Scholar]
- 28.Hille B. Ion Channels of Excitable Membranes. Sunderland, MA: Sinauer Associates; 2001. pp. 25–59. [Google Scholar]
- 29.Gerstner W, Kistler W. Spiking Neuron Models: Single Neurons, Populations, Plasticity. Cambridge: Cambridge University Press; 2002. [Google Scholar]
Associated Data
This section collects any data citations, data availability statements, or supplementary materials included in this article.


