Abstract
Methotrexate [MTX] is an anticancer agent that is widely used in a variety of human cancers including primary central nervous system lymphoma [PCNSL]. Important pharmacological properties that directly bear on the use of MTX in PCNSL, such as mechanisms that govern its uptake into brain tumors, are poorly defined, but are amenable to investigation in mouse models. In order to pursue such preclinical pharmacological studies, a rapid and sensitive liquid chromatography‐tandem mass spectrometry [LC/MS/MS] method for the determination of MTX and its metabolite, 7‐hydroxymethotrexate [7‐OH MTX] in plasma and microdialysate samples from brain tumors and cerebrospinal fluid [CSF] is needed. The plasma assay was based on 10 µl samples and following a protein precipitation procedure enabled direct injection onto a LC/MS/MS system using positive electrospray ionization. A column switching technique was employed for desalting and the clean‐up of microdialysate samples from brain tissues.
The methods were validated for MTX and 7‐OH MTX in both plasma and microdialysate samples from brain tumor and CSF, and produced lower limits of quantification [LLOQ] in plasma of 3.7 ng/ml for MTX and 7.4 ng/ml for 7‐OH MTX, and in microdialysate samples of 0.7 ng/ml for both MTX and 7‐OH MTX. The utility of the method was demonstrated by estimation of pharmacokinetic [PK] and brain distribution properties of MTX and 7‐OH MTX in conscious mice. The method has the advantages of low sample volume, rapid clean‐up, and the simultaneous measurement of MTX and 7‐OH MTX in plasma and brain tissues allowing detailed PK studies to be completed in individual mice.
Keywords: Methotrexate [MTX], 7‐hydroymethotrexate [7‐OH MTX], primary CNS lymphoma [PCNSL], LC/MS/MS, pharmacokinetic, brain tumor, cerebrospinal fluid, microdialysis, column switching
1. Introduction
MTX [Fig 1] is a folic acid antagonist and has been in clinical use for five decades. Its use in patients with brain tumors is primarily confined to PCNSL in which it is the cornerstone of chemotherapy [1]. In addition to the clinical use of MTX, it is the subject of many preclinical investigations pertaining to its interesting pharmacological properties. One area of interest that is pertinent to its use in PCNSL is the cellular mechanics that control the uptake and accumulation of MTX in the central nervous system [CNS]. MTX is a substrate for certain members of the ABC transporter family, which serve as drug efflux pumps that can alter MTX’s pharmacokinetic properties and the associated sensitivity of tumor cells [2–4]. As some of these transporters are located on the blood‐brain barrier [BBB] and blood cerebrospinal fluid barrier [BCSFB], barriers that often limit drug accumulation in brain [5,6], they may also influence MTX’s CNS accumulation. In addition to these anatomic barriers, drug efflux pumps also operate in tumor cells and may be a contributing factor to a drug resistance phenotype by their ability to limit access of the drug to the intracellular space [7]. Thus, to facilitate the exploration of the determinants of MTX’s CNS distribution in preclinical tumor models, we developed a sensitive LC/MS/MS method based on the use of small sample volumes.
Fig. 1.
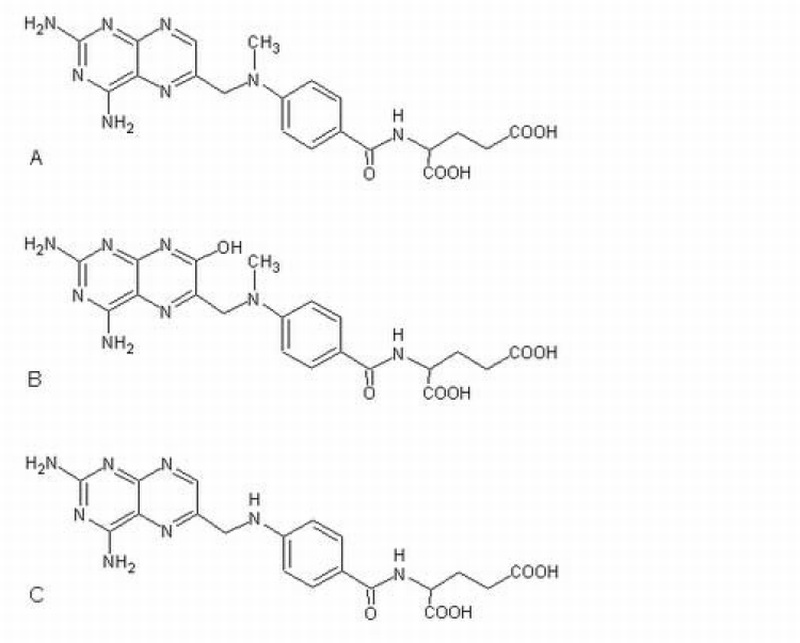
Chemical structures of MTX (A), its metabolite 7‐OH MTX (B), and the internal standard, aminopterin (C).
As one can appreciate due to the longevity of MTX as an anticancer drug there have been numerous HPLC methods to determinate MTX in biological specimens. Most often these methods utilize either liquid‐liquid extraction or solid phase extraction for sample clean‐up with either UV or derivative fluorescence detection [8–16]. Since most of these methods were developed for human samples, relatively large volumes [i.e. > 0.1 ml] of plasma were needed to achieve the desired sensitivity limit. There are a limited number of methods reported for the quantitation of MTX in preclinical samples [17,18]. An HPLC method devised for rats and mice, which required 50 µL of plasma and precolumn derivitization, afforded a limit of quantitation for MTX of 25 ng/ml [18]. This assay allowed about 6 timed samples to be collected from a single animal [19] without causing blood volume depletion, possibly too few to accurately characterize MTX’s pharmacokinetic properties. Measurement of MTX in human plasma by LC/MS/MS has yielded improved sensitivity limits of 0.5 ng/ml, based upon a 200 µl plasma sample and a liquid‐liquid extraction procedure [20], and 5 ng/ml, based upon 20 µl plasma and a solid‐phase extraction procedure [21]. An LC‐MS assay for MTX based on small sample sizes [i.e. < 20 µL] that could be applied to conducting comprehensive pharmacokinetic studies in rodents has not been described. In order to characterize MTX’s brain distribution new analytical methods were required to measure MTX and 7‐OH MTX in small volumes of microdialysis samples from brain. Therefore, our goal was to develop a sensitive LC/MS/MS method, which enabled the complete pharmacokinetic profile of MTX and 7‐OH MTX to be determined in plasma and brain microdialysis samples from individual mice.
2. Experimental
2.1. Chemicals and reagents
MTX [99.0 %], aminopterin, dimethyl sulfoxide [DMSO], ammonium formate and formic acid were purchased from Sigma‐Aldrich, Inc [St Louis, MO, USA]. 7‐OH MTX was purchased from Schircks Laboratories [Jona, Switzerland]. HPLC‐grade acetonitrile and methanol were purchased from Fisher Chemicals [Fair Lawn, New Jersey, USA]. Purified water [Nanopure deionization system, Barnstead / Thermolyne, Dubuque, IA, USA] was used for all aqueous solutions. Drug‐free mouse plasma was purchased from Lampire Biological laboratories [Pipersville, PA, USA].
2.2. Preparation of stock solutions, calibration standards and quality control samples
Standard stock solutions of MTX were prepared in 50% methanol at a concentration of about 62 µg/ml and stored at −20 °C. Standard stock solutions of 7‐OH MTX were prepared in water containing 4% DMSO at a concentration of approximately 75 µg/ml and stored at −20 °C. Stock solutions of the internal standard, aminopterin, were prepared at approximately 56 µg/ml in methanol containing 4% DMSO and stored at −20 °C. The working solutions of internal standard were prepared fresh daily by diluting aliquots of the stock solution to approximately 3 ng/ml with methanol for plasma, and to approximately 8 ng/ml with 0.2% formic acid containing 0.3% ascorbic acid for microdialysate samples.
To prepare calibration standards, aliquots of stock solutions of MTX and 7‐OH MTX at final methanol concentrations of less than 5% were added to mouse plasma, and then diluted serially with mouse plasma to achieve concentration ranges from 1.3 ng/ml to 1042 ng/ml for MTX, and from 2.6 ng/ml to 2055 ng/ml for 7‐OH MTX. Quality control samples were prepared separately in an analogous manner as the calibration standards over concentration ranges from 3.7 to 980 ng/ml for MTX and from 7.4 to 1986 ng/ml for 7‐OH MTX, and were assayed in triplicate on each day that samples were analyzed. Calibration curves were obtained by weighted [weight factor = 1/x²] least‐squares linear regression of the peak area ratio of either MTX or 7‐OH MTX to aminopterin versus the MTX or 7‐OH MTX concentration. Calibration and QC samples were stored at −80 °C.
Microdialysis calibration standards were prepared in artificial cerebrospinal fluid [aCSF, 131.9 mM NaCl, 3mM KCl, 1.1 mM MgCl2, 1.35 mM CaCl2·H2O, 20 mM NaHCO3 and 0.242 mM Na2HPO4·7H2O.] by serial dilution of stock solutions of MTX and 7‐OH MTX with aCSF to obtain MTX and 7‐OH MTX concentrations in the range of 0.27 – 407 ng/ml and of 0.26 – 402 ng/ml, respectively. Quality control microdialysis samples were prepared separately in an analogous manner as for the calibration standards at concentrations that ranged from 407 to 0.67 ng/ml for MTX and from 402 to 0.66 ng/ml for 7‐OH MTX, and were assayed in triplicate on each day that samples were analyzed. All samples were stored at −80 °C.
2.3. Sample preparation
Plasma
To 10 µl of plasma, 40 µl of the internal standard working solution [3 ng/ml] in methanol was added and vortexed for 1 min followed by centrifugation at 18,000 × g for 3 min. Twenty microliters of the supernatant were mixed with 100 µl of water by vortex, and 30 µl aliquots of the resultant mixture were injected onto the LC/MS/MS system. For concentrations of MTX over 1000 ng/ml, samples were diluted with blank plasma before analysis.
Microdialysis samples
To 15 µl of each microdialysis sample, 30 µl of internal standard working solution [8 ng/ml] in 0.2% formic acid containing 0.3% ascorbic acid was added and vortexed for 10 seconds. Twenty microliters aliquots of the mixture were injected onto a column switching LC/MS/MS system.
2.4. LC/MS/MS System and Conditions
The LC/MS/MS configuration was analogous for plasma and microdialysis sample analysis except that a column switching set‐up was employed for microdialysis samples. For plasma samples, the analytical column effluent was directly introduced into the LC/MS/MS, which consisted of an Agilent 1100 HPLC system [Agilent Technologies, Waldbronn, Germany] and an API 4000 MS/MS system [Applied Biosystems/MDS SCIEX, Concord, Ontario, Canada] using electrospray ionization in positive ion scan mode. Chromatographic separation was achieved by using a mobile phase of acetonitrile:1 mM ammonium formate containing 0.1% formic acid [18∶82, v/v] and delivered at a flow rate of 0.2 ml/min through a guard cartridge [C18, 4.0 × 2.0 mm, Phenomenex, Torrance, CA] and analytical column [Phenomenex, Luna 3u C18 (2) 100A, 3 µm particle size, 50 × 2.0 mm]. The column temperature was maintained at 35 °C. The column effluent was monitored at the following transitions: MTX m/z 455.4→308.0; 7‐OH MTX 471.0→324.2, and aminopterin 441.1→294.3 with a dwell time of 800 ms for each channel. Both the spray gas and turbo gas were nitrogen set at 55 psi. The curtain gas and collision gas, also nitrogen, were set at 20 and 5 psi, respectively. The ion spray voltage was set at 3500 V and the temperature was set 550 °C. The collision energies for collision induced dissociation for the aforementioned transitions were 27.4, 17.6 and 28 volts, for MTX, 7‐OH MTX, and aminopterin, respectively. The instrument was controlled by the Analyst 1.4 [Applied Biosystems/MDS SCIEX] computer program.
For microdialysis samples, a switching valve [Valco valve 10 port 2 position, VICI Valco Instruments Co Inc, Houston, Texas] was used to connect the analytical and pretreatment columns in a way that allowed separate mobile phases to perfuse each column with the analytical column effluent going to the LC/MS/MS interface and the pretreatment column effluent going to waste. A guard column [C18, 4.0 × 2.0 mm ID, Phenomenex] was used as the pretreatment column that was perfused with 0.1% formic acid at a flow‐rate of 0.2 ml/min. The analytical column and mobile phase were the same as mentioned above for plasma samples. A single sample analysis cycle consisted of the following steps: a) sample injection onto the pretreatment column with a 1 min wash period [eluent to waste]; b) automatic switch to connect the pretreatment and analytical columns for 1.9 min with a forward flush by the analytical mobile phase [eluent to the mass spectrometer]; c) a final wash cycle [valve automatically switched back to the original position in which the pretreatment column is flushed with 0.1% formic acid for 0.7 min].
2.5. Evaluation of Matrix Effects
Matrix effects were evaluated for microdialysis sample analyses using two different studies. First, relative matrix effects (ME%) were calculated as the ratio (B/A × 100) of the peak area of known amounts drug standards added to batches of blank dialysate (B) [three batches from CSF and three from brain tumor] to the peak area of the same amounts of standards added to aCSF (A). A value of 100% indicates the absence of a matrix effect, whereas values greater than 100% indicate signal enhancement, and values less than 100% indicate signal suppression. In the second set of studies, MTX and 7‐OH MTX were added to blank CSF and brain tumor dialysate samples collected from mice that did not receive MTX, and processed for drug measurement using aCSF as the medium for the calibration standards. From the measured and added drug concentrations the percentage accuracy was calculated and used to indicate the suitability of using aCSF for the preparation of calibration and quality control standards.
2.6 Method validation
The precision and accuracy of the assay was based on analyses of both plasma and aCSF containing known concentrations of drugs. Plasma and aCSF quality control samples were included within the ranges of all calibration curves and processed in triplicate. The intra‐day and inter‐day means, standard deviations, % biases, and percentage coefficients of variations [%CVs] were calculated by standard methods. The LLOQ in plasma and microdialysis samples was defined as the lowest concentration at which the signal‐to‐noise peak height ratio was greater than 5∶1, and both intra‐day and inter‐day %CVs and % biases were less than 20%.
The specificity of the assay for MTX and 7‐OH MTX in plasma was evaluated using different batches of commercial mouse plasma as well as plasma collected from different strains of mice. The specificity for MTX and 7‐OH MTX was also evaluated in blank samples collected by microdialysis from brain tumors and the lateral ventricle in mice that did not receive MTX.
2.7. Method application
The analytical method was subsequently used to analyze samples from pharmacokinetic studies in mice bearing intracerebral tumors. C57BL/6 mice had implanted intracerebrally B‐16 melanoma cells, a brain tumor model we previously used [22], about 7 – 10 days prior to entering the pharmacokinetic studies. At the time of tumor cell implantation, mice also had implanted two microdialysis guide cannulas [CMA/7], one in the brain tumor located at the site of the B16 cells implantation [0.34 mm posterior and 2.5 mm lateral to the bregma at a depth of 3 mm in the right hemisphere], and the other in the ventricle [posterior 0.34 mm and 1 mm lateral to the bregma at a depth of 2 mm in the left hemisphere]. About 48 hr before the pharmacokinetic study, mice were implanted with a jugular vein and a right carotid artery cannula for drug administration and blood sampling, respectively. Several hours before the pharmacokinetic study was performed, dummy cannulas were removed from the guide cannulas located in the brain tumor and CSF and replaced with microdialysis probes [membrane length 2 mm for brain tumor and 1 mm for the CSF], and perfused with aCSF. For the pharmacokinetic studies, each mouse received 10 mg/kg of MTX as an intravenous bolus and had collected serial blood samples [20 µl], from 2 to 360 min following drug administration, and 15 µL microdialysis samples from each probe at 15 min intervals. Each probe was perfused with aCSF at a rate of 1 µL/min, and were calibrated before drug administration using a retrodialysis technique [23]. Briefly, each probe was perfused with known concentrations of MTX [20 ng/ml] and 7‐OH MTX [20 ng/ml] at 1 ul/min for approximately 60 min. During this period the perfusate [in] and dialysate [out] effluent samples were collected and measured for drug concentrations. The relative recovery [RR] for each analyte was calculated as:
where Cin = inlet analyte concentration, and out Cout = mean of the outlet analyte concentration over 4 collection periods over 60 min. The relative recovery was used to convert the measured dialysis analyte concentrations to interstitial fluid drug concentrations. Plasma, harvested by centrifugation and microdialysis samples were stored at −80 °C until analysis.
3. Results and Discussion
3.1 Mass spectrometry and Chromatography
The positive ion scans of standard solutions of MTX and 7‐OH MTX indicated that MTX, 7‐OH MTX, and aminopterin had protonated molecular ions [M+H]+ of m/z 455.4, 471.0 and 441.1 respectively. Fragmentation of these ions using collision induced dissociation at collision energies ramped from 5 to 130 volts resulted in strong product ions for MTX at m/z 308.0 and 175.1, for 7‐OH MTX at m/z 191.1 and 324.2, and for aminopterin at m/z 175.3 and 294.3 [Fig 2].
Fig. 2.
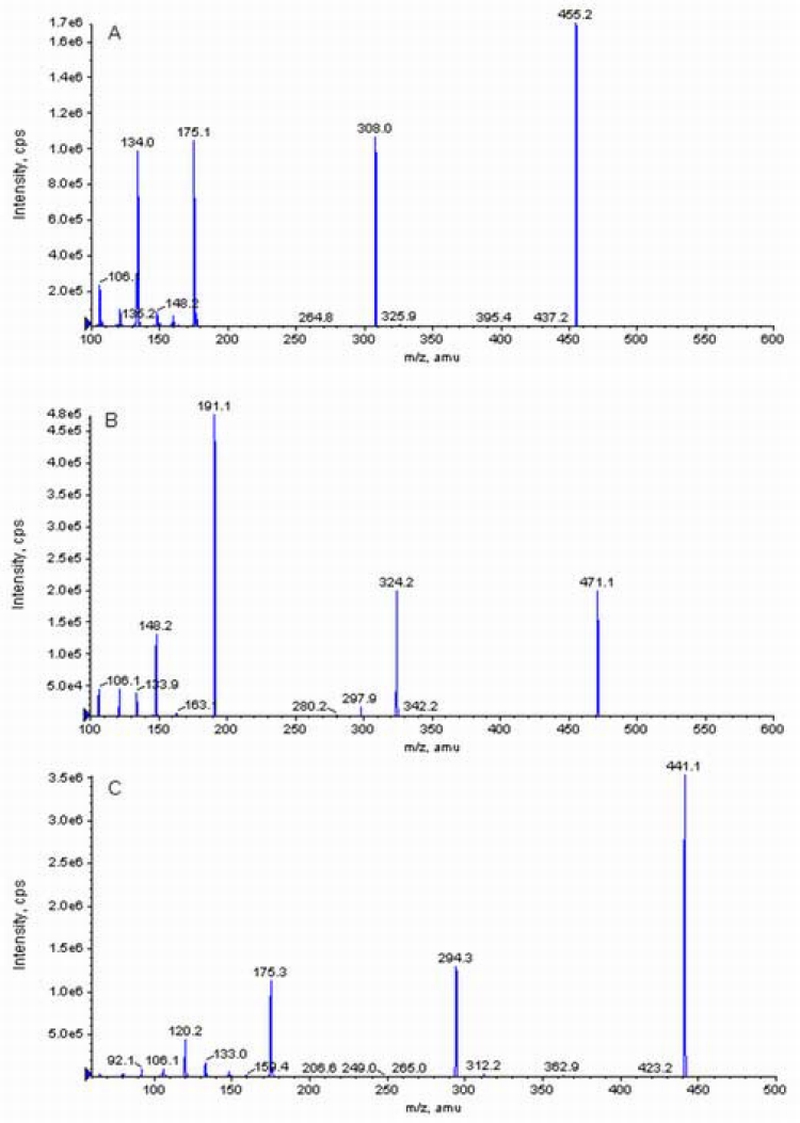
Product ion spectrum of MTX (A), 7‐OH MTX (B) and aminopterin (C) obtained in positive‐ion mode.
Under the chromatographic conditions the transition of 455.4→ 308.0 and 471.0→ 324.2 were selected for optimal monitoring of MTX and 7‐OH MTX, respectively. The ion spray voltage at 3500 volts provided a sufficient response under the selected chromatographic conditions, and no further increase in the response was found when the ion spray voltage was increased further. Peak top noise was found at a lower interface temperature of 450 °C, and by increasing the temperature to 550 °C it was reduced and yielded a smoother peak.
The mobile phase pH had a significant effect on the retention time of 7‐OH MTX, with longer retention times obtained at lower pH values due to the addition of 0.1% formic acid. The retention time of MTX was not similarly affected, and thus, suitable chromatographic separation of both compounds could be achieved by control of the mobile phase pH. The mobile phase yielded retention times of less than 4 minutes for all species allowing high sample throughput. Representative chromatograms of MTX and 7‐OH MTX in plasma and in aCSF are shown in Figure 3 and Figure 4, respectively. In plasma, retention times were 1.4 min for aminopterin, 1.5 min for MTX, and 2.1 min for 7‐OH MTX [Figure 3]. For microdialysis samples, the retention times were 2.2 min for aminopterin, 2.3 min for MTX, and 3.2 min for 7‐OH MTX [Figure 4].
Fig. 3.
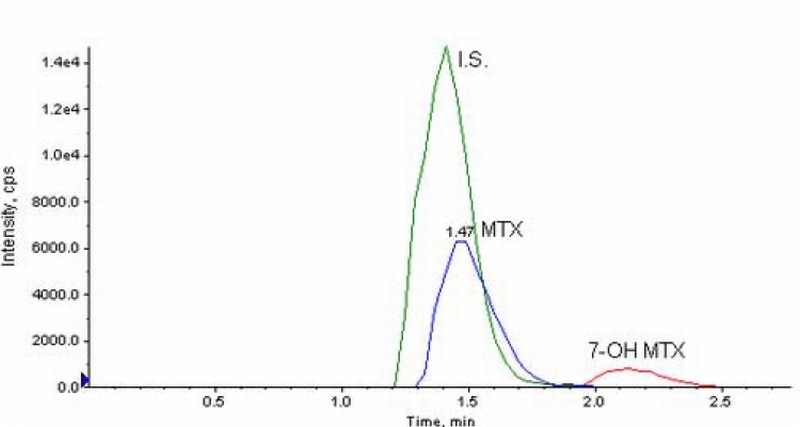
Chromatograms from mouse plasma spiked with MTX and 7‐OH MTX at 9 and 17 ng/ml, monitored at the transitions of 455.4→308.0 and 471.0→324.2 respectively. Aminopterin, the internal standard was monitored at a transition of 441.1→294.3.
Fig. 4.
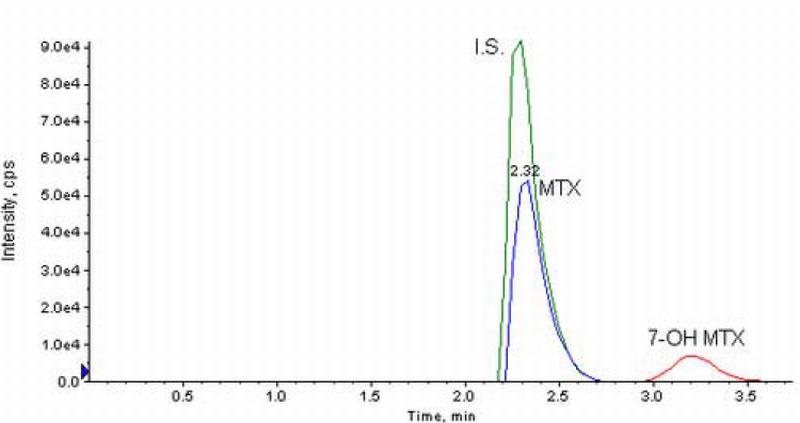
Chromatograms from aCSF spiked with MTX and 7‐OH MTX at 10 ng/ml with column switching monitored at the transitions of 455.4→308.0 and 471.0→324.2, respectively. Aminopterin, internal standard is monitored at a transition of 441.1→294.3.
3.2 Extraction of MTX and 7‐OH MTX from Biological Matrices
A simple protein precipitation procedure was successfully applied to extract the analytes from plasma. The average recovery was 66.2 ± 4.7 % for MTX at concentrations from 3.7 ng/ml to 982 ng/ml, and 105.1 ± 3.0 % for 7‐OH MTX at concentrations from 7.4 ng/ml to 1985 ng/ml. These recoveries compared favorable to those (61% and 47% for MTX and 7‐OH MTX, respectively) obtained by liquid‐liquid extraction [20]. Microdialysis provides a unique tool to measure free drug concentrations in the interstitial fluid of the target organ in conscious animals; however microdialysis samples posed a major obstacle for LC/MS/MS analysis due to the high concentration of nonvolatile salts within the dialysate buffers that are needed to maintain physiological equilibrium with the sampled tissues. The salts can affect detection sensitivity, cause severe signal suppression, accumulate on the LC/MS interface, and contaminate the ion source, especially in cases of high sample throughput. In addition, low molecular weight endogenous components exist in the dialysate which could co‐elute with the analyte of interest and cause matrix effects (signal suppression or enhancement). We adopted a previously used column switching technique to de‐salt microdialysis samples [24]. In this method a pretreatment column is used to trap the analytes prior to elution onto an analytical column and subsequent detection.
From Table 1 it can be seen that the relative matrix effects [ME%] were small for MTX, 7‐OH MTX and aminopterin (I.S.) in different batches of CSF and brain tumor dialysate, which indicated minimal signal suppression or enhancement. In the second set of experiments that utilized blank dialysates from CSF and brain tumor [see Table 2], the % accuracy values ranged from 89 – 104% depending on the analyte and drug concentration indicating that the use of aCSF for calibration is an accurate predictor of drug concentrations added to blank dialysates. The combined data from Tables 1 and 2 address an important yet subtle concern on the quantitation of drugs in dialysate fluids. Micordialysis requires the use of a perfusion buffer that is physiological compatible with the tissue being perfused. For brain, aCSF is the standard; however during the course of an actual animal study this medium passes through the microdialysis probe and diffusible solutes may enter the dialysate, and alter the chromatographic and mass spectral characteristics compared to aCSF that has not been perfused through the animal. The lack of matrix effects, supported by ME% [Table 1] and % accuracy [Table 2], indicate that aCSF used as the medium for calibration standards is comparable to blank dialysate, and avoids the tedious task of obtaining blank dialysate fluids.
Table 1.
Matrix effects (%ME) in blank dialysate from CSF and brain tumor
| Blank Dialysate | MTX %ME (%CV) | 7‐OH MTX %ME (%CV) | Aminopterin %ME (%CV) |
|---|---|---|---|
| CSF‐ batch 1 | 96.9 (1.1) | 101.7 (2.0) | 96.8 (3.9) |
| CSF‐ batch 2 | 107.5 (5.1) | 104.0 (3.4) | 96.6 (3.6) |
| CSF‐ batch 3 | 109.0 (3.3) | 108.8 (4.4) | 94.3 (3.1) |
| Brain tumor‐ batch 1 | 97.1 (8.6) | 103.2 (6.5) | 96.8 (1.0) |
| Brain tumor‐ batch 2 | 88.2 (3.5) | 102.9 (3.1) | 85.7 (2.7) |
| Brain tumor‐ batch 3 | 101.1 (15.7) | 104.5 (15.1) | 96.4 (1.2) |
* Values reported as mean (%CV) of n=3, Added concentrations were 96 ng/ml for MTX and 95 ng/ml for 7‐OH MTX
Table 2.
Accuracy of MTX and 7‐OH MTX measured in blank dialysates brain samples when referenced to aCSF
| MTX ng/ml | 7‐OH MTX ng/ml | MTX ng/ml | 7‐OH MTX ng/ml | MTX ng/ml | 7‐OH MTX ng/ml | |
|---|---|---|---|---|---|---|
| Dialysate from CSF | ||||||
| Concentration added | 402.2 | 395.4 | 25.7 | 25.3 | 1.65 | 1.62 |
| Concentration measured | 363.0 | 406.0 | 25.5 | 23.7 | 1.71 | 1.53 |
| S.D. (n=3) | 2.00 | 3.46 | 0.10 | 0.58 | 0.17 | 0.20 |
| CV (%) | 0.6 | 0.9 | 0.4 | 2.4 | 10.0 | 12.7 |
| Accuracy (%)* | 90.2 | 102.7 | 99.1 | 93.9 | 104.0 | 94.7 |
| Dialysate from brain tumor | ||||||
| Concentration added | 402.2 | 395.4 | 25.7 | 25.3 | 1.65 | 1.62 |
| Concentration measured | 359 | 398.6 | 25.9 | 24.4 | 1.46 | 1.53 |
| S.D. (n=3) | 1.73 | 1.15 | 0.70 | 0.40 | 0.21 | 0.13 |
| CV (%) | 0.5 | 0.3 | 2.7 | 1.7 | 14.3 | 8.5 |
| Accuracy (%) | 89.2 | 100.8 | 100.9 | 96.6 | 88.7 | 94.3 |
% Accuracy = [concentration measured/concentration added] × 100
3.3 Method validation
The method was validated in mouse plasma for MTX and 7‐OH MTX concentration ranges from 1.3 –1042 ng/ml and from 2.6 – 2055 ng/ml, respectively. Calibration curves prepared over these concentration ranges were linear with average correlation coefficients greater than 0.99 in plasma for both parent drug and metabolite. The method yielded mean intra‐day and inter‐day values of less than ± 15 % [Tables 3]. The LLOQs were 3.7 ng/ml and 7.4 ng/ml plasma for MTX and 7‐OH MTX respectively.
Table 3.
Precision and accuracy of MTX and 7‐OH MTX in plasma
| MTX ng/ml | 7‐OH MTX ng/ml | MTX ng/ml | 7‐OH MTX ng/ml | MTX ng/ml | 7‐OH MTX ng/ml | MTX ng/ml | 7‐OH MTX ng/ml | |
|---|---|---|---|---|---|---|---|---|
| Intra‐day (n=6) | ||||||||
| Concentration added | 982.4 | 1985.7 | 60.5 | 122.2 | 11.0 | 22.2 | 3.7 | 7.4 |
| Concentration measured | 841.3 | 1703.3 | 61.4 | 137.2 | 11.4 | 25.3 | 3.8 | 8.3 |
| S.D. | 38.7 | 129.1 | 4.6 | 11.3 | 0.3 | 0.7 | 0.3 | 0.9 |
| CV (%) | 4.6 | 7.6 | 7.5 | 8.2 | 2.4 | 3.0 | 9.0 | 10.4 |
| Bias (%) | −14.4 | −14.2 | 1.6 | 12.3 | 3.9 | 14.0 | 2.8 | 11.8 |
| Inter‐day (n=6) | ||||||||
| Concentration added | 982.4 | 1985.7 | 60.5 | 122.2 | 11.0 | 22.2 | 3.7 | 7.4 |
| Concentration measured | 909.7 | 1922.2 | 65.3 | 136.1 | 12.1 | 25.4 | 3.8 | 8.3 |
| S.D. | 45.5 | 222.0 | 3.0 | 6.2 | 0.4 | 1.1 | 0.2 | 0.3 |
| CV (%) | 5.0 | 11.5 | 4.5 | 4.5 | 3.2 | 4.4 | 4.7 | 4.0 |
| Bias (%) | −7.4 | −3.2 | 7.9 | 11.3 | 9.9 | 14.2 | 4.7 | 11.4 |
The brain microdialysis method was validated for both MTX and 7‐OH MTX in aCSF in the concentration range of 0.7 – 407 ng/ml. Calibration curves prepared over these concentration ranges were linear with average correlation coefficients greater than 0.99 for both parent drug and metabolite. The method yielded mean intra‐day and inter‐day precision and accuracy values of less than ± 15 % [Tables 4]. The LLOQs were 0.7 ng/ml for MTX and 7‐OH MTX.
Table 4.
Precision and accuracy of MTX and 7‐OH MTX in aCSF
| MTX ng/ml | 7‐OH MTX ng/ml | MTX ng/ml | 7‐OH MTX ng/ml | MTX ng/ml | 7‐OH MTX ng/ml | MTX ng/ml | 7‐OH MTX ng/ml | |
|---|---|---|---|---|---|---|---|---|
| Intra‐day (n=6) | ||||||||
| Concentration added | 407.1 | 401.6 | 26.1 | 25.7 | 1.67 | 1.64 | 0.67 | 0.66 |
| Concentration measured | 373.7 | 446.5 | 26.3 | 21.9 | 1.90 | 1.49 | 0.76 | 0.61 |
| S.D. | 27.7 | 34.1 | 2.1 | 1.93 | 0.09 | 0.15 | 0.06 | 0.06 |
| CV (%) | 7.4 | 7.6 | 7.9 | 8.8 | 4.9 | 10.1 | 7.7 | 9.1 |
| Bias (%) | −8.2 | 11.2 | 0.8 | −14.8 | 13.8 | −9.4 | 14.3 | −7.9 |
| Inter‐day (n=6) | ||||||||
| Concentration added | 407.1 | 401.6 | 26.1 | 25.7 | 1.67 | 1.64 | 0.67 | 0.66 |
| Concentration measured | 390.8 | 437.61 | 27.1 | 25.1 | 1.73 | 1.63 | 0.65 | 0.61 |
| S.D. | 29.4 | 28.5 | 1.69 | 3.01 | 0.15 | 0.14 | 0.03 | 0.06 |
| CV (%) | 7.5 | 6.5 | 6.2 | 12.0 | 8.7 | 8.5 | 5.0 | 10.3 |
| Bias (%) | −4.0 | 9.0 | 3.9 | −2.2 | 3.5 | −0.8 | −2.5 | −7.9 |
Specificity experiments showed that there was a small peak at the retention time of MTX in both blank plasma and blank microdialysate. Since the peak height of the interfering peak was substantially less than the peak height of MTX at the LLOQ, and easily met the 5∶1 signal‐to‐noise criteria used to define the LLOQ no further modifications to the method were required.
3.4 Method Application
Representative concentration‐time profiles of MTX and 7‐OH MTX in plasma and brain tissues after intravenous administration of 10 mg/kg MTX to a single mouse are shown in Figure 5 – Figure 6.
Fig. 5.
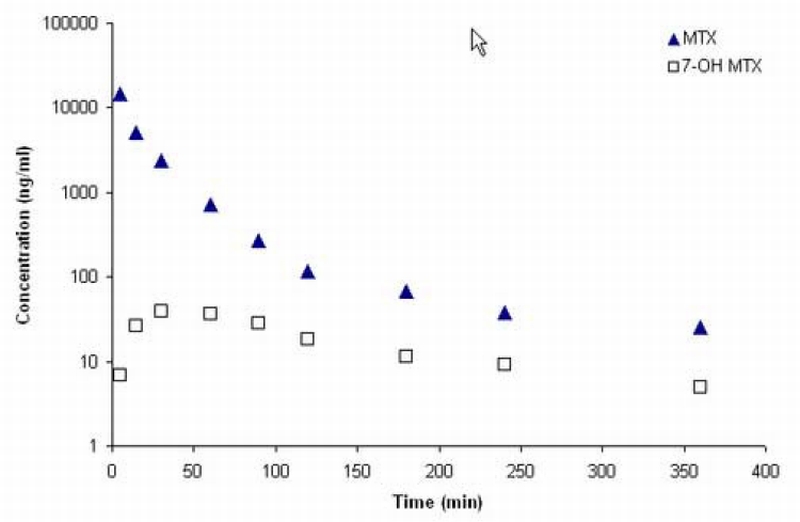
Plasma concentration‐time profiles of MTX and 7‐OH MTX in a C57BL/6 mouse after administration of 10 mg/kg MTX intravenously.
Fig. 6.
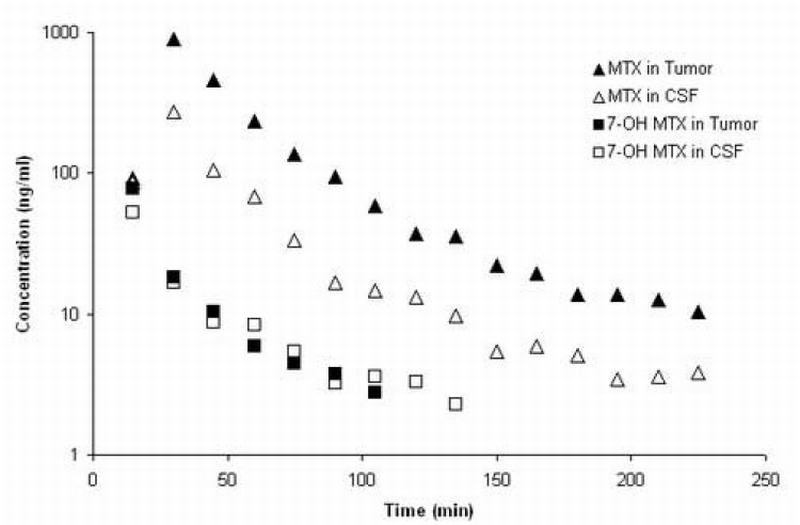
MTX and 7‐OH MTX concentration‐time profiles in CSF and brain tumor of a C57BL/6 mouse after administration of 10 mg/kg MTX intravenously.
Pharmacokinetic parameters were calculated by noncompartmental analyses from the MTX plasma concentration‐time profiles in each mouse [Table 5]. Both the brain tumor/plasma and CSF/plasma AUC ratios are small, being about 7% and 3%, respectively, and indicate severe hindrances to the uptake of MTX in the CNS. The approximate 2‐fold higher ratio in brain tumor compared to CSF may be of consequence of the effects of different ABC transporters operating at the BBB and BCSFB, and may also reflect a compromised BBB in brain tumors permitting greater uptake than in normal brain areas [25]. These types of data provide the necessary foundation to pursue additional investigations on the mechanisms controlling MTX accumulation in the CNS, and further demonstrate the suitability of the assay method to explore MTX’s disposition in preclinical tumor models in mice.
Table 5.
Pharmacokinetic parameters and brain distribution of MTX after intravenous administration of 10 mg/kg
| Parameters | Values* |
|---|---|
| CL (ml/min/kg) | 43.9 ± 12.6 |
| T1/2 (terminal) (min) | 85.2 ± 38.8 |
| Vss (ml/kg) | 2193.6 ± 553.5 |
| AUC in CSF (µg‐min/ml) | 8.87 ± 7.27 |
| AUC in brain tumor (µg‐min/ml) | 16.11 ± 11.36 |
| AUC ratio of CSF/Plasma | 0.033 ± 0.016 |
| AUC ratio of Tumor/Plasma | 0.07 ± 0.06 |
Values are means ± S.D., n = 3; except the T1/2 (terminal) which is the harmonic mean ± pseudo S.D., n=3.
Abbreviations are; CL= total systemic clearance; T1/2 (terminal) = terminal elimination half‐life, Vss = volume of distribution at steady state; AUC = area under the drug concentration time curve.
4. Conclusion
A rapid and sensitive LC/MS/MS method for the quantitation of MTX and its metabolite 7‐OH MTX in mouse plasma and brain tissue is presented. The unique features of the assay are the requirement of only small sample volumes [10 µL plasma, 15 µL microdialysis], the use of a simple and rapid extraction procedure for plasma, and the use of column switching for the clean‐up of brain microdialysis samples. The ability to measure MTX and 7‐OH MTX in small plasma and brain microdialysis volumes permits serial sampling protocols in individual mice that will support comprehensive drug distribution studies designed to understand the factors that determine MTX’s distribution into brain. In this regard, MTX is a substrate for various ABC transporters located on the BBB and BCSFB, that may alter its accumulation into brain [2]. Given the attributes of our LC/MS/MS technique, it should be possible to delineate the role of such transporters through the combined use of wild‐type, and genetic knockout mice that lack the aforementioned transport proteins.
Acknowledgements
Supported in part by NIH grants CA072937 and CA085577 to JMG.
Footnotes
Publisher's Disclaimer: This is a PDF file of an unedited manuscript that has been accepted for publication. As a service to our customers we are providing this early version of the manuscript. The manuscript will undergo copyediting, typesetting, and review of the resulting proof before it is published in its final citable form. Please note that during the production process errors may be discovered which could affect the content, and all legal disclaimers that apply to the journal pertain.
References
- [1].Shah GD, DeAngelis LM. Hematol Oncol Clin North Am. 2005;19:611. doi: 10.1016/j.hoc.2005.05.002. [DOI] [PubMed] [Google Scholar]
- [2].Zeng H, Chen ZS, Belinsky MG, Rea PA, Kruh GD. Cancer Res. 2001;61:7225. [PubMed] [Google Scholar]
- [3].Chen ML, Chiou WL. J Chromatogr. 1981;226:125. doi: 10.1016/s0378-4347(00)84213-9. [DOI] [PubMed] [Google Scholar]
- [4].Volk EL, Rohde K, Rhee M, McGuire JJ, Doyle LA, Ross DD, Schneider E. Cancer Res. 2000;60:3514. [PubMed] [Google Scholar]
- [5].Loscher W, Potschka H. Neurorx. 2005;2:86. doi: 10.1602/neurorx.2.1.86. [DOI] [PMC free article] [PubMed] [Google Scholar]
- [6].Begley DJ. Curr Pharm Des. 2004;10:1295. doi: 10.2174/1381612043384844. [DOI] [PubMed] [Google Scholar]
- [7].Kruh GD, Zeng H, Rea PA, Liu G, Chen ZS, Lee K, Belinsky MG. J Bioenerg Biomembr. 2001;33:493. doi: 10.1023/a:1012827221844. [DOI] [PubMed] [Google Scholar]
- [8].Sparreboom A, Loos WJ, Nooter K, Stoter G, Verweij J. J Chromatogr B Biomed Sci Appl. 1999;735:111. doi: 10.1016/s0378-4347(99)00387-4. [DOI] [PubMed] [Google Scholar]
- [9].McCrudden EA, Tett SE. J Chromatogr B Biomed Sci Appl. 1999;721:87. doi: 10.1016/s0378-4347(98)00439-3. [DOI] [PubMed] [Google Scholar]
- [10].Emara S, Askal H, Masujima T. Biomed Chromatogr. 1998;12:338. doi: 10.1002/(SICI)1099-0801(199811/12)12:6<338::AID-BMC759>3.0.CO;2-3. [DOI] [PubMed] [Google Scholar]
- [11].Emara S, Razee S, Khedr A, Masujima T. Biomed Chromatogr. 1997;11:42. doi: 10.1002/(SICI)1099-0801(199701)11:1<42::AID-BMC621>3.0.CO;2-F. [DOI] [PubMed] [Google Scholar]
- [12].Yu Z, Westerlund D. J Chromatogr A. 1996;742:113. doi: 10.1016/0021-9673(96)00257-9. [DOI] [PubMed] [Google Scholar]
- [13].Cociglio M, Hillaire‐Buys D, Alric C. J Chromatogr B Biomed Appl. 1995;674:101. doi: 10.1016/0378-4347(95)00301-x. [DOI] [PubMed] [Google Scholar]
- [14].Albertioni F, Pettersson B, Beck O, Rask C, Seideman P, Peterson C. J Chromatogr B Biomed Appl. 1995;665:163. doi: 10.1016/0378-4347(94)00507-2. [DOI] [PubMed] [Google Scholar]
- [15].Assadullahi TP, Dagli E, Warner JO. J Chromatogr. 1991;565:349. doi: 10.1016/0378-4347(91)80395-s. [DOI] [PubMed] [Google Scholar]
- [16].Beck O, Seideman P, Wennberg M, Peterson C. Ther Drug Monit. 1991;13:528. doi: 10.1097/00007691-199111000-00011. [DOI] [PubMed] [Google Scholar]
- [17].Okuda T, Motohashi M, Aoki I, Yashiki T. J Chromatogr B Biomed Appl. 1994;662:79. doi: 10.1016/0378-4347(94)00391-2. [DOI] [PubMed] [Google Scholar]
- [18].Lobo ED, Balthasar JP. J Chromatogr B Biomed Sci Appl. 1999;736:191. doi: 10.1016/s0378-4347(99)00460-0. [DOI] [PubMed] [Google Scholar]
- [19].Lobo ED, Balthasar JP. J Pharm Sci. 2003;92:1654. doi: 10.1002/jps.10431. [DOI] [PubMed] [Google Scholar]
- [20].Steinborner S, Henion J. Anal Chem. 1999;71:2340. doi: 10.1021/ac981294y. [DOI] [PubMed] [Google Scholar]
- [21].Rule G, Chapple M, Henion J. Anal Chem. 2001;73:439. doi: 10.1021/ac000897i. [DOI] [PubMed] [Google Scholar]
- [22].Gallo JM, Li S, Guo P, Reed K, Ma J. Cancer Res. 2003;63:5114. [PubMed] [Google Scholar]
- [23].Le Quellec A, Dupin S, Genissel P, Saivin S, Marchand B, Houin G. J Pharmacol Toxicol Methods. 1995;33:11. doi: 10.1016/1056-8719(94)00049-a. [DOI] [PubMed] [Google Scholar]
- [24].Igarashi K, Murabayashi Y, Hotta K, Kitamura Y, Kasuya F, Shiotani K, Tingyou L, Miyazaki A, Tsuda Y, Okada Y, Fukushima S. J Chromatogr B Analyt Technol Biomed Life Sci. 2004;806:53. doi: 10.1016/j.jchromb.2004.02.024. [DOI] [PubMed] [Google Scholar]
- [25].Devineni D, Klein‐Szanto A, Gallo JM. Cancer Chemother Pharmacol. 1996;38:499. doi: 10.1007/s002800050518. [DOI] [PubMed] [Google Scholar]


