

Abstract
Survivin has gained attention as a tumor-specific marker which is upregulated in a variety of neoplasms. Although the survivin protein is implicated in anti-apoptotic tumor pathways, little is known about the function of the survivin promoter. In this study, we constructed a conditionally replicative adenoviral vector (CRAd) that utilizes the survivin promoter and examined the mechanism of CRAd induced cell death in malignant glioma. Our results indicate that CRAd vectors which utilize the survivin promoter effectively replicate in glioma cells and exhibit a high oncolytic effect. The survivin-mediated CRAd appeared to induce apoptosis as measured by Annexin/7-AAD. Caspase-3 and BAX mRNAs were upregulated based on microarray data, however, Western blot analysis of infected cells showed no evidence of elevated caspase-3, BAX, or p53 protein expression. Of note, at each time point infected glioma cells showed no evidence of activated BAD or AKT. The inhibition of AKT signaling led us to examine autophagy in infected cells. Electron micrographs of virally infected glioma cells suggested autophagosomal-mediated cell death and selective blocking of beclin with siRNA prevented autophagy. These results indicate that the survivin promoter enhances viral replication and induces autophagy of infected glioma cells via a beclin-dependent mechanism.
Keywords: survivin, glioma, autophagy, apoptosis, beclin, adenovirus
Introduction
Oncolytic adenoviruses that are conditionally replicative (CRAds) in tumor cells but not in normal cells represent a novel approach for treating cancer. As an adenovirus-based cancer gene therapy approach, CRAd efficacy is dependent on vector-mediated tumor transduction. Efficient tumor transduction using CRAds is in turn dependent on augmenting the gene transfer efficacy of Ad vectors via transductional modification of the fiber protein. Moreover, CRAd replicative specificity is based on tumor-specific transcriptional control of the essential early genes required for replication. For CRAds, the adenovirus genome is genetically modified to include a promoter region with the required tumor-specific expression profile. The ideal tumor specific promoter (TSP) element would exhibit the widest differential between ‘tumor on/normal tissue off’ expression profiles, key to ablation of toxicity from ectopically localized CRAds. To date, however, few tumor-relevant promoter elements have been suggested or well characterized for employment in CRAds.
Our group has shown that the survivin promoter appears to be a promising tumor-specific promoter in in vivo gene therapy of human melanoma, breast cancer, cholangiocarcinoma, and malignant glioma (1–4). We have also shown the selectivity of survivin-modified adenovectors for malignant glial cells rather than normal human astrocytes (5). Survivin belongs to the family of inhibitor of apoptosis proteins (IAPs) which were originally identified in baculoviruses (6). Ectopic expression of survivin conveys resistance to apoptosis to a variety of stimuli and survivin is one of the most abundantly overexpressed genes in human tumors (7–9). Expression levels correlate with tumor aggressiveness and resistance to therapy (10). Genetic and biochemical data indicate that survivin functions in a unique cell division checkpoint that ensures the apoptotic demise of genetically unstable cells (11–14). Based on these findings, survivin has been proposed as a suitable target for therapies that can restore the apoptotic program in human tumors.
Survivin has been found to play an important role in the oncogenesis and progression of malignant brain tumors (15–17). This is suggested by its expression pattern-positive in up to 79% of malignant brain tumors (16,18,19) and by the fact that patients with survivin-positive gliomas have significantly shorter overall survival times compared with patients who have survivin-negative tumors (16). Although it has been shown that survivin-responsive conditionally replicative adenoviruses exhibit cancer specific and efficient viral replication (20) and that survivin mediated CRAds induce high efficiency of viral replication and oncolysis in malignant glioma (1), the exact mechanism responsible for this enhanced oncolytic effect remains controversial and undetermined.
Despite the known apoptosis-modulating abilities of individual adenoviral proteins, at least one CRAd, Ad5delta24, has been shown to trigger necrosis-like cell death (21). In contrast, in a more recent publication, an hTERT-Ad vector was shown to induce autophagic cell death in tumor cells (22). In this study, our aim was to explore the role of the survivin promoter in CRAd mediated oncolysis of human glioma. The involvement of several main apoptotic regulators was studied, including p53, AKT, Bax, Bad, and caspase 3, and the morphological and biochemical features associated with survivin-mediated cell death were examined. We now show that the enhanced oncolytic effect seen with the survivin promoter is mediated via autophagosome-induced cell death.
Materials and methods
Cells and cell culture
The human malignant glioma cell lines: U373MG, U118MG, U87MG, A172, as well as the human lung carcinoma A549 were purchased from American Type Culture Collection (ATCC, Manassas, VA, USA). No. 10 and Kings glioma cell lines were purchased from the Japanese Tumor Tissue Bank (Tokyo, Japan). The human epithelial adenocarcinoma, HeLa, was provided by Dr Tatiana Glushko (Section of Hematology/Oncology, Department of Medicine, The University of Chicago). All cell lines were maintained in a humidified 37°C atmosphere containing 5% CO2 and cultured in Dulbecco’s modified Eagle’s medium (DMEM) supplemented with 10% heat-inactivated fetal calf serum, 100 U/ml penicillin, 100 μg/ml streptomycin, and L-glutamine (200 μg/ml).
A human glioblastoma multiforme primary sample was obtained from a patient undergoing a craniotomy for tumor resection. The study was approved by the Institutional Review Board of the University of Chicago. The specimen obtained from patient was stored in University of Wisconsin solution at 4°C until immediate use. To generate slice organ cultures, the tissue was serially dissected into 0.5 mm-thick slices using the Krumdieck tissue slicer (Alabama Research Development, Munford, AL). Next, the tissue was cultured in 6-well plates in RPMI medium supplemented with 10% FBS, 100 U/ml penicillin, 100 μg/ml streptomycin, and 5 μg/ml insulin. Cultures were maintained at 37°C in a humidified atmosphere supplemented with 5% CO2 under continuous shaking.
Recombinant viruses
All of the recombinant viruses (AdWT, CRAd-S-RGD) have been previously described (3). Briefly, AdWT, and its isogenic control AdRGD virus having RGD motif incorporated into fiber protein, are replication competent vectors (23). CRAd-S-RGD is a replication competent Ad5 vector carrying the short (S) form of the human survivin promoter driving an intact E1A expression cassette (Fig. 1). Recombinant adenoviruses were selected from single plaque, expanded in A549, and then purified by double CsCl gradient ultracentrifugation (24).
Figure 1.

Schematic construction of E1-competent adenoviruses. The E1+ recombinant plasmids were used to create replication competent viruses containing a short version (S-S, covering from −230 to +30 nt) of the survivin promoter. RGD modification was incorporated into the fiber region of the adenoviral backbone for further rescue of integrin-dependent competent vectors (AdRGD and CRAd-S-RGD).
Cell killing assay
For determination of virus-mediated cytotoxicity, 5×10⁴ glioma cells (A172, No. 10, U87MG and U373MG) were seeded in 24-well plates and infected with adenoviruses at indicated titers or were mock-infected for 4 h followed by replacement of infection media with growth media. The medium was replaced every 48 h during a 10 day period. To visualize cell killing, cells were fixed and stained with 1% crystal violet in 70% ethanol for 20 min followed by washing with water to remove excess dye. The plates were dried and images were captured with a Syngene image system (Frederick, MD, USA). Each experiment was repeated twice.
Real-time quantitative PCR analysis of E1A transcription
To examine the transcription of adenoviral vectors CRAd-S-RGD, AdRGD and AdWT in glioma cell lines, 0.5×10⁶ cells were seeded in a 6-well plate 24 h before infection. Next day, cells were infected with adenoviruses at 10 MOI/cell or mock treated for 4 h followed by replacement with growth media. Twenty-four hours post-infection, cells were trypsinized, and cell pellets were collected by centrifugation at 1000 × g for 5 min. The RNAs from human cell lines was extracted using RNAqueous-Micro (#1931, Ambion, TX, USA). cDNA from total RNA was synthesized using Superscript II system (Invitrogen, CA, USA) according to the vendor manual. The first strain cDNA was subjected to PCR. DNA solution (1 μl) was used for cDNA synthesis with GeneAmp RNA PCR core kit (Applied Biosystems, CA, USA) and amplified by PCR. All primers were synthesized by IDT Technologies (IA, USA). Equal amounts of cDNA from each sample were amplified with E1A primers: sense-5′-AACCAGTTGCCGT GAGAGTTG; antisense 5′-CTCGTTAAGCAAGTCCT CGATACAT. Human house keeping gene glyceraldehyde-3-phosphate dehydrogenase (GAPDH) was used for internal control. The sequences to amplify the GAPDH gene were: sense 5′-CAACTACATGGTTTACATGTTCCAA, antisense primer 5′-GCCAGTGGACTCCACGACGT. The PCR conditions used were: 30 cycles of denaturation (94°C, 30 sec), annealing (59°C, 30 sec) and extension (72°C, 30 sec). To detect E1A transcription in primary sample, slices were infected with 500 MOI/cell of CRAD-S-RGD, AdRGD, and AdWT or were mock-infected. Twenty-four or 48 h post-infection total RNA was isolated and subjected to the protocol described for glioma cell lines.
Western blotting
One million No. 10 glioma cells were mock infected or infected with AdRGD, AdWT or CRAd-S-RGD at 100 MOI. After 24 h, the cells were lysed and lysates were cleared at 12000 × g for 10 min. Samples were resolved by 4–20% Gene Mate Express gel under reducing condition and subsequently transferred to a PVDF membrane (Amersham Bioscience Corp.). The membrane was blocked with 5% skim milk at 4°C overnight and then incubated with the following antibodies: adenovirus type 5 E1A ab-1 (M58, Lab Vision, CA, USA), BAX (#2772, Cell Signaling Tech, MA, USA), actin-loading control (AC-15, Abcam Co., Cambridge, MA, USA), p53 ab-6 (DO-1, Lab Vision), JNK activating kinase ab-1 (RB-1666-P0, Lab Vision), AKT1/2 (RB-10309-P0, Lab Vision), phospho-AKT (ser 473) (Lab Vision), BAD (#9292, Cell Signaling Tech), phospho-BAD (ser 112) (#5284, Cell Signaling Tech), cytochrome C (#4280, Cell Signaling Tech), caspase-3 antibody (#9662, Cell Signaling Tech) antibody for 1 h. After washing, the membrane was incubated with 1:3000 sheep anti-rabbit (#AP304P, Chemicon, USA) or anti-mouse (#5870-250, Abcam Co.) antibodies conjugated with horseradish peroxidase for 1 h and signals were detected with West Pico peroxidase kit (Pierce, IL, USA). The image was developed with a Kodak 440 image station (Kodak Molecular Imaging, CT, USA).
Immunochemical detection of survivin, beclin and E1A protein expression
The human gliomas: U87MG, U373MG, KINGS, A172, U118MG, No. 10 and HeLa cells were grown in cover-slips at 2×10⁵ cell densities. The following day, the cells were washed with PBS and fixed with 4% paraformaldehyde for 30 min at room temperature. Immunochemical staining was performed using primary rabbit polyclonal serum (RB-1629-P0, Lab Vision) recognizing the human survivin protein.
For detection of beclin and E1A expression, No. 10 human glioma cells were grown in coverslips charged by poly-lysine (Sigma). Next day, the cells were transfected with 20 pMol of siRNA (BECN1, Santa Cruz Biotechnology, CA, USA) in serum-free medium at 37°C. Two hours later, media containing the siRNA was replaced with the media containing 100 MOI/cells of AdWT, AdRGD, or CRAd-S-RGD vectors. After 4 h of adsorption, cells were rinsed with PBS and growth media supplemented with 10%FBS was added to each coverslip. Seventy-two hours later, the coverslips were rinsed with PBS, fixed with 4% of paraformaldehyde for 30 min at room temperature, and stained with rabbit polyclonal anti-beclin (BECN1, clone H-300, Santa Cruz Biotechnology) and mouse anti-adenovirus type 5 E1A (clone M58, Lab Vision) antibodies. For the survivin and siRNA-inhibition, staining secondary antibodies were: FITC-conjugated goat anti-rabbit IgG (FI-1000, Vector Laboratories, CA, USA) and FITC-conjugated goat anti-mouse IgG (FI-2020, Vector Laboratories) or Texas-red goat anti-rabbit IgG (TI-1000, Vector Laboratories). Nuclei were stained with nucleic acid stain 4,6-diamino-2-phenylindol (DAPI, Sigma). Pictures were captured using a fluorescent laser scanning microscope. To obtain merged figures, single-channel images were digitally captured and overlayed using Leica software (LAS AF, version 1.6.0. build 869; Microsystems).
Annexin V staining
Apoptosis was quantified using the Annexin V-FITC apoptosis kit (BD Biosciences, San Diego, CA) according to the instructions of the manufacturer. Briefly, 2×10⁵ No. 10 glioma cells were seeded in a 6-well plate. The next day, the cells were infected with CRAds at 100 MOI per cell. After 4 h adsorption, the cells were rinsed with PBS and growth media was added. Twenty-four, 48, and 72 h post-infection, the cells were trypsinized (Gibco-Invitrogen), pelleted by centrifugation, and prepared for the staining procedure according to vendor recommendations. Analyses were done on a FACscan (Becton Dickinson, Mountain View, CA). The data were analyzed with CellQuest software (Becton Dickinson).
Cell cycle analysis
No. 10 human glioma cells (0.5×10⁶) were split into 6 cm dishes 1 day before the experiments. Cells were treated with AdWT, CRAd-S-RGD, AdRGD or mock infected adenoviruses with 100 MOI/cell in a 2% media. After 4 h of viral adsorption, the cells were rinsed with PBS and fresh media was added. Cells were collected each 24 h post-infection during first three days. Samples were labeled with propidium iodide at 37°C for 30 min and analyzed by flow cytometry. The percentage of cells in each phase of the cell cycle (G1, S-phase and G2) was determined using FloJo software.
Caspase-3 assays
No. 10 human glioma cells (0.5×10⁶ cells/ well) were plated into 6-cm dishes 1 day before the experiment. The following day, these cells were treated with AdWT, CRAd-S-RGD or AdRGD at 100 MOI/cell in 2% media. After 4 h viral adsorption, the cells were rinsed with PBS and fresh media was added. Cells were collected 72 h post-infection and subjected to the Western blotting with rabbit polyclonal antibodies against caspase-3 proteins.
To examine inhibition of apoptosis, No. 10 human glioma cells (1×10⁴) were plated into 96-well plate 1 day before the experiments. Next day cells were infected with AdWT, CRAd-S-RGD, and AdRGD at 100 MOI/cell in 2% media. After 4 h viral adsorption, the cells were rinsed with PBS and old media was replaced with growth media, containing 10% FBS and 10 μM of Z-VAD-FMK (#G7231; Promega Corp., WI, USA). After 72 h incubation cells were subjected to CytoTox-One™ homogeneous membrane integrity assay (G7891, Promega Corp.).
Assay to stain and measure acidic vesicular organelles with acridine orange
Autophagy was assessed in No. 10 cells by the quantification of acidic vesicular organelles with supravital cell staining using acridine orange, as described previously (22,25). Cells were grown in square coverslips 24 h before infection. Next day, cells were infected with 100 MOI of AdWT, AdRGD, and CRAd-S-RGD or were mock infected. After 4 h adsorption, unbound virus was removed and fresh portion of growth media was added. At 72 h post-infection, the cells were rinsed with PBS and stained with acridine orange (Sigma-Aldrich) for 15 min at 37°C following a rinse with PBS and fixation with 4% of formalin. Coverslips with fixed cells were subjected to immunofluorescence analysis by Leica SP2 AOBS confocal microscopy.
No. 10 human glioma cells were grown in 6-well plates and then infected for 4 h with 100 MOI of AdWT, AdRGD, or CRAd-S-RGD or were mock-infected. The cells were detached with 0.05% trypsin-EDTA (Invitrogen) and then stained with 1.0 μg/ml acridine orange (Sigma-Aldrich) for 15 min at 37°C. Stained cells were then analyzed by flow cytometry using the FACScan cytometer (Becton Dickinson, San Jose, CA) and CellQuest software (Becton Dickinson). Three replicates were performed for each experiment.
Microarray analysis for CRAd-induced cell death
Total RNA was isolated at 24 h after exposure of No. 10 human glioma cell lines to AdWT, CRAd-S-RGD or mock-infection by using the Qiagen RNeasy kit (Valencia, CA, USA). At least 5 μg of total RNA with Abs 260 nm/Abs 280 nm ratio between 1.6 and 2.0 for each sample was obtained. Oligo GEArray® microarray was performed at the SuperArray Bioscience Corporation (Frederick, MD). This microarray contains oligonucleotide probes representing genes associated with a specific biological pathway. The probes are printed on a 3.8×4.8 cm nylon membrane with an advanced non-contact printing technology in rows of 8, 12, or 16 columns. A significant difference was set at a 2-fold difference in expression between mock and virus infected samples. Positive values indicate a higher expression in infected cells.
The Oligo GEArray, combined with its companion labeling method, true Labeling-AMP 2.0, may be used at maximum speed and convenience when at least 1.0 mg of total RNA is available at a concentration >0.2 mg/ml for every sample. Under these conditions, the labeling method produces enough labeled RNA target in 2.5 h for Oligo GEArray analysis (at least 2.0 mg).
Electron microscopy
The No. 10 human glioma cells infected with AdWT, AdRGD, or CRAd-S-RGD cells were harvested three days after infection, washed twice with PBS, and fixed with 2% glutaraldehyde and 4% paraformaldehyde in 0.1 M sodium cacodylate buffer for 2 h. After washing, the cells were post-fixed with 0.1% osmium tetroxide in 0.1 M sodium cacodylate buffer for 1 h following rinse with maleate buffer and incubation with 1% uranil acetate. After dehydration, the cells were embedded in mixture of propylene oxide and spur resin. Ninety nanometer sections were cut by Reinchert-Jung Ultracut following staining with uranil acetate staining. Images were examined under 300 kV at FEI Tecnai G2 F30 electron microscopy (Hillsboro, OR, USA) connected to the CCD digital camera (Gatan, Warrendale, PA, USA).
Statistics
Data are presented as mean values ± standard deviation. Statistical difference was assessed with a two-tailed Student’s t-test. A p-value of <0.05 was considered significant.
Results
Human gliomas express survivin
In order to determine expression of human survivin, human glioma cell lines were investigated for their relative survivin levels using fluorescence-tagged goat-antihuman survivin antibodies. HeLa cells were used as a positive control for target expression. Confocal immunofluorescence analysis allows for a precise evaluation of survivin expression levels when compared with HeLa control cells, designated as 100±8.02% intensity. As seen in Fig. 2A and B, all glioma cells exhibited different level of survivin expression. This level was variable from 69.08±11.58 (U373MG), 73.46±7.26 (U87MG) and 92.99±5.99 (Kings) to 116±10.57 (U118MG), 135±6.02 (No. 10), and 204±12.95 (A172). Our data correlate with published literature which show high levels of survivin expression detected in primary high grade gliomas (16,17).
Figure 2.

Immunofluorescent detection of survivin expression. (A) Human survivin was detected in human gliomas (U87MG, U373MG, Kings, U118MG, A172 and No. 10) using primary rabbit polyclonal antibodies and FITC-conjugated goat anti-rabbit IgG. The nucleus was stained with DAPI. HeLa cells expressed high levels of survivin and were used as positive control. A total of 30 different squares from each stained sample were analyzed by confocal microscopy. (B) All data were normalized to the expression level demonstrated by HeLa cells and presented as % of integral intensities ± SD. *p<0.05.
Survivin enhances oncolysis of malignant glioma
To examine the anti-tumor effect of CRAds which utilize the survivin promoter in the context of malignant glioma, we first performed a cell killing assay. Several human glioma cell lines were infected with AdWT, AdRGD, or CRAd-S-RGD. As shown in Fig. 3, CRAd-S-RGD effectively lysed all human glioma cell lines. The oncolytic effect was observed in U87MG, U373MG and A172 cells at 100 MOI per cell whereas in No. 10 the same effect was detected at 10 MOI per cells. Of note, no cytotoxicity was observed in mock-infected cells. To further validate the enhanced oncolytic potential of our CRAds, we examined the E1A activity. The survivin-mediated CRAd demonstrated a significant elevation of E1A expression when compared to the wild-type vector or control in both passaged (Fig. 4A) and primary (Fig. 4B) glioma cells.
Figure 3.
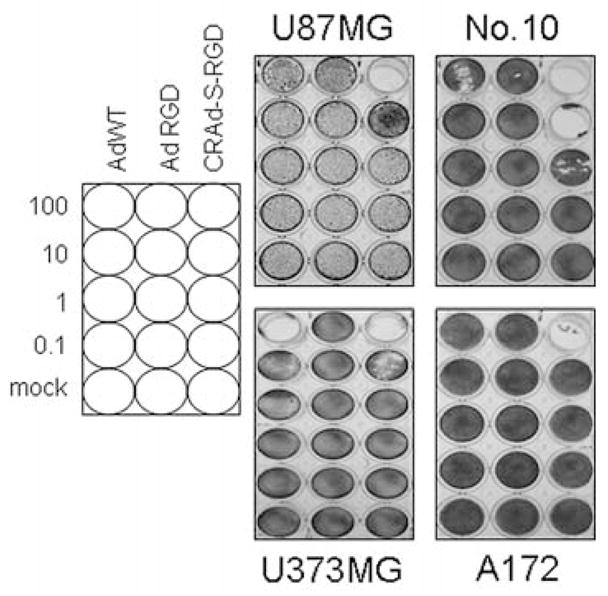
CRAd-S-RGD exhibits enhanced oncolytic potency. U87MG, U118MG, U373MG, A172 and No. 10 glioma cells were infected with CRAd-S-RGD, AdRGD, or AdWT at the indicated doses (MOI/cell). After 10 days, adherent cells were stained with crystal violet. Data are representative examples of two independent sets of experiments.
Figure 4.

Promoter dependent E1A expression in human gliomas. (A) U87MG, U118MG, U373MG, A172 and No. 10 glioma cells or (B) primary glioma slices obtained from a patient were seeded in 6-well plates overnight and then infected with CRAd-S-RGD, AdRGD or AdWT. After 4 h adsorption, cells were rinsed with PBS, unbound virus was removed and fresh growth media was added. Twenty-four or 48 h post-infection, total RNA was extracted and subjected to the quantification RT-PCR. All results are presented as E1A copy number per ng RNA. *p<0.05 (statistical significance in comparison with the AdWT).
CRAd-survivin induces cell cycle arrest and apoptosis of glioma cells
Given the observation that CRAd-S-RGD demonstrated increased oncolysis, we then determined whether viral gene expression affected the cell cycle by performing propidium iodide staining of infected glioma cells at 24, 48, and 72 h after viral infection (Fig. 5A and Table I). We utilized the No. 10 human glioma cell line in this and subsequent experiments as it is patient derived and contains a p53 mutation, which is present in the majority of human gliomas. Only CRAd-S-RGD showed an acceleration in S-phase induction. As shown, CRAd-S-RGD significantly increased the amount of cells in S-phase at 48 h post-infection: AdRGD (17%); AdWT (4.71%) and CRAd-S-RGD (39.7%). These results were also observed at 72 h: AdRGD (23%); AdWT (7.82%) and CRAd-S-RGD (40.9%). Moreover, as illustrated in Fig. 5B, apoptotic cells (Annexin V+/7AAD−) increased from 9.2% (48 h) to 32.5% (72 h) after CRAd-S-RGD treatment, whereas treatment with AdWT (5.5% at 48 h and 17% at 72 h) was comparable to AdRGD (5% at 48 h and 19% at 72 h).
Figure 5.

Effects of CRAd-S-RGD on cell cycle and cell death. (A) Cells were cultured in 6-well plates overnight in triplicate and infected with AdRGD, AdWT or CRAd-S-RGD at 100 MOI for 4 h. Then media was replaced and cells continued incubation for 24, 48 or 72 h. Cell cycle distribution was determined by propidium iodide staining. Results are presented as the percentage of cells distributed at various stages of the cell cycle detected by flow cytometry. Experiments were performed twice. (B) Flow cytometry analysis of No. 10 human glioma cells infected with adenoviral vectors. Histogram of cells infected with CRAd-S-RGD, AdRGD or AdWT at 100 MOI per cell. All experiments were repeated twice. The flow cytometry measurement was performed each 24 h post-infection during 3 days.
Table I.
Percent of the cells distributed in cell cycle phases.
| Infection | G0/G1 | S | G2/M |
|---|---|---|---|
| Day 2 post-infection | |||
| Mock-infected | 68.6 | 5.7 | 30.7 |
| AdWT | 73.9 | 4.71 | 26 |
| AdRGD | 80.7 | 17 | 1.87 |
| CRAd-S-RGD | 48.5 | 39.7 | 12 |
| Day 3 post-infection | |||
| Mock-infected | 76.7 | 5.3 | 27 |
| AdWT | 56.7 | 7.82 | 37.6 |
| AdRGD | 80.6 | 23 | 0.81 |
| CRAd-S-RGD | 28.3 | 40.9 | 36.4 |
Microarray analysis of CRAd-S-RGD infected tumor cells suggests upregulation of Bax
To screen which genes are associated with CRAd-survivin induced cell death, we performed a cDNA microarray assay 24 h post-infection. Fig. 6A shows the results of hybridizations with different oligo templates. One hundred and thirty-two apoptotic and cell cycle genes were selected as differentially expressed based on variance structure. Each blot represents a sample and each square dot represents a gene. The microarray identified the differential profile of apoptotic and cell defense gene expression. In the case of CRAd-S-RGD, we saw a significant upregulation of the apoptotic protease activating factor (APAF1), BCL-2 antagonist of death (BAD), BCL-2 interacting killer apoptosis-inducing protein (BIK) and BCL-2 associated X-protein (BAX) (Table II).
Figure 6.
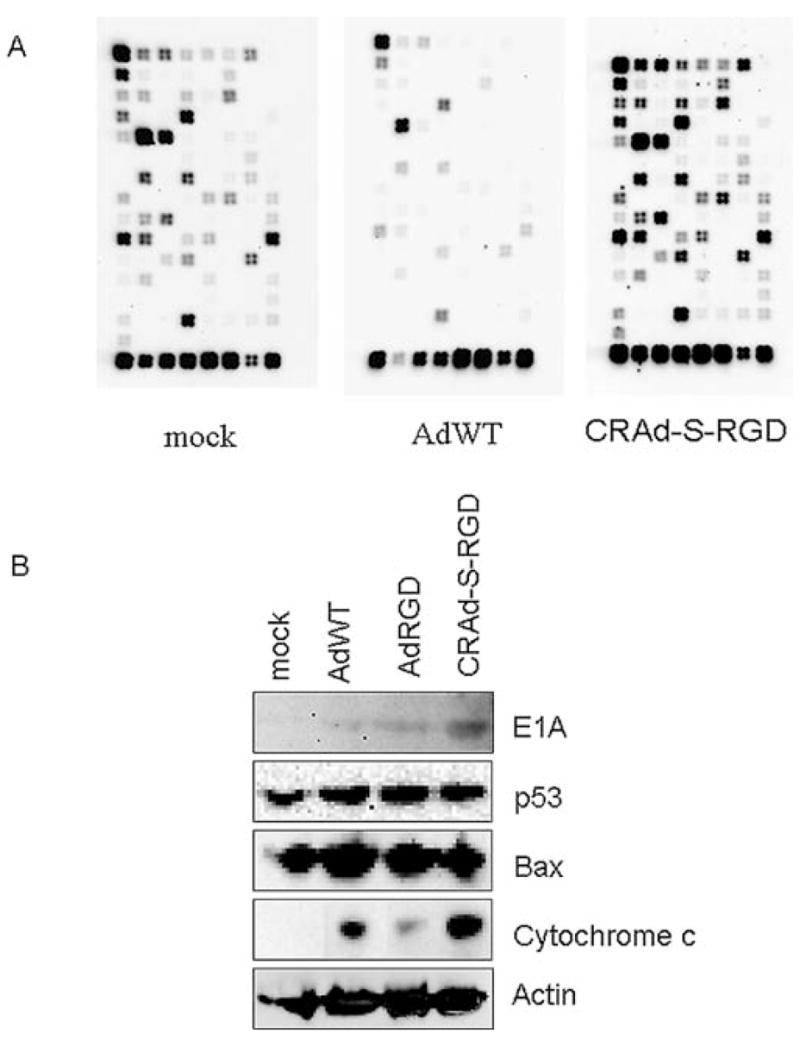
Microarray analysis. (A) Survivin-activated adenovirus induced differential gene expression identified by oligo microarray method. Glioma cells were incubated 24 h with AdWT or CRAd-s-RGD. Total RNA was isolated and subjected to the microarray analysis. (B) Validation of microarray data by Western blotting. Total cellular proteins (50 μg) from infected glioma cells were analyzed in Western blotting with antibodies that recognize apoptotic proteins and the mitochondrial BAX proteins. BAX was not activated by CRAd-S-RGD infection, but was upregulated in AdWT-infected cells. Anti-β-actin antibody was used as a loading control. Cellular p53 and adenoviral proteins (E1A) were used to illustrate the correlation between the expression of these proteins and the downstream targets involved in apoptotic pathways.
Table II.
Adenovirus mediated regulation of gene expression in human glioma cells.
| Agent/fold |
|||||
|---|---|---|---|---|---|
| No. | Symbol | Genbank | Description | AdWT | CRAd-S-RGD |
| 1 | APAF1 (Apoptotic protease activating factor) | NM_001160 | ATP binding, protein binding, regulation of apoptosis, cytosol, intracellular, caspase activation via cytochrome c, neurogenesis, caspase activator activity | 1.02 | 1.41 |
| 2 | BAD (BCL2-antagonist of cell death) | NM_004322 | Apoptosis, induction of programmed cell death | 1.02 | 1.28 |
| 3 | BAX (BCL2-associtaed X protein) | NM_004324 | Integral to membrane, negative regulation of cell cycle, apoptotic mitochondrial changes, induction of apoptosis, regulation of apoptosis, apoptosis, induction of apoptosis by extracellular signals, negative regulation of survival gene product activity | 2.17 | 1.07 |
| 4 | BIK [BCL2-interacting killer (apoptosis-inducing)] | NM_005426 | Integral to membrane, induction of apoptosis, regulation of apoptosis, apoptotic program | 0.21 | 2.26 |
| 5 | Casp 3 (Caspase 3, apoptosis-related cysteine protease) | NM_004346 | Hydrolase activity, proteolysis and peptidolysis, induction of apoptosis, apoptosis, caspase activity, cysteine-type peptidase activity | 1.43 | 1.12 |
| 6 | TP53 (Tumor protein p53) | NM_000546 | Regulation of transcription, DNA-dependent, protein binding, negative regulation of cell cycle, apoptosis, mitochondrion, transcription factor activity, Zinc ion binding, DNA damage response, signal transduction resulting in induction of apoptosis, cell cycle arrest, nucleolus, cell cycle checkpoint, DNA strand annealing activity, copper ion binding, nuclease activity, DNA recombination, base-excision repair, caspase activation via cytochrome c, negative regulation of cell growth, nucleotide-excision repair, regulation of mitochondrial membrane permeability, protein tetramerization, activity negative regulation of helicase activity | 0.98 | 1.36 |
To demonstrate whether the mRNA changes in BAX result in different levels of protein expression, we performed Western blot analysis of the same glioma cell line infected with AdWT, AdRGD and CRAd-S-RGD (Fig. 6B). We observed no significant difference in BAX expression between cells infected with CRAd-S-RGD and AdRGD. Since BAX has been identified as p53 immediate early response gene (26) and the level of E1A activity can modulate p53 (27–29), we also examined p53 expression in treated cells. Here too, we observed no significant difference in p53 expression between cells infected with CRAd-S-RGD vs. AdRGD. Finally, since BAX dimerization can trigger the release of cytochrome c from mitochondria to cytoplasm (30) and cytochrome c is the only known activator of APAF1 (31,32), we also examined cellular fractions derived from CRAd-S-RGD, AdRGD and AdWT-treated cells. As shown in Fig. 6B, a significant increase in cytochrome c release was observed after 24 h of CRAd-S-RGD infection.
CRAd-survivin induces glioma oncolysis via a caspase-independent mechanism
The observed increase in cytochrome c release following infection with CRAd-S-RGD suggested the involvement of caspase-dependent cytotoxicity. In order to investigate whether CRAd-S-RGD induces apoptosis through a caspase-dependent mechanism, the effect of caspase activation was examined by Western blotting. As shown in Fig. 7A, the infection of glioma cells by CRAd-S-RGD did not upregulate cleaved caspase-3 at 48 and 72 h post-infection. To further examine the lack of caspase activation, an MTS assay was done during infection of human glioma No. 10 cells in absence or presence of general caspase inhibitor (Z-VAD-FMK). Treatment of these cells with this inhibitor had no effect on release of LDH (Fig. 7B). These results suggested that CRAd-S-RGD induces cell death in a caspase-independent manner.
Figure 7.

CRAd-S-RGD induces caspase-independent apoptosis in No. 10 human glioma cells. No. 10 cells were infected with AdRGD, AdWT or CRAd-S-RGD at 100 MOI/cell. After 4 h incubation, fresh media was added. Cells were harvested and incubated with (A) polyclonal anti-caspase-3 Abs to detect the level of activated caspase-3 protein by Western blotting. The experiment was performed twice. (B) Z-VAD-FMK blocking of caspase-3 activity was followed by the application of CytoTox™ homogeneous membrane integrity assay. The MTS assay was performed twice, with each experimental group done in quadruplicates. MTS data are presented as a percentage of cytotoxicity±SD.
Characterization of AKT and BAD protein expression
To further investigate the possible mechanism of adenovirus-induced cytotoxicity, we performed Western blot analyses to detect the relative activities of key pro-survival and pro-apoptotic cellular proteins. This is important considering that the ratio of anti-apoptotic to pro-apoptotic protein forms is a major factor in determining whether a cell commits to programmed cell death. For instance, in a number of cell types, activated (phospohorylated) AKT stimulates the amplification of pro-survival signals by phosphorylating BAD, sequestering it in the cytoplasm and thus preventing its translocation to the mitochondria (33). To ascertain the relative protein activities in response to adenovirus-infected cells, we measured the protein levels as well as phosphorylation states of AKT and Bad. As seen in Fig. 8, Western blot data showed upregulation of pro-apoptotic proteins such as non-phosphorylated BAD in AdRGD- and CRAd-S-RGD-infected cells detected at 72 h post-infection. The non-phosphorylated AKT protein was present in much higher levels than phosphorylated AKT in No. 10 cells treated with AdRGD and CRAd-S-RGD at 48 and 72 h post-infection. Of note, at each time point CRAd-S-RGD treated cells showed a slight signal for phosphorylated BAD and AKT. These results suggest that CRAd-S-RGD-induced glioma cell toxicity is independent of an AKT-associated apoptotic pathway. JNK activated protein (JKK) was not observed (not shown) in CRAd-S-RGD- or AdRGD-infected cells after 48 or 72 h post-infection. These results indicate that CRAd-S-RGD as well as AdRGD induces inactivation of AKT and BAD.
Figure 8.
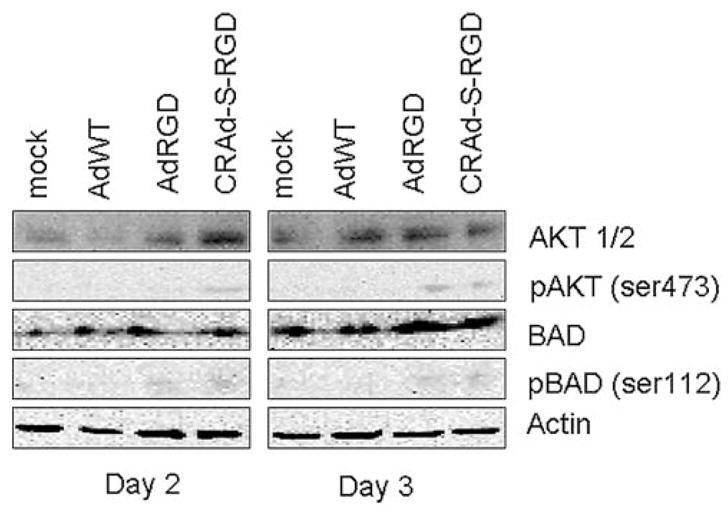
Effect of CRAD-S-RGD on expression of cellular proteins. Human glioma No. 10 cells were treated with AdRGD, AdWT or CRAd-S-RGD at 100 MOI per cell. After 4 h adsorptions, media was replaced and fresh portion was added. At indicated time points, total cell lysates were prepared and Western blotting analysis was performed as described in Materials and methods. Activated/non-activated forms of AKT, BAD were detected. Data shown are representative of two independent experiments.
Induction of autophagy-specific vesicular organelles in CRAd-S-RGD treated cells
The inhibition of AKT signaling has been previously shown to be involved in the induction of autophagy in colon cancer (34) as well as malignant glioma cells (35). Since our results suggested the inactivation of AKT by CRAd-S-RGD we sought to determine whether the cell death induced by CRAd-S-RGD involved autophagy. To do so, we infected No. 10 human glioma cells with AdWT, AdRGD, or CRAd-S-RGD at 100 MOI/cell. After 72 h of incubation, infected cells were examined by electron microscopy. As shown in Fig. 9A, autophagic vacuoles (Acidic Vasicular Organelles, AVOs) were observed in CRAD-S-RGD infected cells, while no similar detection was observed in AdWT-, AdRGD-, or mock-infected cells. Furthermore, to identify the development of AVOs, glioma cells treated with AdWT, AdRGD, or CRAd-S-RGD vectors were analyzed by confocal fluorescent microcopy. At days 1 and 2, CRAd-S-RGD-treated cells appeared similar to mock-infected cells and did not exhibit AVO formation. The significant data were observed at 3 days post-infection when we observed numerous membrane-bound vacuoles characteristic of autophagosomes that were not present in mock-infected cells (Fig. 9B). To further confirm the presence of autophagosomes in CRAd-S-RGD-infected cells, we performed flow cytometric analysis of acridine orange stained cells. As shown in Fig. 9C, CRAd-S-RGD treatment increased the amount of fluorescent cells at day 1 from 5.73 to 18.2% at day 3.
Figure 9.

CRAd-S-RGD induces autophagy of human glioma cells. (A) Electron micrographs of adenovirus infected No. 10 human glioma cells. Mock, AdWT, AdRGD or CRAD-S-RGD treated cells were stained with osmium tetroxide and then embedded. Ultrathin sections were analyzed for induction of autophagosomes. Images were captured at x4060 or x8490 magnification. Bars represent scale of 2.5 or 1 nm. The white arrow shows autophagic vacuoles in the cytoplasm and black arrows indicate the presence of viral particles in the nucleus. No. 10 cells were grown in coverslips and infected with 100 MOI/cell of AdRGD, AdWT or CRAd-S-RGD. After 4 h incubation, media was replaced. At day 3 post infection, cells were stained with 1 μg/ml of acridine orange following fixation with 4% of formalin. Images were captured by immunofluorescence microscope (B) or cells were trypsinized and acidic compartments were quantified by flow cytometry (C).
Treatment of glioma cells with beclin siRNA inhibits cellular autophagy
To determine whether a beclin protein plays a role in viral induced autophagy, we blocked expression of beclin using specific siRNA. Two hours after transfection, targets with this siRNA were transduced with AdWT, AdRGD, or CRAd-S-RGD vectors and then 72 h later, we measured inhibition of autophagosome development by acridine orange staining. As seen in Fig. 10A, transfection of No. 10 cells with beclin siRNA followed by viral infection led to a decrease of AO staining in both samples, especially in CRAd-S-RGD treated cells (3-fold over mock transfected). To visualize inhibition of viral expression, we performed immunofluorescence analyses of cells infected with competent vectors and pretreated with mock or beclin siRNA. As seen in Fig. 10B, both antigens (viral E1A and cellular beclin) were dramatically reduced, but not entirely eliminated in the cells infected with AdWT, AdRGD, or CRAd-S-RGD. The most significant inhibition of E1A expression was observed in samples transfected with BECN siRNA and then transduced with CRAd-S-RGD vector.
Figure 10.

Effect of siRNA treatment on virus-induced autophagy. No. 10 human glioma cells were transfected with 20 pMol of BECN1 (anti-beclin) siRNA and then transduced with the competent vectors as indicated: AdWT, AdRGD or CRAd-S-RGD for 72 h incubation. The cells were then examined by acridine orange staining (A) or viral E1A/beclin expression was detected by immunofluorescence (B). Inhibition of autophagosome development was measured in two independent experiments, with each experiment containing three wells per each treatment group, including controls. Data are presented as mean ± SD. *p<0.05.
Discussion
One of the most significant features of survivin is the differential expression of this protein in cancer vs. normal tissues. While dramatic overexpression of survivin has been demonstrated in a variety of solid malignancies (7–9), its levels are undetectable in most terminally differentiated normal tissues (6). Despite its role in mitosis, the overexpression of survivin in tumors does not simply reflect the presence of a higher number of proliferating cells. As documented by immunohistochemical analysis of breast cancer xenografts, the expression of survivin in cancer is independent of cell proliferation and unrelated to the mitotic index (36). These data suggest that survivin gene expression is globally de-regulated in cancer with uniformally increased survivin expression in all cell cycle phases.
For cancer gene therapy, CRAd replicative specificity is based on tumor-specific transcriptional control of the essential early genes required for replication. The ideal tumor specific promoter (TSP) element would exhibit the widest differential between ‘tumor on/normal tissue off’ expression profiles, key to ablation of toxicity from ectopically localized CRAds. To date, however, few glioma-relevant promoter elements have been suggested and well characterized for employment in CRAds. We have previously shown that the survivin promoter is upregulated in brain tumors (2,3) and that the human survivin promoter represents a novel transcriptional targeting strategy in malignant glioma (1). Consequently, in the present investigation, we utilized the survivin promoter to drive the expression of an oncolytic adenovirus and analyzed the mechanism of viral induced cell killing in the setting of malignant glioma.
As shown by our results, CRAd-S-RGD effectively killed a number of malignant glioma cell lines in vitro. The virus accelerated S-phase induction (40.9%) when compared to AdRGD (23%) and AdWT (7.82%) viruses. This finding is consistent with previously published literature where human cells where shown to arrest in S-phase in response to adenovirus 12 E1A (37). Moreover, when compared with either wild-type or isogenic control AdRGD vectors, CRAd-S-RGD appeared to induce cellular apoptosis. Our microarray data showed upregulation of key genes involved in the apoptotic pathway. However, when we examined protein expression by Western blot analysis, we observed only an increase in cytochrome c release without an increase in caspase expression. Collectively, these data demonstrate that enhanced oncolysis, as mediated via survivin, promotes cellular death via a caspase-independent mechanism.
The mechanism by which the survivin promoter acts in tumor cells is still unknown. Results from previous reports and this study support the hypothesis that the PI3K-AKT pathway is a signaling cascade that is affected by the replication and translation of adenoviral early genes. The PI3K/AKT/mTOR pathway is considered to be a central regulatory pathway of protein translation during cell proliferation, growth, differentiation, and survival (38,39). The dysregulation of the mTOR signaling pathway, presented in many type of tumors including gliomas (40–43), may represent a signaling schema that responds to virus infection in a pro-apoptotic manner through the integration of many different signals (22,44). Upon activation, mTOR phosphorylates its downstream targets, such as p70S6K, promoting cell survival through phosphorylation (inactivation) of the proapoptotic protein BAD (45). As has been previously shown in tumor cells, AKT expression is upregulated in concert with cyclin D expression (46–48) confirming the important role of AKT regulation in the cell cycle (49,50).
In this study, we provide evidence that activation of AKT expression depends on the level of E1A expression mediated by incorporation of a tumor specific promoter into viral genome. We observed significant levels of AKT expression which were proportional to the levels of E1A expression. Nevertheless, the level of active or phosphorylated AKT was very low, and E1A-mediated sensitization to apoptosis is dependent on the inactivation of AKT (46). As expected, the mode of survivin enhanced glioma virotherapy seems very complex. In this particular study, adenovirus stimulates a preponderance of AKT in its non-phosphorylated state, but does not stimulate phosphorylation of the p70s6 protein (data not shown). Non-phosphorylated AKT levels, detected during CRAd infection, suggest the contribution of other targets downstream of the AKT kinase cascade, such as ASK1 or MEKK3 and possibly others involved in regulation of pro- or anti-apoptotic signals (46,51). For instance, E1A mediates upregulation of BAD and BAX as proapoptotic proteins; but at the same time, we detected upregulation of certain anti-apoptotic genes via microarray (i.e. BCL2). Apparently, one of the key elements of these cascades could be the p53 protein.
The presence of wild-type endogenous p53 in human gliomas could regulate an oncolytic effect following infection with different CRAds. In our study, we observe a significant difference in the killing effect mediated by CRAd-S-RGD in U373MG and U87MG, two cell lines which exhibit differential p53 genotypic profiles (52,53). Mirza and colleagues have shown that wild-type p53 represses survivin expression at both mRNA and protein levels (54). Transient transfection analyses revealed that the expression of wild-type p53, but not mutant p53, was associated with strong repression of the survivin promoter in various cell types. The overexpression of exogenous survivin protein was shown to rescue cells from p53-induced apoptosis in a dose-dependent manner, suggesting that loss of survivin mediates, at least in part, the p53-dependent apoptotic pathway. In spite of the presence of two putative p53-binding sites in the survivin promoter, deletion and mutation analyses suggested that neither site is required for transcriptional repression of survivin expression. This was confirmed by chromatin immunoprecipitation assays. Further analyses suggested that the modification of chromatin within the survivin promoter could be a molecular explanation for silencing of survivin gene transcription by p53. This interaction between survivin and p53 has particular implication in neuro-oncology, where the majority of tumors, including the No. 10 glioma tested in this study, have been shown to exhibit p53 mutations (55–58).
In addition to p53, the other most common genetically mutated pathway in human gliomas is the RB/E2F pathway (59–64). Both p53 and RB/E2F pathways, when intact, provide essential checkpoints in the maintenance of normal cell growth and protect the cell from DNA damage. Using non-transformed embryonic fibroblasts, Jiang et al have shown evidence of a molecular link between the regulation of survivin transcription and the RB/E2F family of proteins (65). The authors demonstrated that both pRB and p130 can interact with the survivin promoter and can repress survivin transcription. They also showed that the E2F activators (E2F1, E2F2, and E2F3) can bind to the survivin promoter and induce survivin transcription. Genetically modified cells that harbor deletions in various members of the RB/E2F family confirm the data from the wild-type cells. These findings implicate several members of the RB/E2F pathway in an intricate mechanism of survivin gene regulation that, when genetically altered during the process of tumorigenesis, may function within cancer cells to aberrantly alter survivin levels and enhance tumor progression. Consequently, since only intact p53 or RB/E2F, but not mutant, are associated with repression of the survivin promoter, its high level of expression in malignant brain tumors represents an attractive promoter target for use in oncolytic virotherapy.
The other interesting observation recently came from experiments conducted by Li et al (66). This study showed that adenovirus-driven E1A expression does not lead to the activation of caspase-3 pathways. Moreover, blocking infection with ZVAD-FMK did not change the level of caspase activation. In our study, we confirm this evidence by using LDH analysis of Z-VAD-FMK blocking/unblocking CRAd-infected cells after 72 h of infection. These studies suggest that perhaps apoptosis is not a terminal stage of virus-induced toxicity and, in fact, it is highly possible that autophagy is a cellular process which can lead to the terminal stages of mitochondrial proapoptotic pathways such as caspase-3 activation. For instance, E4ORF4 was shown to induce DNA laddering and chromatic condensation in Chinese Hamster Ovary cells, but not procaspase-3 processing (67); whereas in other cell lines, caspase activation was found to occur (68). Thus, given the available evidence, Ads induce cells to die via multiple pathways including some that generate classical apoptosis features; however, the exact process differs with the cell type because with each cell type the signaling schemas in place differ such that different responses to adenoviral infection could result in similar death pathways. It seems plausible that exactly which mechanism of cell death is utilized by the virus, and also which viral proteins are involved, is in place because of evolutionary pressures which drove the generation of vectors that display broad infectivity profiles, allowing the virus to kill cells which represent a variety of tissue types and molecular signaling pathways.
Acknowledgments
This work was supported by the National Cancer Institute (R01-CA122930), the National Institute of Neurological Disorders and Stroke (K08-NS046430), The Alliance for Cancer Gene Therapy Young Investigator Award, and the American Cancer Society (RSG-07-276-01-MGO). We wish to thank Drs Elena Efimova (Department of Radiation Oncology, The University of Chicago), Christine Labno and Vytas Bandokas (Immunofluorescence Core Facility, The University of Chicago), Yimei Chen (Electron Microscopy Facility, The University of Chicago) and Angel Rivera (University of Alabama at Birmingham) for technical support.
References
- 1.Van Houdt WJ, Haviv YS, Lu B, et al. The human survivin promoter: a novel transcriptional targeting strategy for treatment of glioma. J Neurosurg. 2006;104:583–592. doi: 10.3171/jns.2006.104.4.583. [DOI] [PubMed] [Google Scholar]
- 2.Zhu ZB, Makhija SK, Lu B, et al. Transcriptional targeting of tumors with a novel tumor-specific survivin promoter. Cancer Gene Ther. 2004;11:256–262. doi: 10.1038/sj.cgt.7700679. [DOI] [PubMed] [Google Scholar]
- 3.Zhu ZB, Makhija SK, Lu B, et al. Incorporating the survivin promoter in an infectivity enhanced CRAd-analysis of oncolysis and anti-tumor effects in vitro and in vivo. Int J Oncol. 2005;27:237–246. [PubMed] [Google Scholar]
- 4.Zhu ZB, Chen Y, Makhija SK, et al. Survivin promoter-based conditionally replicative adenoviruses target cholangiocarcinoma. Int J Oncol. 2006;29:1319–1329. [PubMed] [Google Scholar]
- 5.Ulasov I, Rivera A, Sonabend A, et al. Comparative evaluation of survivin, midkine, and CXCR4 promoters for transcriptional targeting of glioma gene therapy. Cancer Biol Ther. 2007;6:679–685. doi: 10.4161/cbt.6.5.3957. [DOI] [PubMed] [Google Scholar]
- 6.Ambrosini G, Adida C, Altieri DC. A novel anti-apoptosis gene, survivin, expressed in cancer and lymphoma. Nat Med. 1997;3:917–921. doi: 10.1038/nm0897-917. [DOI] [PubMed] [Google Scholar]
- 7.Yamamoto T, Tanigawa N. The role of survivin as a new target of diagnosis and treatment in human cancer. Med Electron Microsc. 2001;34:207–212. doi: 10.1007/s007950100017. [DOI] [PubMed] [Google Scholar]
- 8.Chiou SK, Jones MK, Tarnawski AS. Survivin - an anti-apoptosis protein: its biological roles and implications for cancer and beyond. Med Sci Monit. 2003;9:PI25–P129. [PubMed] [Google Scholar]
- 9.O’Driscoll L, Linehan R, Clynes M. Survivin: role in normal cells and in pathological conditions. Curr Cancer Drug Targets. 2003;3:131–152. doi: 10.2174/1568009033482038. [DOI] [PubMed] [Google Scholar]
- 10.Zaffaroni N, Daidone MG. Survivin expression and resistance to anticancer treatments: perspectives for new therapeutic interventions. Drug Resist Updat. 2002;5:65–72. doi: 10.1016/s1368-7646(02)00049-3. [DOI] [PubMed] [Google Scholar]
- 11.Giodini A, Kallio MJ, Wall NR, et al. Regulation of microtubule stability and mitotic progression by survivin. Cancer Res. 2002;62:2462–2467. [PubMed] [Google Scholar]
- 12.Kallio MJ, Nieminen M, Eriksson JE. Human inhibitor of apoptosis protein (IAP) survivin participates in regulation of chromosome segregation and mitotic exit. FASEB J. 2001;15:2721–2723. doi: 10.1096/fj.01-0280fje. [DOI] [PubMed] [Google Scholar]
- 13.Lens SM, Wolthuis RM, Klompmaker R, et al. Survivin is required for a sustained spindle checkpoint arrest in response to lack of tension. EMBO J. 2003;22:2934–2947. doi: 10.1093/emboj/cdg307. [DOI] [PMC free article] [PubMed] [Google Scholar]
- 14.Yang D, Welm A, Bishop JM. Cell division and cell survival in the absence of survivin. Proc Natl Acad Sci USA. 2004;101:15100–15105. doi: 10.1073/pnas.0406665101. [DOI] [PMC free article] [PubMed] [Google Scholar]
- 15.Das A, Tan WL, Teo J, Smith DR. Expression of survivin in primary glioblastomas. J Cancer Res Clin Oncol. 2002;128:302–306. doi: 10.1007/s00432-002-0343-4. [DOI] [PubMed] [Google Scholar]
- 16.Kajiwara Y, Yamasaki F, Hama S, et al. Expression of survivin in astrocytic tumors: correlation with malignant grade and prognosis. Cancer. 2003;97:1077–1083. doi: 10.1002/cncr.11122. [DOI] [PubMed] [Google Scholar]
- 17.Kleinschmidt-DeMasters BK, Heinz D, McCarthy PJ, et al. Survivin in glioblastomas. Protein and messenger RNA expression and comparison with telomerase levels. Arch Pathol Lab Med. 2003;127:826–833. doi: 10.5858/2003-127-826-SIG. [DOI] [PubMed] [Google Scholar]
- 18.Yamada Y, Kuroiwa T, Nakagawa T, et al. Transcriptional expression of survivin and its splice variants in brain tumors in humans. J Neurosurg. 2003;99:738–745. doi: 10.3171/jns.2003.99.4.0738. [DOI] [PubMed] [Google Scholar]
- 19.Chakravarti A, Noll E, Black PM, et al. Quantitatively determined survivin expression levels are of prognostic value in human gliomas. J Clin Oncol. 2002;20:1063–1068. doi: 10.1200/JCO.2002.20.4.1063. [DOI] [PubMed] [Google Scholar]
- 20.Kamizono J, Nagano S, Murofushi Y, et al. Survivin-responsive conditionally replicating adenovirus exhibits cancer-specific and efficient viral replication. Cancer Res. 2005;65:5284–5291. doi: 10.1158/0008-5472.CAN-04-2657. [DOI] [PubMed] [Google Scholar]
- 21.Abou El Hassan MA, van der Meulen-Muileman I, Abbas S, Kruyt FA. Conditionally replicating adenoviruses kill tumor cells via a basic apoptotic machinery-independent mechanism that resembles necrosis-like programmed cell death. J Virol. 2004;78:12243–12251. doi: 10.1128/JVI.78.22.12243-12251.2004. [DOI] [PMC free article] [PubMed] [Google Scholar]
- 22.Ito H, Aoki H, Kuhnel F, et al. Autophagic cell death of malignant glioma cells induced by a conditionally replicating adenovirus. J Natl Cancer Inst. 2006;98:625–636. doi: 10.1093/jnci/djj161. [DOI] [PubMed] [Google Scholar]
- 23.Yamamoto M, Davydova J, Wang M, et al. Infectivity enhanced, cyclooxygenase-2 promoter-based conditionally replicative adenovirus for pancreatic cancer. Gastroenterology. 2003;125:1203–1218. doi: 10.1016/s0016-5085(03)01196-x. [DOI] [PubMed] [Google Scholar]
- 24.Graham FL, Smiley J, Russell WC, Nairn R. Characteristics of a human cell line transformed by DNA from human adenovirus type 5. J Gen Virol. 1977;36:59–74. doi: 10.1099/0022-1317-36-1-59. [DOI] [PubMed] [Google Scholar]
- 25.Kanzawa T, Germano IM, Komata T, Ito H, Kondo Y, Kondo S. Role of autophagy in temozolomide-induced cytotoxicity for malignant glioma cells. Cell Death Differ. 2004;11:448–457. doi: 10.1038/sj.cdd.4401359. [DOI] [PubMed] [Google Scholar]
- 26.Selvakumaran M, Lin HK, Miyashita T, et al. Immediate early up-regulation of bax expression by p53 but not TGF beta 1: a paradigm for distinct apoptotic pathways. Oncogene. 1994;9:1791–1798. [PubMed] [Google Scholar]
- 27.Lomonosova E, Subramanian T, Chinnadurai G. Mitochondrial localization of p53 during adenovirus infection and regulation of its activity by E1B-19K. Oncogene. 2005;24:6796–6808. doi: 10.1038/sj.onc.1208836. [DOI] [PubMed] [Google Scholar]
- 28.Nakajima T, Morita K, Tsunoda H, et al. Stabilization of p53 by adenovirus E1A occurs through its amino-terminal region by modification of the ubiquitin-proteasome pathway. J Biol Chem. 1998;273:20036–20045. doi: 10.1074/jbc.273.32.20036. [DOI] [PubMed] [Google Scholar]
- 29.Querido E, Teodoro JG, Branton PE. Accumulation of p53 induced by the adenovirus E1A protein requires regions involved in the stimulation of DNA synthesis. J Virol. 1997;71:3526–3533. doi: 10.1128/jvi.71.5.3526-3533.1997. [DOI] [PMC free article] [PubMed] [Google Scholar]
- 30.Eskes R, Antonsson B, Osen-Sand A, et al. Bax-induced cytochrome C release from mitochondria is independent of the permeability transition pore but highly dependent on Mg2+ ions. J Cell Biol. 1998;143:217–224. doi: 10.1083/jcb.143.1.217. [DOI] [PMC free article] [PubMed] [Google Scholar]
- 31.Cao G, Xiao M, Sun F, et al. Cloning of a novel Apaf-1-interacting protein: a potent suppressor of apoptosis and ischemic neuronal cell death. J Neurosci. 2004;24:6189–6201. doi: 10.1523/JNEUROSCI.1426-04.2004. [DOI] [PMC free article] [PubMed] [Google Scholar]
- 32.Li P, Nijhawan D, Budihardjo I, et al. Cytochrome c and dATP-dependent formation of Apaf-1/caspase-9 complex initiates an apoptotic protease cascade. Cell. 1997;91:479–489. doi: 10.1016/s0092-8674(00)80434-1. [DOI] [PubMed] [Google Scholar]
- 33.Downward J. Mechanisms and consequences of activation of protein kinase B/Akt. Curr Opin Cell Biol. 1998;10:262–7. doi: 10.1016/s0955-0674(98)80149-x. [DOI] [PubMed] [Google Scholar]
- 34.Ellington AA, Berhow MA, Singletary KW. Inhibition of Akt signaling and enhanced ERK1/2 activity are involved in induction of macroautophagy by triterpenoid B-group soyasaponins in colon cancer cells. Carcinogenesis. 2006;27:298–306. doi: 10.1093/carcin/bgi214. [DOI] [PubMed] [Google Scholar]
- 35.Takeuchi H, Kondo Y, Fujiwara K, et al. Synergistic augmentation of rapamycin-induced autophagy in malignant glioma cells by phosphatidylinositol 3-kinase/protein kinase B inhibitors. Cancer Res. 2005;65:3336–3346. doi: 10.1158/0008-5472.CAN-04-3640. [DOI] [PubMed] [Google Scholar]
- 36.Tanaka K, Iwamoto S, Gon G, Nohara T, Iwamoto M, Tanigawa N. Expression of survivin and its relationship to loss of apoptosis in breast carcinomas. Clin Cancer Res. 2000;6:127–134. [PubMed] [Google Scholar]
- 37.Grand RJ, Ibrahim AP, Taylor AM, et al. Human cells arrest in S phase in response to adenovirus 12 E1A. Virology. 1998;244:330–342. doi: 10.1006/viro.1998.9102. [DOI] [PubMed] [Google Scholar]
- 38.Vivanco I, Sawyers CL. The phosphatidylinositol 3-Kinase AKT pathway in human cancer. Nat Rev Cancer. 2002;2:489–501. doi: 10.1038/nrc839. [DOI] [PubMed] [Google Scholar]
- 39.Bjornsti MA, Houghton PJ. The TOR pathway: a target for cancer therapy. Nat Rev Cancer. 2004;4:335–348. doi: 10.1038/nrc1362. [DOI] [PubMed] [Google Scholar]
- 40.Janus A, Robak T, Smolewski P. The mammalian target of the rapamycin (mTOR) kinase pathway: its role in tumourigenesis and targeted antitumour therapy. Cell Mol Biol Lett. 2005;10:479–498. [PubMed] [Google Scholar]
- 41.Nakamura JL, Karlsson A, Arvold ND, et al. PKB/Akt mediates radiosensitization by the signaling inhibitor LY294002 in human malignant gliomas. J Neurooncol. 2005;71:215–222. doi: 10.1007/s11060-004-1718-y. [DOI] [PubMed] [Google Scholar]
- 42.Liu L, Li F, Cardelli JA, Martin KA, Blenis J, Huang S. Rapamycin inhibits cell motility by suppression of mTOR-mediated S6K1 and 4E-BP1 pathways. Oncogene. 2006;25:7029–7040. doi: 10.1038/sj.onc.1209691. [DOI] [PubMed] [Google Scholar]
- 43.Cao C, Subhawong T, Albert JM, et al. Inhibition of mammalian target of rapamycin or apoptotic pathway induces autophagy and radiosensitizes PTEN null prostate cancer cells. Cancer Res. 2006;66:10040–10047. doi: 10.1158/0008-5472.CAN-06-0802. [DOI] [PubMed] [Google Scholar]
- 44.Noda T, Ohsumi Y. Tor, a phosphatidylinositol kinase homologue, controls autophagy in yeast. J Biol Chem. 1998;273:3963–3966. doi: 10.1074/jbc.273.7.3963. [DOI] [PubMed] [Google Scholar]
- 45.Harada H, Andersen JS, Mann M, Terada N, Korsmeyer SJ. p70S6 kinase signals cell survival as well as growth, inactivating the pro-apoptotic molecule BAD. Proc Natl Acad Sci USA. 2001;98:9666–9670. doi: 10.1073/pnas.171301998. [DOI] [PMC free article] [PubMed] [Google Scholar]
- 46.Liao Y, Hung MC. Regulation of the activity of p38 mitogen-activated protein kinase by Akt in cancer and adenoviral protein E1A-mediated sensitization to apoptosis. Mol Cell Biol. 2003;23:6836–6848. doi: 10.1128/MCB.23.19.6836-6848.2003. [DOI] [PMC free article] [PubMed] [Google Scholar]
- 47.Testa JR, Bellacosa A. AKT plays a central role in tumorigenesis. Proc Natl Acad Sci USA. 2001;98:10983–5. doi: 10.1073/pnas.211430998. [DOI] [PMC free article] [PubMed] [Google Scholar]
- 48.Nicholson KM, Anderson NG. The protein kinase B/Akt signalling pathway in human malignancy. Cell Signal. 2002;14:381–395. doi: 10.1016/s0898-6568(01)00271-6. [DOI] [PubMed] [Google Scholar]
- 49.Kandel ES, Skeen J, Majewski N, et al. Activation of Akt/protein kinase B overcomes a G(2)/m cell cycle checkpoint induced by DNA damage. Mol Cell Biol. 2002;22:7831–7841. doi: 10.1128/MCB.22.22.7831-7841.2002. [DOI] [PMC free article] [PubMed] [Google Scholar]
- 50.Shtivelman E, Sussman J, Stokoe D. A role for PI 3-kinase and PKB activity in the G2/M phase of the cell cycle. Curr Biol. 2002;12:919–924. doi: 10.1016/s0960-9822(02)00843-6. [DOI] [PubMed] [Google Scholar]
- 51.Kim AH, Khursigara G, Sun X, Franke TF, Chao MV. Akt phosphorylates and negatively regulates apoptosis signal-regulating kinase 1. Mol Cell Biol. 2001;21:893–901. doi: 10.1128/MCB.21.3.893-901.2001. [DOI] [PMC free article] [PubMed] [Google Scholar]
- 52.Park CM, Park MJ, Kwak HJ, et al. Induction of p53-mediated apoptosis and recovery of chemosensitivity through p53 transduction in human glioblastoma cells by cisplatin. Int J Oncol. 2006;28:119–125. [PubMed] [Google Scholar]
- 53.Datta K, Babbar P, Srivastava T, Sinha S, Chattopadhyay P. p53 dependent apoptosis in glioma cell lines in response to hydrogen peroxide induced oxidative stress. Int J Biochem Cell Biol. 2002;34:148–157. doi: 10.1016/s1357-2725(01)00106-6. [DOI] [PubMed] [Google Scholar]
- 54.Mirza A, McGuirk M, Hockenberry TN, et al. Human survivin is negatively regulated by wild-type p53 and participates in p53-dependent apoptotic pathway. Oncogene. 2002;21:2613–2622. doi: 10.1038/sj.onc.1205353. [DOI] [PubMed] [Google Scholar]
- 55.Kim EL, Yoshizato K, Kluwe L, et al. Comparative assessment of the functional p53 status in glioma cells. Anticancer Res. 2005;25:213–224. [PubMed] [Google Scholar]
- 56.Pardo FS, Hsu DW, Zeheb R, Efird JT, Okunieff PG, Malkin DM. Mutant, wild type, or overall p53 expression: freedom from clinical progression in tumours of astrocytic lineage. Br J Cancer. 2004;91:1678–1686. doi: 10.1038/sj.bjc.6602161. [DOI] [PMC free article] [PubMed] [Google Scholar]
- 57.Stander M, Peraud A, Leroch B, Kreth FW. Prognostic impact of TP53 mutation status for adult patients with supratentorial World Health Organization Grade II astrocytoma or oligoastrocytoma: a long-term analysis. Cancer. 2004;101:1028–1035. doi: 10.1002/cncr.20432. [DOI] [PubMed] [Google Scholar]
- 58.Yusoff AA, Abdullah J, Abdullah MR, Mohd Ariff AR, Isa MN. Association of p53 tumor suppressor gene with paraclinical and clinical modalities of gliomas patients in Malaysia. Acta Neurochir. 2004;146:595–601. doi: 10.1007/s00701-004-0250-3. [DOI] [PubMed] [Google Scholar]
- 59.Fueyo J, Gomez-Manzano C, Yung WK, et al. Overexpression of E2F-1 in glioma triggers apoptosis and suppresses tumor growth in vitro and in vivo. Nat Med. 1998;4:685–690. doi: 10.1038/nm0698-685. [DOI] [PubMed] [Google Scholar]
- 60.Gomez-Manzano C, Fueyo J, Alameda F, Kyritsis AP, Yung WK. Gene therapy for gliomas: p53 and E2F-1 proteins and the target of apoptosis. Int J Mol Med. 1999;3:81–85. doi: 10.3892/ijmm.3.1.81. [DOI] [PubMed] [Google Scholar]
- 61.Gomez-Manzano C, Lemoine MG, Hu M, et al. Adenovirally-mediated transfer of E2F-1 potentiates chemosensitivity of human glioma cells to temozolomide and BCNU. Int J Oncol. 2001;19:359–365. doi: 10.3892/ijo.19.2.359. [DOI] [PubMed] [Google Scholar]
- 62.Gomez-Manzano C, Mitlianga P, Fueyo J, et al. Transfer of E2F-1 to human glioma cells results in transcriptional up-regulation of Bcl-2. Cancer Res. 2001;61:6693–6697. [PubMed] [Google Scholar]
- 63.Mitlianga PG, Gomez-Manzano C, Kyritsis AP, Fueyo J. Overexpression of E2F-1 leads to bax-independent cell death in human glioma cells. Int J Oncol. 2002;21:1015–1020. [PubMed] [Google Scholar]
- 64.Mitlianga PG, Kyritsis AP, Gomez-Manzano C, et al. Co-expression of E2F-2 enhances the p53 anti-cancer effect in human glioma cells. Int J Oncol. 2001;18:343–347. doi: 10.3892/ijo.18.2.343. [DOI] [PubMed] [Google Scholar]
- 65.Jiang Y, Saavedra HI, Holloway MP, Leone G, Altura RA. Aberrant regulation of survivin by the RB/E2F family of proteins. J Biol Chem. 2004;279:40511–40520. doi: 10.1074/jbc.M404496200. [DOI] [PubMed] [Google Scholar]
- 66.Li B, Liu X, Fan J, et al. A survivin-mediated oncolytic adenovirus induces non-apoptotic cell death in lung cancer cells and shows antitumoral potential in vivo. J Gene Med. 2006;8:1232–1242. doi: 10.1002/jgm.953. [DOI] [PubMed] [Google Scholar]
- 67.Lavoie JN, Nguyen M, Marcellus RC, Branton PE, Shore GC. E4orf4, a novel adenovirus death factor that induces p53-independent apoptosis by a pathway that is not inhibited by zVAD-fmk. J Cell Biol. 1998;140:637–645. doi: 10.1083/jcb.140.3.637. [DOI] [PMC free article] [PubMed] [Google Scholar]
- 68.Livne A, Shtrichman R, Kleinberger T. Caspase activation by adenovirus e4orf4 protein is cell line specific and is mediated by the death receptor pathway. J Virol. 2001;75:789–798. doi: 10.1128/JVI.75.2.789-798.2001. [DOI] [PMC free article] [PubMed] [Google Scholar]