

Abstract
TNF-α has both proinflammatory and immunoregulatory functions. Whereas a protective role for TNF administration in systemic lupus erythematosus (SLE)-prone (New Zealand Black × New Zealand White)F1 mice has been established, it remains uncertain whether this effect segregates at the individual TNFR. We generated SLE-prone New Zealand Mixed 2328 mice genetically deficient in TNFR1, in TNFR2, or in both receptors. Doubly-deficient mice developed accelerated pathological and clinical nephritis with elevated levels of circulating IgG anti-dsDNA autoantibodies and increased numbers of CD4+ T lymphocytes, especially activated memory (CD44highCD62Llow) CD4+ T cells. We show that these cells expressed a Th17 gene profile, were positive for IL-17 intracellular staining by FACS, and produced exogenous IL-17 in culture. In contrast, immunological, pathological, and clinical profiles of mice deficient in either TNFR alone did not differ from those in each other or from those in wild-type controls. Thus, total ablation of TNF-α-mediated signaling was highly deleterious to the host in the New Zealand Mixed 2328 SLE model. These observations may have profound ramifications for the use of TNF and TNFR antagonists in human SLE and related autoimmune disorders, as well as demonstrate, for the first time, the association of the Th17 pathway with an animal model of SLE.
Tumor necrosis factor-α generates a wide range of biological effects, including cellular differentiation, proliferation, and apoptosis (1–4). The variability in such responses is attributable, in part, to the presence of two distinct transmembrane receptors: the type I, p55 TNFR (TNFR1) and the type II, p75 TNFR (TNFR2) (5). The p55 TNFR is expressed ubiquitously, whereas p75 TNFR expression is more tightly regulated and found predominantly on hematopoietic cells and endothelial cells. These two receptors can mediate distinct cellular responses through activation of different signaling cascades (5, 6). The p55 TNFR primarily mediates TNF-induced inflammation and cell death, whereas the effects of p75 TNFR signaling include promotion of proliferative responses in thymocytes, T lymphocytes, and other hematopoietic cells (7) and the induction of apoptosis in mature activated T cells (8). Thus, the TNF/TNFR system subserves two important functions: that of a potent proinflammatory mediator, and that of a key immune regulator.
In light of the pleiotropic properties of the TNF/TNFR system, the effects of either blocking or administering TNF on autoimmunity have varied significantly from disease to disease. In humans, anti-TNF agents are therapeutic in rheumatoid arthritis and chronic inflammatory bowel disease (9, 10). In murine anti-glomerular basement membrane Ab-induced glomerulonephritis, experimental autoimmune encephalomyelitis (EAE),3 and experimental allergic uveitis, anti-TNF treatment is likewise beneficial (11–13). In stark contrast to these salutary effects of TNF neutralization, TNF administration reduces the incidence of spontaneous insulin-dependent diabetes mellitus in adult NOD mice, results that are reproduced by local transgene-encoded TNF overexpression in pancreatic islet cells (14–16). Experiments conducted in the (New Zealand Black (NZB) × New Zealand White (NZW))F1 mouse model of systemic lupus erythematosus (SLE) have clearly demonstrated the benefits of early administration of rTNF or TNF-inducing agents on inhibition of nephritis (17–19). Indeed, autoimmunity and nephritis are accelerated in NZB mice deficient in TNF (20). Taken together, these findings suggest that the pathophysiological role for TNF in certain disorders is that of a proinflammatory agent. Hence, neutralization or elimination of TNF is beneficial to the host. In other disorders, however, the role for TNF is that of an immune regulator; therefore, administration or induction of TNF is beneficial to the host.
The need to understand the molecular foundation for the contrasting effects of TNF is further highlighted by reports that, rather than improving their condition, anti-TNF treatments in some patients with rheumatoid arthritis or chronic inflammatory bowel disease incite the development of autoantibodies, neuroinflammatory disease, or SLE-like features (21–23). Moreover, TNF blockade in multiple sclerosis patients has led to immune activation and disease exacerbation (24, 25). Nevertheless, it has recently been suggested that anti-TNF agents can be therapeutically administered to SLE patients (26, 27), emphasizing the pressing need for a greater understanding of the TNF/TNFR system.
The inherent complexity of the TNF/TNFR system is manifest through the divergent roles for the p55 and p75 TNFRs in some autoimmune diseases. In myelin oligodendrocyte glycoprotein-induced EAE, deletion of the p55 receptor confers resistance to acute clinical disease, whereas deletion of the p75 receptor exacerbates disease (28). Moreover, Kassiotis and Kollias (29) have shown in this system that TNFR1/TNFR2 doubly-deficient mice develop a late-onset chronic EAE, whereas mice singly deficient in TNFR1 or TNFR2 fail to develop this late onset complication. In anti-glomerular basement membrane Ab-induced glomerulonephritis, p75 deficiency is protective, whereas p55-deficient mice develop proteinuria and renal pathology similar to those in wild-type (WT) controls (30). In addition, p55 deficiency greatly accelerates lymphadenopathy, autoantibody production, and mortality in C57BL/6-lpr mice (31).
To date, no study has compared the effects of p55 TNFR1 deficiency vs p75 TNFR2 deficiency vs deficiencies of both in any spontaneous SLE-prone models. The goal of this study, therefore, was to evaluate the effects of the various TNFR deficiencies in SLE-prone New Zealand Mixed (NZM) 2328 mice (32). We report in this study that TNFR1/TNFR2 doubly-deficient NZM 2328 mice, but not those singly deficient for either TNFR, develop an accelerated disease associated with early accumulation of activated memory T cells that express the highly pathogenic Th17 gene profile. These findings may have important therapeutic ramifications for human SLE.
Materials and Methods
Mice
The mice were maintained at the University of Southern California, and the experiments were approved by the Institutional Animal Care and Use Committee. The p55 TNFR1- and p75 TNFR2-deficient mice on a C57BL/6 background (Jackson ImmunoResearch Laboratories) were backcrossed into SLE-prone NZM 2328 mice. Introgression of the genotypes (p55−/− or p75−/−) was accelerated by a marker-assisted protocol (33) using relevant microsatellite markers. The N6 backcross generation (p55+/− or p75+/−) was fully congenic. Subsequently, NZM.p55+/− males and females were crossed, yielding NZM mice that were p55−/−. The same was done with NZM.p75+/− mice, yielding NZM mice that were p75−/−. Singly-deficient mice were then intercrossed to yield doubly-deficient mice (p55−/−/p75−/−). TNFR deficiency was confirmed in the resulting mice by the absence of the TNFR proteins in Western blot analysis using anti-TNFR1 or anti-TNFR2 polyclonal Abs (data not shown). The p55 and p75 genes are located on mouse chromosomes 6 (60, 55 cM) and 4 (75.5 cM), respectively, in regions not considered to be associated with susceptibility or resistance to SLE. It is, therefore, unlikely that inadvertent introduction or elimination of susceptibility or resistance genes had occurred as a consequence of the respective introgressions.
Detection of the p55 and p75 genotypes
Genomic DNA extracted from mouse tail clippings was PCR amplified with the following primers: p55, 5′-GGATTGTCACGGTGCCGTTGAA G-3′, 5′-TGACAAGGACACGGTGTGTGGC-3′, 5′-TGCTGATGGGGATACATCCATC-3′, and 5′-CCGGTGGATGTGGAATGTGTG-3′; and/or p75, 5′-CCCACAGCTGCAGTTCGAAG-3′, 5′-AGGACTCTGTGTAAAGAGGCGTGT-3′, and 5′-CCTCTGAGCCCAGAAAGCGAA-3′ for 30 cycles at 94°C for 30 s, 57°C for 30 s, and 72°C for 45 s. The PCR products were electrophoresed in 3% agarose gel containing ethidium bromide, and the bands were exposed under UV light. The band sizes for the intact p55 and p75 gene fragments are 120 and 226 bp, respectively, whereas the band sizes for the disrupted p55 and p75 genes are 155 and 603 bp, respectively.
Cell surface staining
Mouse spleen mononuclear cells were stained with combinations of FITC-, PE-, PerCP/Cy5-, and allophycocyanin-conjugated mAb specific for murine CD3, CD4, CD5, CD8, CD11b, CD19, CD21, CD23, CD25, CD44, CD62L, CD69, NK1.1, IgM, and IgD (BD Pharmingen and eBioscience) and analyzed by FACS.
Serum autoantibody determinations
Sera were assayed for levels of IgG and IgM anti-chromatin, anti-histone, and anti-dsDNA autoantibodies by ELISA, as described (34), with minor changes. Sera from five females, 36- to 38-wk-old (NZB × NZW)F1 mice, were combined together and assayed at 1/200 dilution on each plate, and the average OD of these sera for each autoantigen was arbitrarily set at a value of 100 (U). Values for the test sera were calculated as (ODserum/ODcontrol) × 100.
Spleen immunofluorescence
OCT-embedded frozen spleen sections were stained with PE-conjugated anti-B220 mAb (BD Biosciences), FITC-conjugated anti-MOMA-1 mAb (Serotec), or Alexa 546-conjugated peanut agglutinin (Invitrogen Life Technologies) for 45 min at room temperature and mounted with Fluoromount G (Electron Microscopy Sciences). Stained sections were examined by fluorescence microscopy (Nikon E600).
Assessment of nephritis
The development of proteinuria was assessed weekly using Albustix assay strips (Bayer) with a scale ranging from 0 to 4+. Severe proteinuria was defined as ≥3+ (>300 mg/dl) on two consecutive examinations. For the assessment of renal histology, half of each kidney was fixed in 4% formaldehyde. Paraffin sections were stained with H&E, periodic acid-Schiff, and Masson's Trichrome, and scored in a blind fashion (using a 0–3 scale) for the following features: glomerular hypercellularity, necrotizing lesions, karyorrhexis, cellular crescents, and hyaline deposits (these features indicate glomerular activity score); interstitial inflammation, tubular cell necrosis, and epithelial cells or macrophages in tubular lumens (tubulointerstitial activity score); and glomerulosclerosis, glomerular scars, fibrous crescents, tubular atrophy, and interstitial fibrosis (chronic lesion score). The scores for individual features were summed to obtain the three main scores (glomerular activity score, tubulointerstitial activity score, and chronic lesion score), and then the three main scores were summed to obtain a composite kidney biopsy score (KBS). In addition, glomerulonephritis was classified histopathologically according to the scheme developed by the World Health Organization and widely used in human SLE.
For immunofluorescence, kidney tissue was embedded in OCT compound, and unfixed frozen sections were stained with 1:20 goat anti-mouse IgG1 or IgG2b (Southern Biotechnology Associates) or with rabbit anti-mouse C3 (Cappel Laboratories).
Gene expression profiling
CD4+CD44highCD62Llow/neg spleen cells were isolated from 5-mo-old female p55/p75 double-knockout (DKO) NZM 2328 mice or C57BL/6 mice by depleting CD19+ B cells with magnetic beads (Dynal Biotech), followed by flow cytometry sorting. Total RNA was extracted from each sorted cell preparation using RNA STAT-60 isolation reagents (Tel-Test). First-strand cDNAs were prepared from 250–500 ng of total RNA of each sample using First Strand cDNA Kit (Fermentas). Template cDNAs were characterized in technical quadruplicates using two different RT2 Profiler PCR Arrays: the mouse Th1-Th2-Th3 array and the Th-17 pathway PCR Array for Autoimmunity and Inflammation (SuperArray Bioscience). QPCR SYBR Green Mix was purchased from (ABgene). Arrays were performed in 384-well plates on the 7900 ABI Sequence Analyzer (Applied Biosystems). Fold changes in gene expression between p55/p75 DKO NZM 2328 and C57BL/6 RNA were calculated using the ΔΔ cycle threshold method utilizing PCR Array Data Analysis Template software, per the manufacturer's instructions. Array data were deposited in National Center for Biotechnology Information GEO database under accession number GSE13855.
Array-profiling results were confirmed and validated through individual real-time PCR analyses of six selected genes: IL-4, IFN-γ, IL-10, IL-17A, IL-17F, and RORγt. The real-time PCR primers were designed by using Massachusetts Institute of Technology Whitehead Institute's Primer 3.0 software based on information from public mouse genome databases (http://genome.ucsc.edu; http://www.ebi.ac.uk/ensembl/). For the sequences of the oligonucleotide primers used, see supplementary Table I.4 All validation real-time PCR were run as quadruplicates for each gene of interest compared with the three housekeeping genes, GAPDH, heat shock protein 90ab1, and 18S RNA transcripts, used as endogenous references. Fold changes in gene expression were calculated according to Pfaffl (35) using the following equation: ratio = 2−(ΔCP sample – ΔCP control).
Intracellular IL-17 expression
Naive and activated memory CD4+ spleen cells were isolated from 5.5-mo-old female p55/p75 DKO NZM 2328 mice, 7- to 9-mo-old female NZM 2328 WT mice, or 7- to 9-mo-old C57BL/6 mice by depleting B cells with magnetic beads (Dynal Biotech), followed by flow cytometry sorting gated on CD4+CD62LhighCD44low (for naive T cells) or CD4+CD44highCD62Llow (for activated memory T cells) using a FACS-DiVa (BD Biosciences). These cells were stimulated with PMA (50 ng/ml) and ionomycin (100 ng/ml) for 5 h and BFA (5 μg/ml) for 4 h. In some experiments, these cells were stimulated with anti-CD3/CD28-coated beads (1:5 ratio) for 5 days, and PMA, ionomycin, and BFA were added to cultures for the final 5 h, as above. Cells were stained for surface CD4, CD62L, and CD44; fixed; permeabilized; and then stained for IL-17A (eBioscience).
Soluble IL-17 production
Cells were isolated and stimulated as above, but without BFA. Supernatants were harvested, and the soluble IL-17A levels were determined by ELISA (eBioscience), according to the manufacturer's instructions.
Statistics
All analyses were performed using SigmaPlot 11.0 software (SPSS). When necessary, raw results were log transformed to achieve normality and/or to satisfy the equal variance test. Parametric testing between two groups was performed by Student's t test, and parametric testing among three groups was performed by one-way ANOVA. When log transformation failed to generate normally distributed data or the equal variance test was not satisfied, nonparametric testing was performed by the Mann-Whitney rank sum test between two groups and by Kruskal-Wallis one-way ANOVA on ranks among three groups. Onset of severe proteinuria and mortality data were analyzed by Kaplan-Meier log-rank survival analysis.
Results
Development of disease in TNFR-deficient NZM 2328 mice
By 6 mo of age, ∼20% of WT NZM 2328 mice developed severe proteinuria (≥3+), with 90% of mice having been so affected by 10.5 mo of age (Fig. 1A). Death routinely ensued within 1 mo following the onset of severe proteinuria (Fig. 1B). Although disease development in NZM mice singly deficient in either TNFR was identical with that in WT, mice doubly deficient in both TNFR displayed accelerated kidney disease, as measured by both proteinuria and mortality. By 6 mo of age, 50% of the TNFR doubly-deficient mice developed severe proteinuria, and 90% of them were affected by 8 mo of age, with death ensuing shortly thereafter. The p value for both proteinuria and mortality is <0.001 by the log-rank test (Kaplan-Meier method). The fact that development of severe proteinuria closely correlated with mortality in each mouse cohort supports the notion that these mice died as a consequence of kidney disease.
FIGURE 1.

Accelerated proteinuria (A) and mortality (B) in TNFR p55/p75DKO mice. A total of 31–37 female mice for each of the indicated experimental group was monitored up to 12 mo of age. Data are presented as the percentage of cumulative prevalence of severe (≥3+) proteinuria and as percentage of cumulative death at the ages shown. Development of severe proteinuria and mortality are significantly accelerated (p < 0.001 for each) in DKO mice compared with those in the other mouse lines.
Among the different autoantibodies found in lupus, IgG anti-dsDNA autoantibodies are those most closely correlated with clinical outcome in mice and humans with SLE (36). In accordance with their developing accelerated kidney disease, serum IgG anti-dsDNA autoantibody levels in TNFR doubly-deficient mice at 5–5.5 mo of age were already elevated to an extent that was not achieved in WT or TNFR singly-deficient mice until 7.5–9 mo of age (Fig. 2).
FIGURE 2.

IgG anti-dsDNA autoantibodies in the different lines of mice at 5–5.5 and 7.5–9 mo of age. n = 7–13 mice in the various groups. Each symbol represents an individual mouse. The composite results are plotted as box plots. The lines inside the boxes indicate the medians; the outer borders of the boxes indicate 25th and 75th percentiles; the bars extending from the boxes indicate the 10th and 90th percentiles. *, p < 0.001 vs other groups at 5–5.5 mo of age.
Histologic and immunofluorescence evaluations of the kidneys confirmed the clinical observations. By 5.5 mo, most p55/p75 DKO mice showed diffuse proliferative glomerulonephritis (World Health Organization class IV) (Fig. 3). In contrast, this degree of pathology was not observed in WT, p55−/−, or p75−/− NZM 2328 mice until ∼7.5–9 mo of age. TNFR p55/p75 DKO showed at 5.5 mo a significantly greater composite KBS (p < 0.001) than did the other tested cohorts (Fig. 4), whereas there was no significant difference in KBS between the WT and either of the single-knockout mice at this age. At 7.5 mo of age, the KBS had substantially increased in the latter sets of mice to a degree similar to that observed in 5.5-mo-old DKO mice.
FIGURE 3.
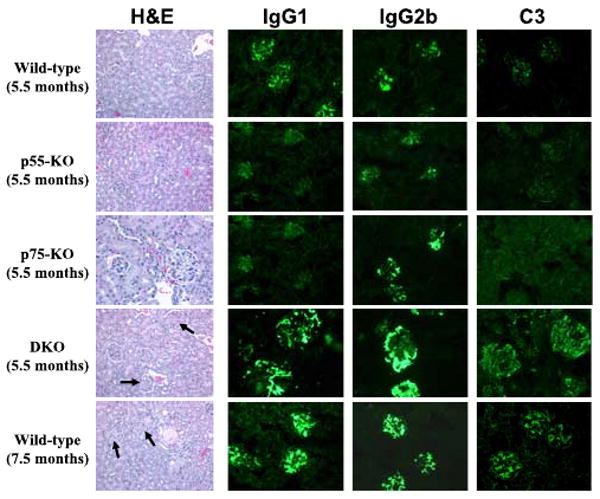
Representative H&E staining (original magnification ×200) and IgG1, IgG2b, and C3 immunofluorescence staining (original magnification ×40) of kidney sections from female NZM 2328 mice with the indicated genotypes and ages. Increased mesangial deposition with some cellularity in the glomeruli of 5.5-mo-old p55/p75 DKO mice and in 7.5-mo-old WT mice is marked with arrows.
FIGURE 4.

Assessment of renal pathology in the different lines of mice. Data are presented as composite KBS in the NZM 2328 mice with the indicated genotypes at 5.5 mo of age and at 7.5 mo of age. Each symbol represents an individual mouse. Results are plotted as in Fig. 2. *, p < 0.001 vs all other groups at 5.5 mo of age.
Similarly, glomerular deposition of IgG1, IgG2b, and C3 was substantially greater in DKO mice at 5.5 mo of age than in any of the other tested cohorts (Fig. 3). As the case with renal histology, this augmented degree of glomerular deposition was not appreciated in WT, p55−/−, or p75−/− mice until 7.5 mo of age. Taking the clinical, serological, histological, and immunofluorescence findings together, DKO mice develop an accelerated, but otherwise similar kidney disease to WT and single-knockout mice.
Spleen microarchitecture in TNFR-deficient NZM 2328 mice
Accelerated disease in doubly-deficient mice most likely reflected hyperactivity of their immune systems relative to those in WT or singly-deficient mice. Indeed, the ordered organization of the spleen white pulp is vital to proper regulation of immune responses. Given that TNF provides signals that support the generation and maintenance of lymphoid architecture (37), we characterized the microarchitecture of spleen white pulp in our mice at 2 and 6 mo of age. At each time point, all three TNFR-deficient strains displayed impaired follicular development compared with WT mice, with DKO mice showing the greatest degree of impairment (Fig. 5).
FIGURE 5.
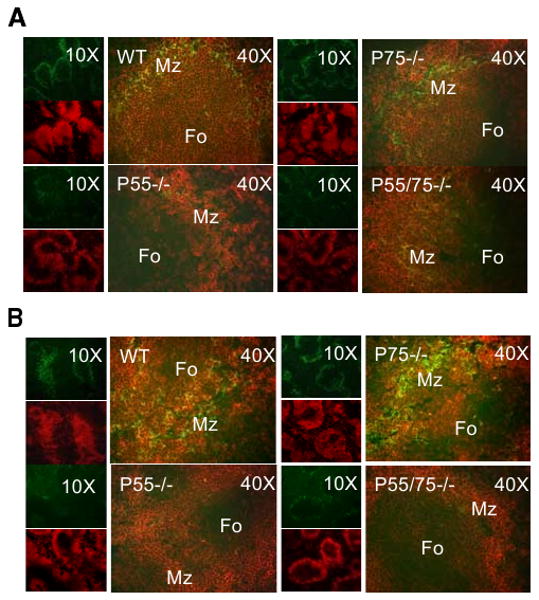
Comparison of spleen follicle structure in NZM 2328 WT and the indicated TNFR-deficient mice. Spleen sections from 2-mo-old (A) and from 6-mo-old (B) female mice from the indicated genotypes were stained with anti-B220 (red) and anti-MOMA-1 (green) mAb. Original magnifications of ×10 and ×40 are shown.
Furthermore, and consistent with a hyperactive immune system in SLE-prone mice, spontaneous germinal center (GC) formation was apparent by 2 mo of age in WT and p75−/− mice (Fig. 6). The p55−/− and DKO mice displayed reduced GC formation compared with WT at 2 mo of age, but DKO mice displayed larger and more numerous GCs at 6 mo of age than did the WT or p75−/− mice. Nonautoimmune C57BL/6 mice did not show spontaneous GC formation (data not shown).
FIGURE 6.
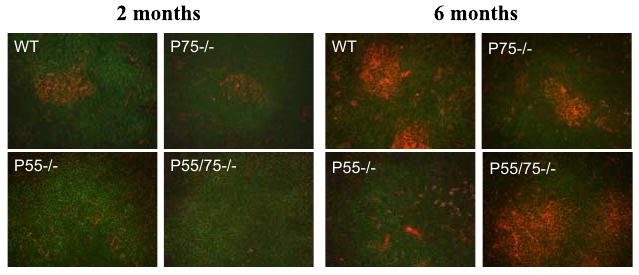
Altered GC formation in TNFR-deficient mice. Spleen sections from the indicated strains at 2 and 6 mo of age were stained with peanut agglutinin (red) to detect GC and with anti-B220 (green) for B cells. Original magnification ×40.
Discrete lymphocyte compartments in TNFR-deficient NZM 2328 mice
Total spleen lymphocytes were increased in DKO mice, largely due to an increase in total T (CD3+) and CD4+ T cells (Fig. 7, a, c, and e). No statistically significant differences in total B cells (Fig. 7b) or in follicular B cells, B1a cells, or marginal zone B cells (data not shown) were appreciated among the various deficient mice compared with WT controls. Notably, a substantial fraction of CD4+ cells in DKO mice displayed the phenotype of activated memory cells (CD4+CD44highCD62Llow/neg) (Figs. 7f and 8C) and/or recently-activated T cells (CD4+CD69+) (Figs. 7g and 8B).
FIGURE 7.

Effects of various TNFR deficiencies on spleen B and T cell subsets in 5- to 5.5-mo-old mice. Numbers shown are millions of cells per spleen. The composite results are plotted as box plots. The lines inside the boxes indicate the medians; the outer borders of the boxes indicate 25th and 75th percentiles; the bars extending from the boxes indicate the 10th and 90th percentiles. There are four mice in each of the indicated test groups analyzed in the same experiments. Results are representative of three independent experiments. a, Total number of splenocytes; b, CD19-positive B lymphocytes; c, CD3-positive total T lymphocytes; d, CD8-positive T cells; e, CD4-positive T cells; f, CD4+ CD44highCD62Llow/neg activated memory T cells; g, CD4+CD69+ recently activated T cells. Value of p < 0.05 among 5.5-mo-old mice for a–c; p < 0.01 for e–g; no statistical difference for d. Between DKO mice at 5.5 mo of age and WT at 9 mo of age, no significant difference was observed for a–c and e–g.
FIGURE 8.
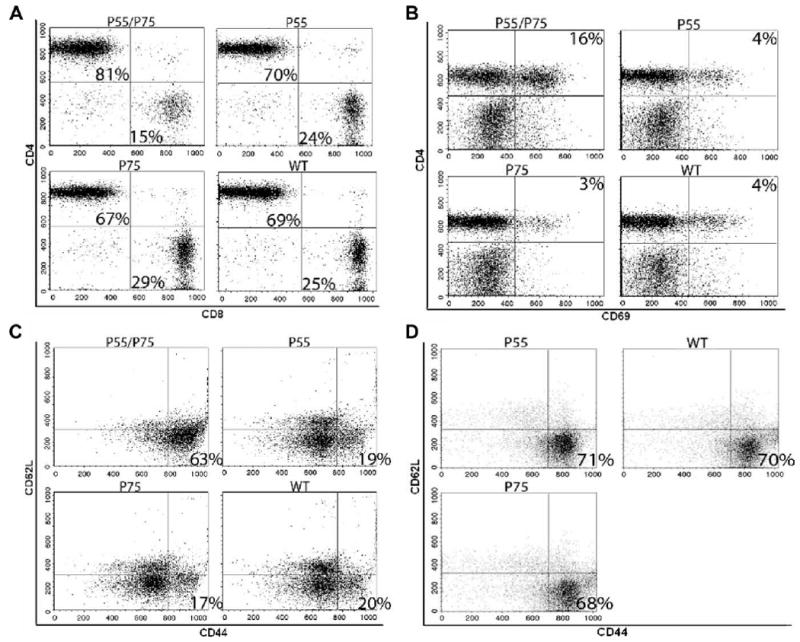
Flow cytometry analyses of T cell subsets in the various lines of mice. Representative FACS dot plots are shown at 5 mo of age in A–C, and at 8–9 mo of age in D. All data are representative for at least four independent experiments with similar results. A, Proportional increase of CD4+ and decrease of CD8+ T cells in p55/p75 DKO mice. The numbers shown in quadrants of each plot indicate percentage of total T cells (CD3+). B, Increased activated (CD69+) CD4+ T cells in p55/p75 DKO mice. The numbers shown in the upper right quadrant of each plot indicate percentage of total lymphocytes. C, Increased CD4+ activated memory T cells (CD44highCD62Llow/neg) subset in p55/p75 DKO lupus mice. The numbers in the lower right quadrant of each plot indicate the percentage of CD4+CD25− cells. D, As C, but at 8–9 mo of age. Importantly, p55/p75 DKO are absent because they are dead by this age. The numbers in the lower right quadrant of each plot indicate the percentage of CD4+CD25− cells.
Because there was a gradual shift toward the activated memory phenotype as the disease progressed (Fig. 8D), we focused on the gene expression profile of these cells. Activated memory CD4+ T cells from DKO NZM mice were purified by flow cytometry in parallel with purification of the same subset of T cells from nonautoimmune age- and sex-matched C57BL/6 mice. Surprisingly, they displayed neither a Th1 nor Th2 profile, as determined by gene-array analysis. Rather, IL-17a expression levels in DKO mice were significantly increased. Accordingly, we focused on evaluation of the Th17 pathway. As shown in Fig. 9A, the CD4+CD44highCD62Llow/neg subset from DKO mice showed a Th17 profile, based on significant increases in the levels of expression of IL-17A, IL-17F, IL-23A, IL-23R, Socs3, Jak1, Jak2, Mmp13, and ICOS, along with a decrease in IL-4, IL-25, and GATA3. To validate these results, we reproduced the array data for several key genes by real-time quantitative PCR (Fig. 9B). In cells from 5-mo-old DKO mice and 8- to 9-mo-old WT NZM 2328, but not in 5-mo-old WT NZM, expression of IL-17A and IL-17F was significantly increased; IFN-γ was marginally increased; IL-4 was marginally decreased; and IL-10 showed less than a 2-fold increase, which we deem to be biologically insignificant (Fig. 9B). These results provide further evidence for disease acceleration in the DKO mice, as well as confirmation of a Th17 gene expression profile in the CD4+CD44highCD62Llow/neg subset of cells from clinically sick animals (5-mo-old DKO and 8- to 9-mo-old WT, but not 5-mo-old WT).
FIGURE 9.

A, Selective gene mRNA expression of CD4+CD44highCD62Llow/neg cells from 5-mo-old female p55/p75 DKO NZM.2328 mice purified by flow cytometry ( ) in comparison with the same subset of T cells purified from age- and sex-matched C57BL/6 mice (black baseline). Data are presented as fold change values of quadruplicates tested in parallel, as described in Materials and Methods. B, Validation of the gene array data in A by real-time quantitative PCR of selected genes. Results are presented as fold change values of CD4+CD44highCD62Llow/neg cells from 5-mo-old p55/p75 DKO NZM 2328 mice (), from WT NZM 2328 mice at 8–9 mo of age (□), and from WT NZM 2328 at 5 mo of age (■) compared in each case to the same subset of T cells purified in parallel from age- and sex-matched C57BL/6 mice (black baseline).
These results also illustrate two additional points. First, we designed and used two different primer sets for IL-17F. With primer set 1, a 3- to 4-fold increase was observed, whereas with the second primer set, an 8- to 9-fold increase was obtained. The quantitative differences obtained using the two different sets of primers may reflect differences of binding affinities or other physicochemical differences between the primer sets and their targets. Second, in the SuperArray system, the probe for the RORc gene does not discriminate between the two isoforms RORγ and RORγt (X. Zeng, SuperArray, unpublished observation). Consequently, we used probes in the replication phase that specifically amplify the γt splicing variant of RORc without amplifying the other variant of the RORc gene. Interestingly, when using a non-γt-specific probe (in the array), no significant change in the expression of RORc was observed (Fig. 9A), but when the γt-specific probes were used, we demonstrated a significant increase in the expression of RORγt in the DKO mice, consistent with a Th17 profile of this subset of T cells (Fig. 9B).
Furthermore, as shown in Fig. 10, activated memory T cells from 5- to 5.5-mo-old DKO mice show significant IL-17 intracellular staining and IL-17 production in culture at days 0 and 5 at levels comparable to 7- to 9-mo-old NZM WT mice. Naive T cells from DKO mice produce miniscule amounts of IL-17, as evident by intracellular staining (Fig. 10B). Importantly, activated memory T cells from nonautoimmune age- and sex-matched C57BL/6 mice also produce very little IL-17, even after 5 days of culture (Fig. 10C).
FIGURE 10.
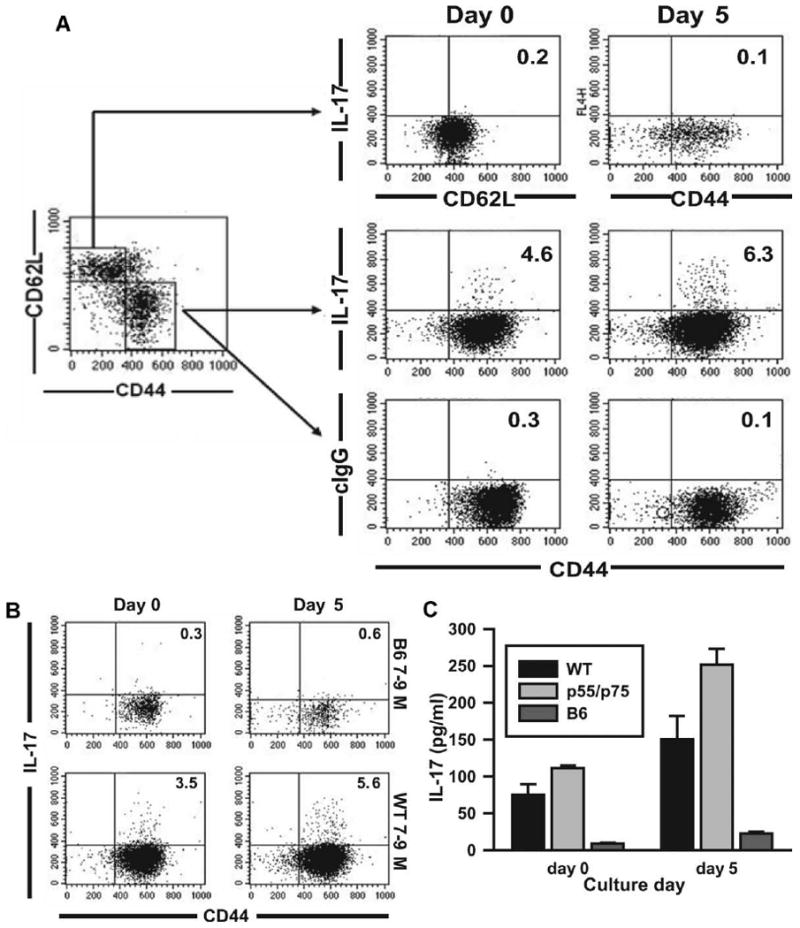
IL-17A levels in NZM2328 WT, p55/p75 DKO, and C57BL/6 mice. Naive and activated memory CD4+ spleen cells were isolated from 5- to 5.5-mo-old female p55/p75 DKO NZM 2328 mice, 7- to 9-mo-old female NZM 2328 WT mice, or 7- to 9-mo-old C57BL/6 mice by depleting B cells with magnetic beads, followed by flow cytometry sorting gated on CD4+CD62LhighCD44low (for naive T cells) or CD4+CD44highCD62Llow (for activated memory T cells). A, Naive and activated memory cells isolated from 5- to 5.5-mo-old p55/p75 DKO mice were treated as described in Materials and Methods, and stained for intracellular IL-17A and control IgG at days 0 and 5. B, Activated memory cells isolated from 7- to 9-mo-old female C57BL/6 and NZM 2328 WT mice were isolated, treated, and stained, as in A. C, IL-17A levels measured by ELISA in supernatants from cultures of activated memory T cells isolated and treated as above. Value of p < 0.001 between C57BL/6 mice and NZM2328 WT and DKO mice. No significant difference between DKO and 7- to 9-mo NZM WT.
Discussion
A low level of TNF expression is associated with a significant proportion of human SLE and with the classic (NZB × NZW)F1 murine model (17, 38). Although a protective role for TNF administration in (NZB × NZW)F1 mice has been established, it had not been known whether this effect segregates at the level of the individual TNFR. We have now demonstrated that the effect of TNF in closely related SLE-prone NZM 2328 mice does not segregate uniquely to either of the two TNFR. That is, disease development in TNFR1 or TNFR2 singly-deficient NZM 2328 mice was similar to that in WT mice (intact for both TNFR1 and TNFR2), whereas disease was unequivocally accelerated in DKO mice.
Unlike previous studies that focused on the biological consequences of TNFR deletion by evaluating only single receptor-deficient mice (30, 31, 39), our work emphasizes that to gain insight into the full spectrum of TNF/TNFR system, one must study model systems in which deletion of both receptors has occurred, as well as evaluate those systems in which the deletion of only a single individual receptor has occurred.
Our data point to a certain degree of functional redundancy for the two TNFR in NZM 2328 mice. In the complete absence of one, signaling through the other can sufficiently compensate and permit persistence of the WT clinical and pathological phenotypes. This may entail a convergence of the signaling pathways for T cell death as it occurs for cell survival. Indeed, TNFR1 induces TNFR-associated factor 2 (TRAF2)-receptor interacting protein-IKK-dependent, NF-κB-dependent antiapoptotic pathways, and also two distinct apoptotic pathways: TNFR1-TRADD-FADD-caspase-8 and TRAF2-AIP1-ASK1-JNK/p38 kinase cascade (40). Thus, recruitment of TRAF2 by TNFR1 for the formation of the signaling complex is essential for activation of several distinct signaling cascades. Although much less is known about the proteins recruited to TNFR2 and downstream signaling, TNFR2, like TNFR1, can also recruit TRAF2 and use the two cellular inhibitors of apoptotic proteins (cIAP1 and cIAP2) (41). Perhaps a similar convergence for the cell death signaling pathways occurs, if not through TRAF2, then by some other means. Consequently, when both receptors are deleted, a complete loss of regulatory functions of the TNF/TNFR pathway takes place. Investigation into the relevant biochemical pathways is needed to delineate the signaling cascades triggered by the individual TNFRs.
Anti-TNF agents have successfully been used to treat patients with a variety of chronic inflammatory diseases (42), and such agents have recently been suggested for use in SLE. This advice must be taken with caution given our results in the NZM 2328 model, which shows that abrogating the proinflammatory effects of TNF by deleting the two receptors leads to a heightened, distinct inflammatory pathway, probably resulting from the loss of immunoregulatory functions of TNF/TNFR system.
The recent anecdotal reports of the benefit following anti-TNF treatment in a few SLE patients (26) might be explained by an incomplete blockade of TNF. That is, there is still free TNF available to provide certain protective effects. A nonmutually exclusive possibility is that those patients treated to date are Caucasians possessing HLA class II genotype of DR3 and/or DR4, who have been shown to be capable of producing higher levels of TNF in response to activation (38). Consequently, reducing TNF levels in such patients might mitigate the inflammatory response while preserving sufficient TNF levels to provide protective regulation. In contrast, DR2/DQw1-positive SLE patients (mostly non-Caucasians), who have lower TNF inducibility (38), might be more prone to the harmful consequences of TNF blockade. Our findings, therefore, suggest much circumspection before using TNF antagonists in SLE. Furthermore, the accumulating data on the involvement of the TNF/TNFR pathway in the normal development of the lymphoid microarchitecture suggest that TNF antagonists might be contraindicated during pregnancy due to potential defects in embryonic development of the lymphoid system in the fetus.
In terms of a mechanistic explanation for our findings at the cellular level, NZM 2328 mice deficient in one or both TNFRs underwent important phenotypic changes. Follicular B cell organization and GC formation in the spleen were altered in these mice. These microstructural changes complement previous studies that documented similar changes in TNF- or TNFR1-deficient nonautoimmune-prone mice (43, 44) and are consistent with the established role of the TNF/TNFR system in the development of normal lymphoid architecture (45). Of note, the impaired ability of DKO mice to form organized follicles in the spleen (Fig. 6) did not compromise their ability to produce high levels of autoantibodies (Fig. 2). Moreover, attenuated spontaneous GC formation in the various TNFR-deficient mice (especially in p55−/− mice) did not affect their ability to generate autoantibody levels identical with those in WT mice (Fig. 2). Most importantly, these impairments in the organization of the B cell compartment in the DKO mice do not provide an explanation for their accelerated clinical disease, because single-receptor-deficient mice share the same B cell phenotype, but do not develop accelerated disease.
Among the individual B or T cell populations analyzed, the closest association with development of clinical disease was with CD4+CD44highCD62Llow/neg (activated memory) T cells, suggesting that these cells might have a causal role. Our results agree well with previous studies that also documented an accumulation of activated memory T cells in other SLE-prone mice (46, 47). Of note, such cells are refractory to anti-CD3-induced apoptosis in vitro and express high levels of apoptosis-inhibiting genes such as Bcl-xL (46), perhaps explaining why they steadily accumulate in SLE-prone mice.
To eludicate how CD4+CD44highCD62Llow/neg T cells might drive accelerated disease, we focused on their cytokine profile. There is considerable evidence that a skewing toward a Th2-type response can contribute to murine SLE (48). CD4+ T cells from (NZB × NZW)F1 mice secrete less IL-2 as the mice age and as the disease becomes more clinically evident (49). Furthermore, IL-4 mRNA expression increases with age and disease development in (NZB × NZW)F1 mice, whereas IL-12 mRNA expression decreases (50). Additionally, mitogen-stimulated T cells from these mice produce high levels of Th2-type cytokines (IL-4, IL-5, and IL-10), whereas Th1 cytokine (IL-2, IFN-γ) production is low (51). Moreover, the administration of anti-IL-10 to (NZB × NZW)F1 mice delays disease onset (19), and treatment with IL-4 antagonists decreases anti-DNA Ab levels and associated renal disease (52). Finally, transgenic expression of IL-4 under a MHC class I promoter induces SLE-like autoimmunity in a nonautoimmune background (53). In contrast, Th1 responses may contribute as well. For example, the major isotype eluted from glomerular lesions of SLE mice is IgG2a (36), which depends on IFN-γ for its synthesis. Indeed, neutralization of IFN-γ by a mAb (54) or a soluble IFN-γ receptor (55) prevents glomerulonephritis in (NZB × NZW)F1 mice, whereas administration of exogenous IFN-γ accelerates renal disease. In addition, renal disease and anti-DNA Ab levels are attenuated in IFN-γ receptor-deficient (NZB × NZW)F1 mice (56).
Unexpectedly, we found that CD4+CD44highCD62Llow/neg T cells in DKO NZM 2328 mice expressed neither a Th1 nor a Th2 profile. Rather, they expressed a Th17 profile, with significantly increased expression of IL-17A, IL-17F, IL-23A, IL-23R, Socs3, Jak1, Jak2, Mmp13, ICOS, and RORγt, along with decreased expression of IL-4, IL-25, and GATA3. Th17 cells have recently emerged as an independent subset that is highly pathogenic in the development of organ-specific autoimmunity (57, 58). The association of Th17 cells with systemic autoimmunity (SLE) suggests that the pathogenic role of these cells may be broader than initially appreciated.
Our finding of increased expression of Jak1 and Jak2 in CD4+CD44highCD62Llow/neg T cells is consistent with other reports on Th17 gene expression profiles (59, 60). Although Th1 and Th17 are distinct subsets, cells producing both IL-17 and IFN-γ have been identified (61–63), so the up-regulated expression of IFN-γ in the present study is not inconsistent with a Th17 response. In addition, our finding of increased expression of Mmp13 is also consistent with a Th17 profile. The induction of matrix metalloproteinases that are a component of chronic inflammatory responses has been suggested as a function of Th17 cells (64). Indeed, deletion of IL-17R in mice results in diminished synovial expression of Mmp 3, 9, and 13, and prevents cartilage destruction in streptococcal cell wall-induced arthritis (65).
We do not claim that activated memory T cells universally have a Th17 profile. Rather, our data suggest that within the CD4+CD44highCD62Llow/neg T cell population in DKO NZM 2328 mice (and 8- to 9-mo-old overtly sick WT NZM 2328 mice), there is a subset of Th17 cells. Indeed, CD4+CD44high CD62Llow/neg T cells from age- and sex-matched, nonautoimmune C57BL/6 mice do not manifest a Th17 profile. We cannot exclude the possibility that certain CD4+CD44highCD62Llow/neg T cells are non-Th17 cells even in DKO NZM 2328 mice because, at present, we have no way to delineate subsets within this activated memory phenotype other than by the cell surface markers used in flow cytometry. Accelerated disease in these mice may be promoted not only by such Th17 cells, but by other pathways as well. The existence of a Th17-mediated pathogenic pathway does not preclude the concurrent existence of other pathogenic pathways. Nevertheless, our results provide novel evidence for the association of IL-17/Th17 pathway with an animal model of SLE, the importance of which is underscored by the very recent demonstration of IL-17 production in human SLE (66).
Supplementary Material
Acknowledgments
We thank Michelle MacVeigh-Aloni for histology support. Histology was performed in the Cell and Tissue Imaging Core of the University of Southern California Research Center for Liver Diseases. We thank Dr. Xiao Zeng of SuperArray for information regarding the SuperArray probe designs.
Footnotes
This work was supported by National Institutes of Health Grants R01 AI057473 (to C.O.J.), R01 AR050193 (to W.S.), and P30 DK04522 (core).
Abbreviations used in this paper: EAE, experimental autoimmune encephalomyelitis; DKO, double knockout; GC, germinal center; KBS, kidney biopsy score; NZB, New Zealand Black; NZM, New Zealand Mixed; NZW, New Zealand White; SLE, systemic lupus erythematosus; TRAF2, TNFR-associated factor 2; WT, wild type; neg, negative.
The online version of this article contains supplementary material.
Disclosures: The authors have no financial conflict of interest.
References
- 1.Goeddel DV, Aggarwal BB, Gray PW, Leung DW, Nedwin GE, Palladino MA, Patton JS, Pennica D, Shepard HM, Sugarman BJ. Tumor necrosis factors: gene structure and biological activities. Cold Spring Harbor Symp Quant Biol. 1986;51:597–609. doi: 10.1101/sqb.1986.051.01.072. [DOI] [PubMed] [Google Scholar]
- 2.Beutler B, Cerami A. Tumor necrosis, cachexia, shock, and inflammation: a common mediator. Annu Rev Biochem. 1988;57:505–518. doi: 10.1146/annurev.bi.57.070188.002445. [DOI] [PubMed] [Google Scholar]
- 3.Sugarman BJ, Aggarwal BB, Hass PE, Figari IS, Palladino MA, Shepard HM. Recombinant human tumor necrosis factor-α: effects on proliferation of normal and transformed cells in vitro. Science. 1985;230:943–945. doi: 10.1126/science.3933111. [DOI] [PubMed] [Google Scholar]
- 4.Kollias G, Kontoyianni D. Role of TNF/TNFR in autoimmunity: specific TNF receptor blockade may be advantageous to anti-TNF treatments. Cytokine Growth Factor Rev. 2002;13:315–321. doi: 10.1016/s1359-6101(02)00019-9. [DOI] [PubMed] [Google Scholar]
- 5.Tartaglia LA, Weber RF, Figari IS, Reynolds C, Palladino MA, Goeddel DV. The two different receptors for tumor necrosis factor mediate distinct cellular responses. Proc Natl Acad Sci USA. 1991;88:9292–9296. doi: 10.1073/pnas.88.20.9292. [DOI] [PMC free article] [PubMed] [Google Scholar]
- 6.Baud V, Karin M. Signal transduction by tumor necrosis factor and its relatives. Trends Cell Biol. 2001;11:372–377. doi: 10.1016/s0962-8924(01)02064-5. [DOI] [PubMed] [Google Scholar]
- 7.Tartaglia LA, Goeddel DV, Reynolds C, Figari IS, Weber RF, Fendly BM, Palladino MA. Stimulation of human T-cell proliferation by specific activation of the 75-kDa tumor necrosis factor receptor. J Immunol. 1993;151:4637–4641. [PubMed] [Google Scholar]
- 8.Zheng L, Fisher G, Miller RE, Peschon J, Lynch DH, Lenardo MJ. Induction of apoptosis in mature T cells by tumor necrosis factor. Nature. 1995;377:348–351. doi: 10.1038/377348a0. [DOI] [PubMed] [Google Scholar]
- 9.Elliott MJ, Maini RN, Feldmann M, Kalden JR, Antoni C, Smolen JS, Leeb B, Breedveld FC, Macfarlane JD, Bijl H. Randomized double-blind comparison of chimeric monoclonal antibody to tumor necrosis factor α (cA2) versus placebo in rheumatoid arthritis. Lancet. 1994;344:1105–1110. doi: 10.1016/s0140-6736(94)90628-9. [DOI] [PubMed] [Google Scholar]
- 10.Van Dulleman HM, van Deventer SJ, Hommes DW, Bijl HA, Jansen J, Tytgat GN, Woody J. Treatment of Crohn's disease with anti-tumor necrosis factor chimeric monoclonal antibody (cA2) Gastroentrology. 1995;109:129–135. doi: 10.1016/0016-5085(95)90277-5. [DOI] [PubMed] [Google Scholar]
- 11.Karkar AM, Koshino Y, Cashman SJ, Dash AC, Bonnefoy J, Meager A, Rees AJ. Passive immunization against tumor necrosis factor-α (TNF-α) and IL-1β protects from LPS enhancing glomerular injury in nephrotoxic nephritis in rats. Clin Exp Immunol. 1992;90:312–318. doi: 10.1111/j.1365-2249.1992.tb07948.x. [DOI] [PMC free article] [PubMed] [Google Scholar]
- 12.Ruddle NH, Bergman CM, McGrath KM, Lingenheld EG, Grunnet ML, Padula SJ, Clark RB. An antibody to lymphotoxin and tumor necrosis factor prevents transfer of experimental allergic encephalomyelitis. J Exp Med. 1990;172:1193–2000. doi: 10.1084/jem.172.4.1193. [DOI] [PMC free article] [PubMed] [Google Scholar]
- 13.Dick AD, McMenamin PG, Körner H, Scallon BJ, Ghrayeb J, Forrester JV, Sedgwick JD. Inhibition of tumor necrosis factor activity minimizes target organ damage in experimental autoimmune uveoretinitis despite quantitatively normal activated T cell traffic to the retina. Eur J Immunol. 1996;26:1018–1025. doi: 10.1002/eji.1830260510. [DOI] [PubMed] [Google Scholar]
- 14.Jacob CO, Aiso S, Michie SA, McDevitt HO, Acha-Orbea H. Prevention of diabetes in nonobese diabetic mice by tumor necrosis factor (TNF): similarities between TNF-α and interleukin 1. Proc Natl Acad Sci USA. 1990;87:968–972. doi: 10.1073/pnas.87.3.968. [DOI] [PMC free article] [PubMed] [Google Scholar]
- 15.Yang XD, Tisch R, Singer SM, Cao ZA, Liblau RS, Schreiber RD, McDevitt HO. Effect of tumor necrosis factor α on insulin-dependent diabetes mellitus in NOD mice: the early development of autoimmunity and the diabetogenic process. J Exp Med. 1994;180:995–1004. doi: 10.1084/jem.180.3.995. [DOI] [PMC free article] [PubMed] [Google Scholar]
- 16.Grewal IS, Grewal KD, Wong FS, Picarella DE, Janeway CA, Flavell RA. Local expression of transgene encoded TNF α in islets prevents autoimmune diabetes in nonobese diabetic (NOD) mice by preventing the development of auto-reactive islet-specific T cells. J Exp Med. 1996;184:1963–1974. doi: 10.1084/jem.184.5.1963. [DOI] [PMC free article] [PubMed] [Google Scholar]
- 17.Jacob CO, McDevitt HO. Tumor necrosis factor-α in autoimmune ‘lupus’ nephritis. Nature. 1988;331:356–358. doi: 10.1038/331356a0. [DOI] [PubMed] [Google Scholar]
- 18.Gordon C, Ranges GE, Greenspan JS, Wofsy D. Chronic therapy with recombinant tumor necrosis factor-α in autoimmune NZB/NZW F1 mice. Clin Immunol Immunopathol. 1989;52:421–434. doi: 10.1016/0090-1229(89)90157-8. [DOI] [PubMed] [Google Scholar]
- 19.Ishida H, Muchamuel T, Sakaguchi S, Andrade S, Menon S, Howard M. Continuous administration of anti-interleukin 10 antibodies delays onset of autoimmunity in NZB/W F1 mice. J Exp Med. 1994;179:305–310. doi: 10.1084/jem.179.1.305. [DOI] [PMC free article] [PubMed] [Google Scholar]
- 20.Kontoyiannis D, Kollias G. Accelerated autoimmunity and lupus nephritis in NZB mice with an engineered heterozygous deficiency in tumor necrosis factor. Eur J Immunol. 2000;30:2038–2047. doi: 10.1002/1521-4141(200007)30:7<2038::AID-IMMU2038>3.0.CO;2-K. [DOI] [PubMed] [Google Scholar]
- 21.Feldmann M, Brennan FM, Maini RN. Role of cytokines in rheumatoid arthritis. Annu Rev Immunol. 1996;14:397–440. doi: 10.1146/annurev.immunol.14.1.397. [DOI] [PubMed] [Google Scholar]
- 22.Sicotte NL, Voskuhl RR. Onset of multiple sclerosis associated with anti-TNF therapy. Neurology. 2001;57:1885–1888. doi: 10.1212/wnl.57.10.1885. [DOI] [PubMed] [Google Scholar]
- 23.Sandborn WJ, Hanauer SB. Antitumor necrosis factor therapy for inflammatory bowel disease: a review of agents, pharmacology, clinical results, and safety. Inflamm Bowel Dis. 1999;5:119–133. doi: 10.1097/00054725-199905000-00008. [DOI] [PubMed] [Google Scholar]
- 24.Van Oosten BW, Barkhof F, Truyen L, Boringa JB, Bertelsmann FW, von Blomberg BM, Woody JN, Hartung HP, Polman CH. Increased MRI activity and immune activation in two multiple sclerosis patients treated with the monoclonal anti-tumor necrosis factor antibody cA2. Neurology. 1996;47:1531–1534. doi: 10.1212/wnl.47.6.1531. [DOI] [PubMed] [Google Scholar]
- 25.Lenercept Multiple Sclerosis Study Group and University of British Columbia MS/MRI Analysis Group. TNF neutralization in MS: results of a randomized, placebo-controlled multicenter study. Neurology. 1999;53:457–465. [PubMed] [Google Scholar]
- 26.Aringer M, Steiner G, Graninger WB, Höfler E, Steiner CW, Smolen JS. Effects of short-term infliximab therapy on autoantibodies in systemic lupus erythematosus. Arthritis Rheum. 2007;56:274–279. doi: 10.1002/art.22327. [DOI] [PubMed] [Google Scholar]
- 27.Aringer M, Smolen JS. The role of tumor necrosis factor-α in systemic lupus erythematosus. Arthritis Res Ther. 2008;10:202–209. doi: 10.1186/ar2341. [DOI] [PMC free article] [PubMed] [Google Scholar]
- 28.Suvannavejh GC, Lee HO, Padilla J, Dal Canto MC, Barrett TA, Miller SD. Divergent roles for p55 and p75 tumor necrosis factor receptors in the pathogenesis of MOG(35–55)-induced experimental autoimmune encephalomyelitis. Cell Immunol. 2000;205:24–33. doi: 10.1006/cimm.2000.1706. [DOI] [PubMed] [Google Scholar]
- 29.Kassiotis G, Kollias G. Uncoupling the proinflammatory from the immunosuppressive properties of tumor necrosis factor (TNF) at the p55 TNF receptor level: implications for pathogenesis and therapy of autoimmune demyelination. J Exp Med. 2001;193:427–434. doi: 10.1084/jem.193.4.427. [DOI] [PMC free article] [PubMed] [Google Scholar]
- 30.Vielhauer V, Stavrakis G, Mayadas TN. Renal cell-expressed TNF receptor 2, not receptor 1, is essential for the development of glomerulonephritis. J Clin Invest. 2005;115:1199–1209. doi: 10.1172/JCI23348. [DOI] [PMC free article] [PubMed] [Google Scholar]
- 31.Zhou T, Edwards CK, Yang P, Wang Z, Bluethmann H, Mountz JD. Greatly accelerated lymphadenopathy and autoimmune disease in lpr mice lacking tumor necrosis factor receptor I. J Immunol. 1996;156:2661–2665. [PubMed] [Google Scholar]
- 32.Waters ST, Fu SM, Gaskin F, Deshmukh US, Sung SS, Kannapell CC, Tung KS, McEwen SB, McDuffie M. NZM2328: a new mouse model of systemic lupus erythematosus with unique genetic susceptibility loci. Clin Immunol. 2001;100:372–383. doi: 10.1006/clim.2001.5079. [DOI] [PubMed] [Google Scholar]
- 33.Jacob CO, Zang S, Li L, Ciobanu V, Quismorio F, Mizutani A, Satoh M, Koss M. Pivotal role of Stat4 and Stat6 in the pathogenesis of the lupus-like disease in the New Zealand mixed 2328 mice. J Immunol. 2003;171:1564–1571. doi: 10.4049/jimmunol.171.3.1564. [DOI] [PubMed] [Google Scholar]
- 34.Jacob CO, Pricop L, Putterman C, Koss MN, Liu Y, Kollaros M, Bixler SA, Ambrose CM, Scott ML, Stohl W. Paucity of clinical disease despite serological autoimmunity and kidney pathology in lupus-prone New Zealand mixed 2328 mice deficient in BAFF. J Immunol. 2006;177:2671–2680. doi: 10.4049/jimmunol.177.4.2671. [DOI] [PMC free article] [PubMed] [Google Scholar]
- 35.Pfaffl MW. A new mathematical model for relative quantification in real-time RT-PCR. Nucleic Acids Res. 2001;29:e45. doi: 10.1093/nar/29.9.e45. [DOI] [PMC free article] [PubMed] [Google Scholar]
- 36.Ebling FM, Hahn BH. Restricted subpopulations of DNA antibodies in kidneys of mice with systemic lupus: comparison of antibodies in serum and renal eluates. Arthritis Rheum. 1980;23:392–403. doi: 10.1002/art.1780230402. [DOI] [PubMed] [Google Scholar]
- 37.Boussiotis VA, Nadler LM, Strominger JL, Goldfeld AE. Tumor necrosis factor α is an autocrine growth factor for normal human B cells. Proc Natl Acad Sci USA. 1994;91:7007–7011. doi: 10.1073/pnas.91.15.7007. [DOI] [PMC free article] [PubMed] [Google Scholar]
- 38.Jacob CO, Fronek Z, Lewis GD, Koo M, Hansen JA, McDevitt HO. Heritable major histocompatibility complex class II-associated differences in production of tumor necrosis factor α: relevance to genetic predisposition to systemic lupus erythematosus. Proc Natl Acad Sci USA. 1990;87:1233–1237. doi: 10.1073/pnas.87.3.1233. [DOI] [PMC free article] [PubMed] [Google Scholar]
- 39.Tada Y, Ho A, Koarada S, Morito F, Ushiyama O, Suzuki N, Kikuchi Y, Ohta A, Mak TW, Nagasawa K. Collagen-induced arthritis in TNF receptor-1-deficient mice: TNF receptor-2 can modulate arthritis in the absence of TNF receptor-1. Clin Immunol. 2001;99:325–333. doi: 10.1006/clim.2001.5027. [DOI] [PubMed] [Google Scholar]
- 40.Luo D, Luo Y, He Y, Zhang H, Zhang R, Li X, Dobrucki WL, Sinusas AJ, Sessa WC, Min W. Differential functions of tumor necrosis factor receptor 1 and 2 signaling in ischemia-mediated arteriogenesis and angiogenesis. Am J Pathol. 2006;169:1886–1898. doi: 10.2353/ajpath.2006.060603. [DOI] [PMC free article] [PubMed] [Google Scholar]
- 41.Rothe M, Wong SC, Henzel WJ, Goeddel DV. A novel family of putative signal transducers associated with the cytoplasmic domain of the 75 kDa tumor necrosis factor receptor. Cell. 1994;78:681–692. doi: 10.1016/0092-8674(94)90532-0. [DOI] [PubMed] [Google Scholar]
- 42.Lin J, Ziring D, Desai S, Kim S, Wong M, Korin Y, Braun J, Reed E, Gjertson D, Singh RR. TNFα blockade in human diseases: an overview of efficacy and safety. Clin Immunol. 2008;126:13–30. doi: 10.1016/j.clim.2007.08.012. [DOI] [PMC free article] [PubMed] [Google Scholar]
- 43.Pasparakis M, Alexopoulou L, Episkopou V, Kollias G. Immune and inflammatory responses in TNF α-deficient mice: a critical requirement for TNF α in the formation of primary B cell follicles, follicular dendritic cell networks and germinal centers, and in the maturation of the humoral immune response. J Exp Med. 1996;184:1397–1411. doi: 10.1084/jem.184.4.1397. [DOI] [PMC free article] [PubMed] [Google Scholar]
- 44.Matsumoto M, Fu YX, Molina H, Chaplin DD. Lymphotoxin-α-deficient and TNF receptor-I-deficient mice define developmental and functional characteristics of germinal centers. Immunol Rev. 1997;156:137–144. doi: 10.1111/j.1600-065x.1997.tb00965.x. [DOI] [PubMed] [Google Scholar]
- 45.Tkachuk M, Bolliger S, Ryffel B, Pluschke G, Banks TA, Herren S, Gisler RH, Kosco-Vilbois MH. Crucial role of tumor necrosis factor receptor 1 expression on nonhematopoietic cells for B cell localization within the splenic white pulp. J Exp Med. 1998;187:469–477. doi: 10.1084/jem.187.4.469. [DOI] [PMC free article] [PubMed] [Google Scholar]
- 46.Sabzevari H, Propp S, Kono DH, Theofilopoulos AN. G1 arrest and high expression of cyclin kinase and apoptosis inhibitors in accumulated activated/memory phenotype CD4+ cells of older lupus mice. Eur J Immunol. 1997;27:1901–1910. doi: 10.1002/eji.1830270813. [DOI] [PubMed] [Google Scholar]
- 47.Lawson BR, Baccala R, Song J, Croft M, Kono DH, Theofilopoulos AN. Deficiency of the cyclin kinase inhibitor p21(WAF-1/CIP-1) promotes apoptosis of activated/memory T cells and inhibits spontaneous systemic autoimmunity. J Exp Med. 2004;199:547–557. doi: 10.1084/jem.20031685. [DOI] [PMC free article] [PubMed] [Google Scholar]
- 48.Sato MN, Minoprio P, Avrameas S, Ternynck T. Defects in the regulation of anti-DNA antibody production in aged lupus-prone (NZB × NZW)F1 mice: analysis of T-cell lymphokine synthesis. Immunology. 1995;85:26–32. [PMC free article] [PubMed] [Google Scholar]
- 49.Dauphinée MJ, Kipper SB, Wofsy D, Talal N. Interleukin 2 deficiency is a common feature of autoimmune mice. J Immunol. 1981;127:2483–2487. [PubMed] [Google Scholar]
- 50.Yoshii H, Yamamoto K, Okudaira H, Dohi M, Suko M, Fukata Y, Yago H, Suehiro S, Ito K. Age-related differential mRNA expression of T cell cytokines in NZB/NZW F1 mice. Lupus. 1995;4:213–216. doi: 10.1177/096120339500400309. [DOI] [PubMed] [Google Scholar]
- 51.Lin LC, Chen YC, Chou CC, Hsieh KH, Chang BL. Dysregulation of T helper cell cytokines in autoimmune prone (NZB × NZW)F1 mice. Scand J Immunol. 1995;42:466–472. doi: 10.1111/j.1365-3083.1995.tb03681.x. [DOI] [PubMed] [Google Scholar]
- 52.Schorlemmer HU, Dickneite G, Kanzy EJ, Enssle KH. Modulation of the immunoglobulin dysregulation in GVH and SLE-like diseases by IL-4 receptor. Inflamm Res. 1995;44:S194–196. doi: 10.1007/BF01778328. [DOI] [PubMed] [Google Scholar]
- 53.Erb KJ, Rüger B, von Brevern M, Ryffel B, Schimpl A, Rivett K. Constitutive expression of interleukin (IL)-4 in vivo causes autoimmune-type disorders in mice. J Exp Med. 1997;185:329–339. doi: 10.1084/jem.185.2.329. [DOI] [PMC free article] [PubMed] [Google Scholar]
- 54.Jacob CO, van der Meide PH, McDevitt HO. In vivo treatment of (NZB × NZW)F1 lupus-like nephritis with monoclonal antibody to γ interferon. J Exp Med. 1987;166:798–802. doi: 10.1084/jem.166.3.798. [DOI] [PMC free article] [PubMed] [Google Scholar]
- 55.Ozmen L, Roman D, Fountoulakis M, Schmid G, Ryffel B, Garotta G. Experimental therapy of systemic lupus erythematosus: the treatment of NZB/W mice with mouse soluble interferon-γ receptor inhibits the onset of glomerulonephritis. Eur J Immunol. 1995;25:6–12. doi: 10.1002/eji.1830250103. [DOI] [PubMed] [Google Scholar]
- 56.Haas C, Ryffel B, Le Hir M. IFN-γ receptor deletion prevents autoantibody production and glomerulonephritis in lupus-prone (NZB × NZW)F1 mice. J Immunol. 1998;160:3713–3718. [PubMed] [Google Scholar]
- 57.Bettelli E, Korn T, Kuchroo VK. Th17: the third member of the effector T cell trilogy. Curr Opin Immunol. 2007;19:652–657. doi: 10.1016/j.coi.2007.07.020. [DOI] [PMC free article] [PubMed] [Google Scholar]
- 58.Langrish CL, Chen Y, Blumenschein WM, Mattson J, Basham B, Sedgwick JD, McClanahan T, Kastelein RA, Cua DJ. IL-23 drives a pathogenic T cell population that induces autoimmune inflammation. J Exp Med. 2005;201:233–240. doi: 10.1084/jem.20041257. [DOI] [PMC free article] [PubMed] [Google Scholar]
- 59.Huang F, Kao CY, Wachi S, Thai P, Ryu J, Wu R. Requirement for both JAK-mediated PI3K signaling and ACT1/TRAF6/TAK1-dependent NF-κB activation by IL-17A in enhancing cytokine expression in human airway epithelial cells. J Immunol. 2007;179:6504–6513. doi: 10.4049/jimmunol.179.10.6504. [DOI] [PubMed] [Google Scholar]
- 60.Nakae S, Iwakura Y, Suto H, Galli SJ. Phenotypic differences between Th1 and Th17 cells and negative regulation of Th1 cell differentiation by IL-17. J Leukocyte Biol. 2007;81:1258–1268. doi: 10.1189/jlb.1006610. [DOI] [PubMed] [Google Scholar]
- 61.Chen Z, Laurence A, O'Shea JJ. Signal transduction pathways and transcriptional regulation in the control of Th17 differentiation. Semin Immunol. 2007;19:400–408. doi: 10.1016/j.smim.2007.10.015. [DOI] [PMC free article] [PubMed] [Google Scholar]
- 62.Stockinger B, Veldhoen M, Martin B. Th17 T cells: linking innate and adaptive immunity. Semin Immunol. 2007;19:353–361. doi: 10.1016/j.smim.2007.10.008. [DOI] [PubMed] [Google Scholar]
- 63.Ivanov II, McKenzie BS, Zhou L, Tadokoro CE, Lepelley A, Lafaille JJ, Cua DJ, Littman DR. The orphan nuclear receptor RORγt directs the differentiation program of proinflammatory IL-17+ T helper cells. Cell. 2006;126:1121–1133. doi: 10.1016/j.cell.2006.07.035. [DOI] [PubMed] [Google Scholar]
- 64.Sylvester J, Liacini A, Li WQ, Zafarullah M. Interleukin-17 signal transduction pathways implicated in inducing matrix metalloproteinase-3, -13 and aggrecanase-1 genes in articular chondrocytes. Cell Signal. 2004;16:469–476. doi: 10.1016/j.cellsig.2003.09.008. [DOI] [PubMed] [Google Scholar]
- 65.Koenders MI, Kolls JK, Oppers-Walgreen B, van den Bersselaar L, Joosten LA, Schurr JR, Schwarzenberger P, van den Berg WB, Lubberts E. Interleukin-17 receptor deficiency results in impaired synovial expression of interleukin-1 and matrix metalloproteinases 3, 9, and 13 and prevents cartilage destruction during chronic reactivated streptococcal cell wall-induced arthritis. Arthritis Rheum. 2005;52:3239–3247. doi: 10.1002/art.21342. [DOI] [PubMed] [Google Scholar]
- 66.Wong CK, Lit LC, Tam LS, Li EK, Wong PT, Lam CW. Hyperproduction of IL-23 and IL-17 in patients with systemic lupus erythematosus: implications for Th17-mediated inflammation in autoimmunity. Clin Immunol. 2008;127:385–393. doi: 10.1016/j.clim.2008.01.019. [DOI] [PubMed] [Google Scholar]
Associated Data
This section collects any data citations, data availability statements, or supplementary materials included in this article.