Abstract
We study mechanical and thermodynamic properties of RNA nanostructures focusing on a hexagonal nanoring discussed in Yingling and Shapiro (2007 Nano Lett. 7 2328). We are concerned with the following main issues: (i) the stability of the nanoring versus temperature; (ii) the effect of the environment (solvent, counterions) on its stability; (iii) conformations and dynamics under external force. The process of evaporation of the ions from the ring upon temperature drop has been found, demonstrating a surprising feature—the uptake of ions by the nanoring increases with the temperature. The connection of this behavior to the dielectric constant of water, hydration and structural changes in the nanoring is discussed. Several properties of the nanoring, such as elastic and transport coefficients, have been determined. A measure of the tensile elasticity of the ring against its uniform 2D in-plane compression has been given, as Keff ≤ 0.01 GPa, which is a much lower value compared to typical values found for soft matter other than RNA.
1. Introduction
In recent years, significant progress in understanding RNA structure led to the emergence of ‘RNA architectonics’—a set of recipes for (self-)assembly of RNA nanostructures of arbitrary size and shape [1, 2]. Smallest RNA building blocks—‘tectoRNAs’—typically bearing well-defined structural features (e.g. angles) such as the ‘right angle motif’ [1], ‘kink-turn motif’ [2, 3] or ‘RNAIi/RNAIIi complex’ [4] were manipulated (either experimentally [1, 2] or via computer simulation [4]) into the desired 2D or 3D nanostructures (squares, hexagons, cubes, tetrahedrons, etc) that can be further assembled into periodic or quasi-periodic lattices.
Compared to DNA nanostructures which have been extensively studied before, RNA as a nano-engineering material brings several additional challenging features. Firstly, due to the specificity of the interactions in RNA (such as a noticeable presence of non-Watson–Crick base pairing), it shows much larger structural modularity and diversity of tertiary structural building blocks, ~200 versus ~20 for DNA [2]. Secondly, RNA nanostructures are often much more conformationally flexible than the DNA ones, which make them very promising in functional applications. Indeed, an interesting conformational dynamics (strongly mediated by the presence of water and counterions) of some simple structural RNA units has already been reported ([5], p 320).
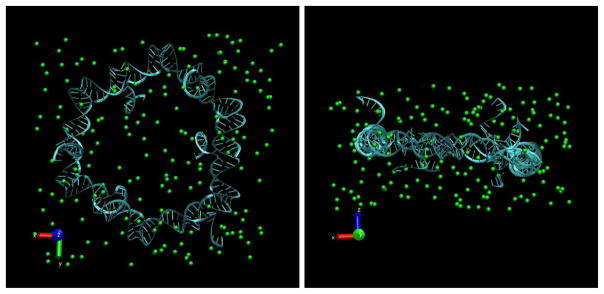
In this study we analyze, via all-atom classical molecular dynamics simulation, the thermal dynamics as well as the response to an applied external force on a simple RNA nanostructure (13 nm in characteristic size), a hexagon-shaped RNA ring termed the ‘nanoring’. It is composed of six ‘RNAIi/RNAIIi complexes’, joined by six ‘kissing loop’ motifs (see figure 1, more details of this nanostructure can be found in [4]). While certain data about thermal stability of this and closely related RNA nanostructures are already available, both from experiments and simulations, a deeper and more detailed understanding of their stability and dynamics is needed. In particular, one of the main emphases of this work is on the effect of counterions [6], that may strongly affect the behavior of e.g. the kissing loop structural motifs [7]. Another emphasis of the present study is on understanding the response of the above-mentioned nanostructure to an applied external force, an important factor in the context of a range of promising applications, including RNA nanostructures in man-made molecular machines.
Figure 1.
Top and side views of the simulation box with a sample initial configuration for our MD simulations: RNA nanoring together with 165 Mg2+ ions (green spheres) and 88 664 H2O molecules (not shown).
2. Model
We use the NAMD package [8] for all-atom molecular dynamics simulations of the RNA nanoring with the CHARMM27 [9] force field. Visualization and processing of the simulation data are carried out with VMD [10] and UCSF Chimera [11].
We solvate the RNA nanoring structure with 88 664 TIP3P water molecules (embedding the RNA ring into a water box of sufficient dimensions, ≈180 Å ×180 Å ×90 Å to cover the ring completely with water), and then we add randomly 330 Na+ or 165 Mg2+ ions to the box in order to match the 330 negatively charged q = −1 phosphate groups of the nanoring, thus making sure that the system is electrically neutral (‘no salt’ system, see figure 1). We also add extra Na+, Mg2+, as well as Cl− ions to the simulation box in order to represent the following solutions: (i) 250 Na+ and 250 Cl− to represent a 0.16 M NaCl ‘physiological solution’, (ii) 664 Na+ and 664 Cl− to represent a 0.42 M ‘sea water solution’, (iii) 250 Mg2+ and 500 Cl− to represent a 0.16 M MgCl2 ‘physiological solution’.
Then we simulate the resulting system at constant temperature and pressure (1 atm) via the means provided by the NAMD package. To control the temperature, the Langevin method with damping η = 5 ps−1 is used. To maintain the constant pressure, the Nose-Hoover Langevin piston method (period of 100.0 fs and decay of 50.0 fs) is used, and periodic boundary conditions (PBC) are applied in all three dimensions. The time step is set to 2 fs and the cutoff for nonbonded interactions is 12 Å. Particle mesh Ewald summation (PME) was used to calculate the electrostatic interactions. Rigid TIP3P water molecules are handled via the SETTLE algorithm.
3. Structure and dynamics of the RNA nanoring in the absence of external forces
Starting from the initial structure shown in figure 1 we have performed a series of 2 ns runs at different concentrations of ions and different temperatures ranging from 310 K to 510 K. For selected runs, we continued the simulation up to 6 ns, as described below in the text. During these runs, we monitored the behavior of the number of ions in the vicinity of RNA, the energy of interaction between the ions and the RNA, as well as the radius of gyration Rg and the root mean square deviation (RMSD) of the nanoring (for two latter analyses, we excluded the dangling unpaired tails of the nanoring visible in figure 1).
There are two reasons that led us to study the ring at the highly elevated temperature of 510 K in comparison to the human body temperature 310 K. Firstly, the prospective use of the RNA nanoring as a construction block for more complex nanostructures [4] may require knowledge of its properties in a wide temperature range. Secondly, since the equilibration of the ring at 310 K proceeds very slowly, a straightforward approach requires huge computational efforts (~40 h ns−1 in a typical parallel 32-processor run using a Sharcnet cluster). We have therefore attempted to obtain an insight into the behavior of the ring at this temperature by doing ‘quenched’ runs. Namely, the configurations of the ring obtained after 2 and 6 ns equilibration runs at 510 K for Mg and Na, respectively, have been used as the starting points for the subsequent equilibration runs at 310 K.
3.1. Comparison of the effects of Na and Mg
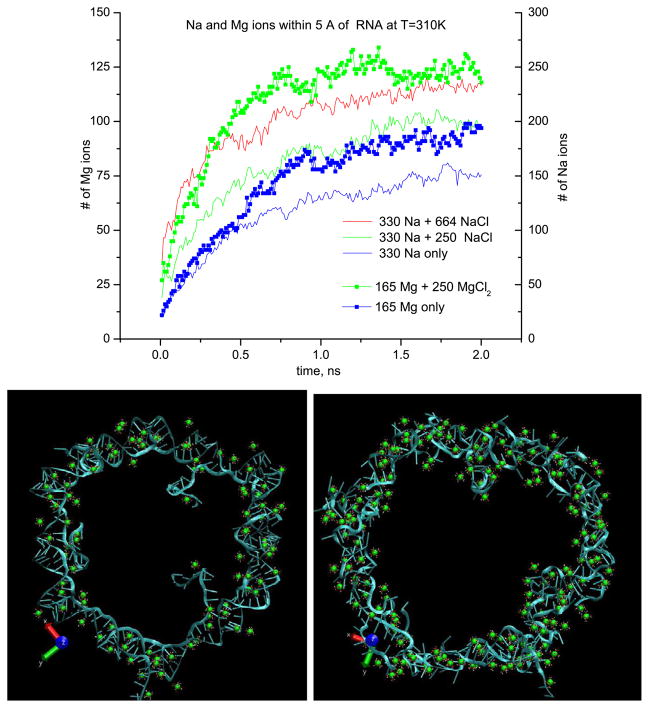
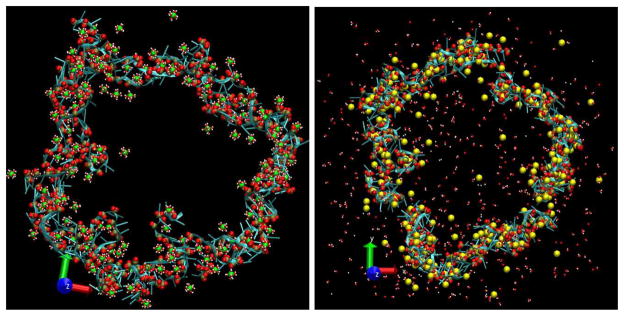
Figure 2 shows the number of ions in the vicinity of the RNA in comparison with both Na and Mg at different concentrations at 310 K. Mg is found to be more efficient in solvating the RNA nanoring for the ‘no salt’ system, as well as at the equal concentrations of both ions. This is not surprising since this effect should be proportional to the ionic strength (i.e. concentration times charge squared). The efficiency of Mg in solvating the RNA nanoring shows up even if in our simulations we always find magnesium in the hydrated state, Mg2+(H2O)6, surrounded by six tightly bound water molecules, while Na is found to be much less solvated by water molecules, which can diffuse away from Na ions in the course of our simulations (figure 4).
Figure 2.
Top: number of ions within 5 Å of RNA versus time for different concentrations of Na and Mg ions at 310 K. The color coding is explained in the body of the figure. The scale of the y-axis for Mg2+ ions is made two times smaller than that for Na+ ions to allow better visual comparison. The adsorption of the Cl ions (not shown) on the nanoring is much lower. Bottom: sample snapshots of the RNA nanoring after 2 ns equilibration, in the ‘no salt’ system (165 Mg) at T = 310 K (left), in the ‘physiological solution’ (415 Mg) at T = 510 K (right). Mg ions situated only within 5 Å of the RNA ring are shown in green, together with six bound water molecules (red and white), Cl ions are not shown.
Figure 4.
Top views of the RNA nanoring in the ‘no salt’ systems (165 Mg or 330 Na) after 1 ns ‘quenched’ equilibration at T = 310 K. Only those Mg and Na atoms that have been located within 5 Å of RNA nanoring in the beginning of the runs are shown (such representations allow one to visualize the process of evaporation of the ions from the nanoring). Mg atoms are shown in green, Na atoms are shown in yellow. Water molecules that have been located in the first solvation spheres for Mg and Na in the beginning of the runs are shown in red and white. The phosphorus and two non-bridging oxygens atoms in each phosphate group are shown as brown and red spheres.
While the difference in behavior of Na and Mg is clearly demonstrated in figure 2, at 310 K the equilibration process of the nanoring is probably not complete within the 2 ns time period since the number of ions adsorbed on the ring does not clearly show saturation. In a series of analogous runs made at 510 K the number of adsorbed ions does saturate by 2 ns; however, the interaction energy between RNA and ions as well as the RMSD of the nanoring continue to grow, suggesting that while the Manning condensation onto the ring [12] has reached an equilibrium state, some slower processes, probably related to the migration/redistribution of the ions along the RNA ring, accompanied by a structural change in the ring, are taking place.
A sample configuration after a 2 ns equilibration with 165 Mg ions at 310 K is shown in figure 2 in comparison to another one (with 415 Mg) obtained after 2 ns at 510 K. Both Na and Mg ions seem to be distributed uniformly along the ring by the end of these runs. The structure of the ring is much better preserved at 310 K, though in-plane fluctuations and the out-of-plane bending of the ring are visible upon inspection of the trajectories. In fact, the number of hydrogen bonds between base pairs is reduced, compared to the initial structure, at both studied temperatures, as discussed further in section 3.3.2. Nevertheless, during the times accessible in our simulations, we observed a break of the nanoring (in a ‘kissing loop’ area) only at 510 K for the ‘no salt’ Na system (after ~4 ns), while no clear-cut breaks were seen in all other runs, with Mg as well as in those with higher Na concentration.
The remarkable feature observed in the 510 K runs is a much higher concentration of ions near the RNA compared to that at 310 K. For example, at 510 K the number of Na ions in the vicinity of RNA increases up to a constant value of ≈0.8 Na per phosphate by t ≈ 2 ns (figure 3), while it reaches only ≈0.5 Na per phosphate at 310 K (figure 2). This effect is clearly visible at other concentrations, and both with Mg and Na ions. For example in the snapshot with the ‘physiological solution’ (415 Mg) from figure 2, there is ≈1.15 Mg ions per two phosphates adsorbed at T = 510 K compared to ≈0.8 Mg per two phosphates at 310 K (the first figure is more than unity due to the presence of some adsorbed Cl ions).
Figure 3.
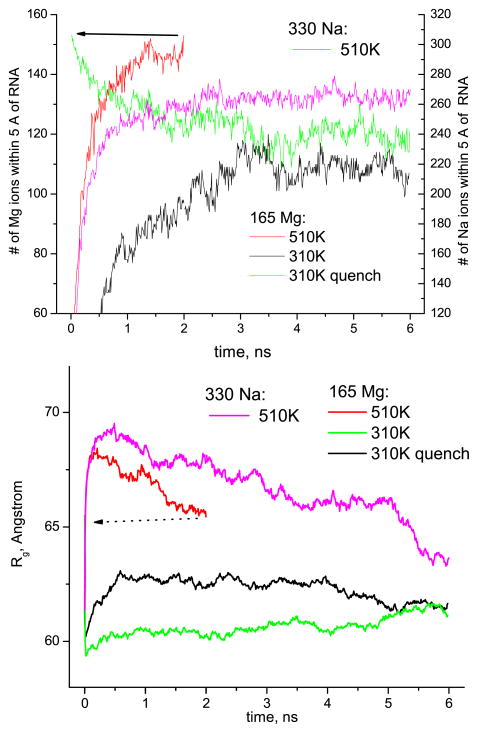
The number of ions found within 5 Å of RNA (top) and the radius of gyration Rg of the RNA nanoring (bottom) versus time in the selected 6 ns runs for the ‘no salt’ systems (165 Mg or 330 Na) at 510 K and 310 K. The arrows indicate the 510 K run serving as a starting point for 310 K quenched run.
3.2. Quenched runs
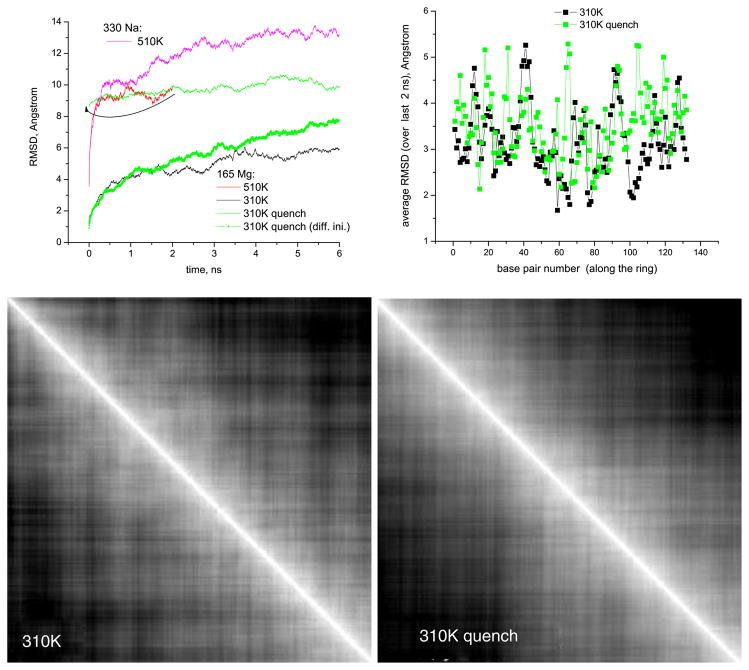
In order to better elucidate the behavior of the ions and the RNA nanoring during equilibration, we extended some of the previously mentioned runs up to 6 ns. In addition, we have carried out ‘quenched’ 310 K runs starting from configurations obtained at 510 K. Figures 3 and 5 compare the results of one such quenched run with the one obtained straightforwardly at 310 K starting from the ‘standard’ initial configuration depicted in figure 1. We show the data from the following four runs: the runs for the ‘no salt’ (165 Mg) system, namely the one at 510 K (2 ns long, serving as a starting point for the ‘quenched’ run), and at 310 K, the quenched and regular runs (both 6 ns long); besides, ‘no salt’ (330 Na) system 6 ns long run at 510 K is shown for comparison. Several points should be emphasized here.
Figure 5.
Top part: (left) overall RMSD of the nanoring calculated from the reference structure in figure 1 versus time for the same quenched and non-quenched runs that are shown in figure 3; the RMSD for the quenched 310 K run is also replotted taking the last configuration of the preceding 510 K run as the reference (green symbols), the arrow indicates the 510 K run serving as a starting point for 310 K quenched run; (right) RMSD for separate base pairs versus the base pair number, averaged over the last 2 ns chunks of runs depicted on the left. Bottom part: 2D RMSD maps for 310 K run (left) and 310 K quenched run (right) depicted above. The span of both directions is 6 ns, the coordinate origin is at the top-left corner. The grayscale (white to black) is drawn from 1 Å to 6 Å for 310 K run and to 7 Å for 310 K quenched run.
Firstly, an interesting consequence of the quenching process is the evaporation of the ions from the ring into solution upon a decrease in temperature (figure 3, top, green line). This phenomenon is present for both the systems with Mg and Na and has approximately the same magnitude. As can be seen from the snapshots in figure 4, the Mg ions evaporate together with the tightly bound first solvation spheres of water, while Na ions shed their water solvation spheres easily in the course of simulation. For both the quenched and non-quenched 310 K runs the number of ions near the RNA reaches a saturation value at about 3 ns. From the average of the endpoints of two ion evaporation/condensation curves (e.g. green and black lines in figure 3), we can estimate the equilibrium ion ‘coverage’ of the nanoring at 310 K as ≈0.7 Mg per two phosphates for the ‘no salt’ Mg system, compared to ≈0.9 at 510 K. The corresponding figures for the ‘no salt’ Na system (not shown in the figures) are ≈0.6 Na per phosphate at 310 K compared to ≈0.8 at 510 K.
Secondly, as can be seen from figure 3 (bottom), soon after the number of ions near the nanoring stabilizes, the radius of gyration Rg of the nanoring reaches the same value for both quenched and non-quenched final configurations at 310 K. This occurs despite the persisting difference in microscopic detail between the two configurations. Indeed, the rather disordered ‘quenched’ state, depicted in figure 4 and further analyzed in section 3.3.2, shows no tendency to return to an ordered configuration, at least during 6 ns. This suggests that the ‘quenched’ ring is trapped in a long-lived intermediate metastable state, that it has been brought to at the higher temperature, but nevertheless it returns to the same overall shape. This observation supports a conjecture (see e.g. [13]) that the global shape measure, radius of gyration, is strongly influenced by the quantity and the valence of the adsorbed ions, no matter what the microscopic details are. The effect of the ion valence on the radius of gyration can also be seen in the 510 K runs in figure 3 where Mg, as compared to Na, not only adsorbs onto RNA better, but it also results in a more compact structure (a similar tendency is observed at 310 K in the runs that are not shown).
Finally, let us elaborate on the behavior of the RMSD for the nanoring. It is depicted in figure 5, where the overall RMSD values for the RNA nanoring, as well as those calculated for each ‘native’ base pair separately, are presented. The overall RMSDs calculated from the initial structure in figure 1 do show saturation at 6 ns for both temperatures, but the values are quite large (6–7 Å at 310 K and 13 Å at 510 K) which could possibly raise a question as to whether equilibration has been achieved in 6 ns (e.g. the RMSD for the quenched 310 K run replotted from different reference structure does not seem to show the clear-cut saturation in 6 ns, green symbols). A better representation of the RMSD for a trajectory would be a 2D map, which shows the RMSDs calculated starting from all time origins (figure 5, bottom). From the grayscale patterns visible on these 2D RMSD maps, and from the corresponding section profiles, one can judge that at about 3 ns (this coincides with the time when the process of ion redistribution around the nanoring stabilizes, cf figure 3, top) the RMSD for both non-quenched and quenched 310 K runs changes its behavior toward slower growth, even though it still grows diffusively with time within the scale of our simulations. We believe that such behavior of the RMSD can be explained by the large floppiness of the RNA nanoring. Indeed, according to the principal component analysis of the nanoring’s trajectories [14], about ten of the largest principal components show a cosine-like time evolution, which evidences the purely diffusive randomized motion of the slowest modes [15, 16]. In spite of this floppy random motion of the slowest modes of the nanoring, the overall structure of the nanoring is well stabilized at 310 K, as evidenced both by the radius of gyration behavior, figure 3, bottom, and by the absence of any regular global dependence of the RMSDs calculated for separate base pairs on the base pair number along the ring, figure 5 (some of the peaks visible in this plot though can be associated with the groups of base pairs found in the ‘kissing loops’).
By contrast, for the 510 K runs, the radius of gyration does not show any convergence to a final stable value (see e.g. the curve in figure 3, bottom, for 330 Na system). Instead it is steadily decreasing, meaning that the ring collapses to a more compact, possibly globular, shape. Let us note here that the final equilibrium structure at 510 K should likely consist of unfolded single-stranded RNA fragments. Even though we cannot observe this unfolding in our simulation since it should happen on much longer time scales, than those accessible to us, one may wonder why on the way to this unfolded state the ring passes through a more compact, possibly globular one. One plausible explanation lies with the idea of ‘self-stabilization’ due to enhanced condensation of the ions with increasing temperature, as further discussed in the section 5.
3.3. Ionic distributions, hydration and structural changes in the RNA nanoring
In order to better understand the behavior reported in the previous section 3.2, it is instructive to look into the environments of ions and water molecules near the RNA and into the structure of the RNA nanoring itself, in their dependence on temperature.
3.3.1. Ion binding
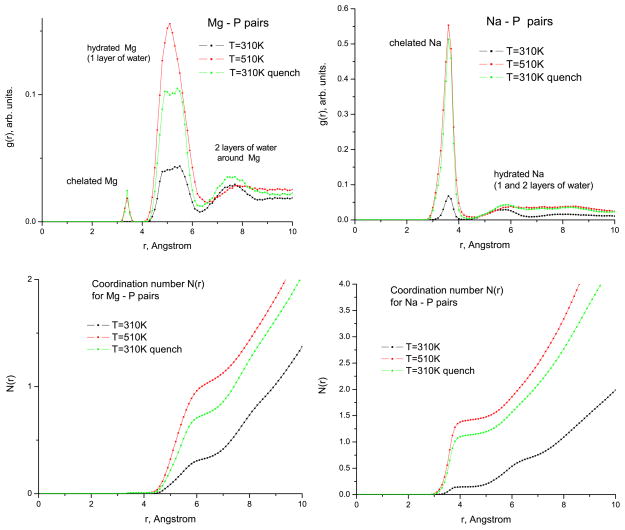
Figure 6 shows the radial distribution functions (RDFs) g(r) for Mg–P and Na–P pairs in the ‘no salt’ Mg and Na systems. One can see two main peaks associated with the hydrated Mg ions, surrounded by either one or two layers of water, respectively. No ‘chelated’ (in direct contact with O) Mg ions were found at 310 K, only a few (3 out of 165) in the 510 K run and the 310 K quenched run. As one can judge from the plots of the running coordination number N (r) (the volume integral of g(r)), the overall decrease of Mg ions around the RNA upon quench is due to the decrease of hydrated Mg. Qualitatively a similar picture is observed for the ‘physiological solution’ Mg system where, however, the chelated Mg ions are also found in the 310 K runs (in the same proportion, ≈7 out of 415). By contrast, in the ‘no salt’ Na system, most of Na ions are chelated (the strong g(r) peak in figure 6, right). The overall decrease of ions around the RNA in this case is due to the decrease of both chelated and hydrated (surrounded by one and two layers of water) Na. One concludes therefore that the evaporation process of ions appears to be independent of the hydration state of ions in the vicinity of RNA.
Figure 6.
Radial distribution functions g(r) and running coordination numbers N (r) for Mg–P and Na–P pairs at two temperatures for the ‘no salt’ systems with Mg and Na, respectively.
3.3.2. Hydration and hydrogen bonding
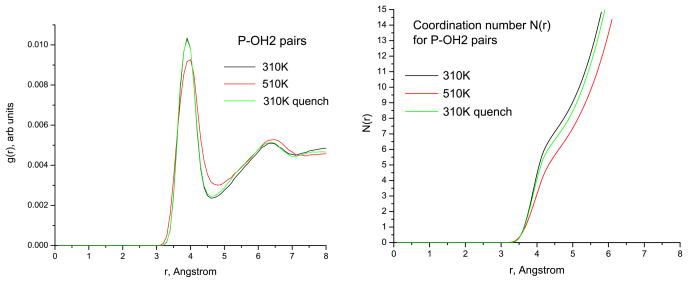
Figure 7 shows the RDFs for the P–OH2 pairs (where OH2 stands for water oxygen). One can observe reduced hydration of the nanoring at the higher temperature, T = 510 K, while upon the quench to 310 K the number of water molecules in the vicinity of the ring is restored back to the number found in the 310 K run. Thus, the screening of the RNA phosphate groups proceeds differently at the two studied temperatures, and it represents what can be interpreted as a binding competition between the ions and the hydration water.
Figure 7.
Radial distribution functions g(r) and running coordination numbers N (r) for P–OH2 pairs at two temperatures for the ‘no salt’ Mg system.
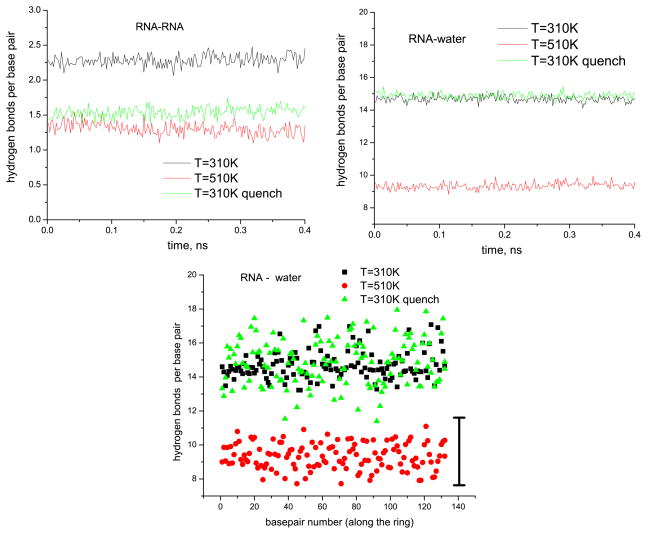
This picture is further corroborated by the hydrogen bonding patterns in the system. Figure 8 demonstrates the behavior of those hydrogen bonds that form between the RNA and water, as well as of those found inside the RNA (i.e. between the base pairs). We measured instantaneous hydrogen bonds via a facility provided in VMD, with slightly increased cutoffs for distance and angle (3.3 Å and 30°, respectively, instead of the ‘standard’ values 3.0 Å and 20°) in order to match the quantity of about 2.5 hydrogen bonds per base pair at 310 K. As attested to in figure 8, right, each base pair is thus hydrated on average by ≈15 water molecules at 310 K, both in the quenched and non-quenched runs, and this number settles down in the very beginning of the runs. At the same time, only ≈9 hydrogen bonds with surrounding water per base pair still survive at 510 K. We were not able to determine any sequence-specific features of these hydration numbers since their temporal fluctuations are larger than their apparent differences between the base pairs (figure 8, bottom).
Figure 8.
Hydrogen bonds in the RNA nanoring system. Top: typical time dependences of total number of hydrogen bonds for RNA–RNA and RNA–water interactions (data are given per base pair) during the last 400 ps long chunks of the simulated trajectories. Bottom: time-averaged number of hydrogen bonds (RNA–water) for every base pair versus base pair number (along the ring). The vertical black bar shows typical dispersion for this number in a trajectory.
Only about half of the hydrogen bonds between base pairs inside the RNA itself survives at 510 K (figure 8, left). Unlike those bonds between the RNA and water, these base pair hydrogen bonds do not recover quickly upon quench to 310 K (or they evolve much slower at the speeds not attainable in our simulations). Instead, the hydrogen atoms from these destroyed RNA–RNA hydrogen bonds serve as donors for creating additional hydrogen bonds with water, so that the quenched 310 K configurations are actually hydrated more than those obtained directly at 310 K (it becomes evident if one considers not only the phosphate hydration, as e.g. in figure 7, but the hydration of the whole RNA, data not shown).
3.3.3. Structural transition in the nanoring backbone
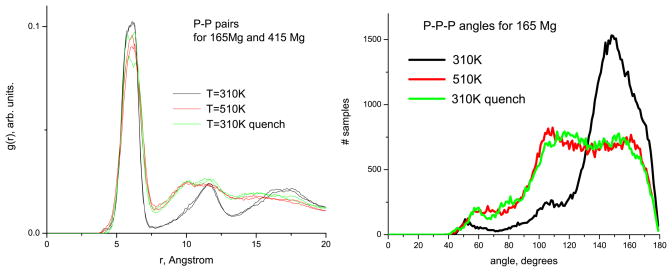
Apart from the obvious reduction of the hydrogen bonding between base pairs at the elevated temperature of 510 K, an interesting structural change in the RNA nanoring backbone takes place with the changing temperature, as evidenced by the radial distribution functions for the P–P pairs, and by the distributions of the P–P–P angles (figure 9, the case of Mg ions is shown). The g(r) plots reveal four peaks centered at 6.0 Å, 11.5Å, 16.0 Å and 17.5 Å, that correspond to the 1st, 2nd, 3rd P neighbours, and to the base pairs, respectively. Note also that at high T = 510 K some peaks (notably, the second one) are shifted toward lower distances compared to the case of T = 310 K, and the reverse process of shifting back to larger distances can be observed upon quench back to 310 K. Examination of the angular dependences reveals that this transition is associated with the population of P–P–P angles near Θ ≈ 110°. Based on these plots one can conclude that, on average, the phosphates become closer to each other with increasing temperature. In other words, the one-dimensional RNA charge density along the ring effectively increases. According to the arguments presented in [17], further discussed in the section 5, this should, in principle, result in a higher uptake of ions.
Figure 9.
Radial distribution functions for P–P pairs (left) and the distribution of the P–P–P angles (right) at two studied temperatures for the systems with Mg ions. The multiple lines of the same color in the plots of RDFs are for different concentrations of Mg.
4. Forced dynamics of the RNA nanoring
Having configurations that are essentially close to equilibrium in solutions of Na and Mg salts, we apply external forcing to the nanoring with the main purpose to determine its elastic response. Namely, a compressive (expansive) force, directed to (from) the center of mass of the ring, is applied to the 2310 atoms of the nucleic backbone using the steered molecular dynamics functionality of the NAMD package. This setup, dictated by the geometry of the ring, should give the average tensile or expansive elasticity of the ring. Note that the strength of the ring is mainly determined by the hydrogen bonding between base pairs, and therefore the magnitude of the applied force should be approximately comparable to the hydrogen bonding strength. Namely, since the ring contains 132 base pairs in total (excluding the unpaired tails), it may have some 132 × 2.5 ~ 300 hydrogen bonds, and since the force needed to break a single hydrogen bond is ~0.3 pN, the total force that can be sustained by the ring is less than ~100 pN (it is typically the forces of this order or less, that are required to unfold a chain-like RNA structure when applied to its two ends). This determines the order of magnitude of the force that needs to be applied to each of the atoms of the nucleic backbone in our simulations, as less than 0.05 pN. More specifically, in the simulation, we applied to each backbone atom a uniform acceleration (rather than a force). Given the average mass of the atoms in the backbone of ≈16 amu, the acceleration applied should not exceed 0.02 Å ps−2 per atom. The caveat is that the forced dynamics of the ring under such weak forcing is expected to be extremely slow (e.g. up to ~ μs in the unfolding experiments), and beyond the reach of our simulations. In attempts to circumvent this difficulty, we studied the response of the ring to a wide range of forcing magnitudes starting from 0.01 Å ps−2 and up to 1.0 Å ps−2. However, only the smallest applied force assisted us in elucidating some of the elastic properties of the ring, while at higher forces we were able to obtain its transport properties only.
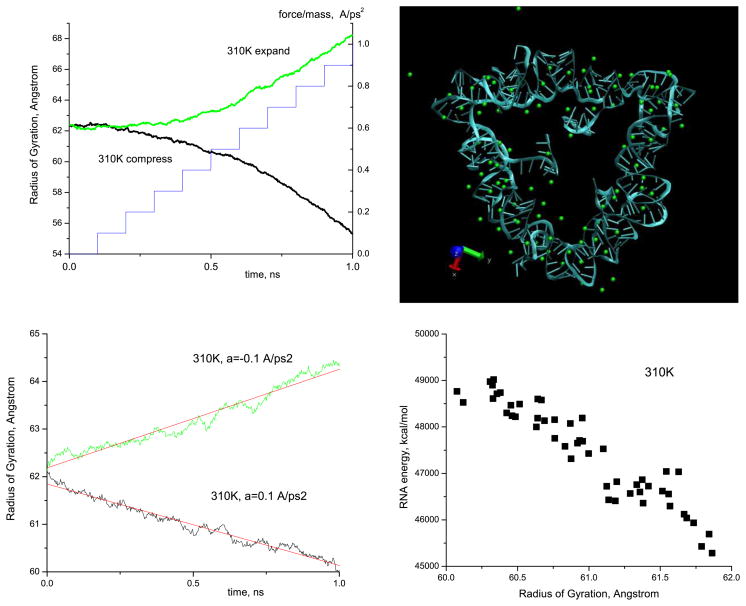
In the first two runs, we increased the magnitude of forcing in a quasi-linear (staircase-like) manner, from zero up to 1.0 Å ps−2, by increments of 0.1 Å ps−2, with a time interval of 100 ps between the increments. In addition, we made two longer 1 ns runs at a constant forcing of 0.1 Å ps−2. Figure 10 shows the typical dependences of the radius of gyration Rg of the nanoring solvated in 165 Mg2+ ions versus time, both for compressive and expansive forcing. From the Rg (t) curves we observe that the response of the ring is smooth (apart from some fluctuations), namely parabolic or linear, for quasi-linearly increasing or constant forcing, respectively, and no equilibration or steady position is achieved. Thus, it is problematic to determine the elastic properties of the ring in this regime of strong forcing.
Figure 10.
Top part: (left) radius of gyration of the RNA nanoring (left y-axis) versus time upon the application of quasi-linearly increasing (staircase-like) radial external force (right y-axis); (right) snapshot of the RNA ring subjected to further extreme compression at 310 K, when the force reaches a value a = 1.7 Å ps−2. Bottom part: (left) radius of gyration of the RNA nanoring versus time under the application of the constant compressive/expansive force of intermediate magnitude a = 0.1 Å ps−2, as described in section 4; (right) the dependence of the total energy of the RNA ring versus its radius of gyration for the set of the compressed configurations generated under the application of the force of a = 0.1 Å ps−2.
Such Rg (t) curves can be easily rationalized in the framework of the overdamped motion of a single noninteracting particle of a mass m, subjected to an external force. This is because the magnitude of the external force is too large to allow the interactions between the atoms in the RNA ring to show up in the forced dynamics. Namely, the equation of motion is m ηeffṘ = −ma, where a is the acceleration, and ηeff is an effective damping of the motion of a particle. Integrating this equation, one obtains R ∝ −ct2/(2ηeff) for the case of quasi-linear forcing a ≈ ct, and R ∝ −a0t/ηeff for the case of constant forcing a = a0. Thus, one can determine the effective damping from these trajectories. It yields ηeff ≈ 80 ps−1 at T = 310 K (for both quasi-linear compressive and expansive forcing of the ring) and ηeff ≈ 45 ps−1 at T = 510 K. The value of ηeff obtained at 310 K is approximately three times larger than the one reported for the diffusion of a single nucleotide in water [18]. Moreover, if the Arrhenius dependence η = η0 exp(Ea/kB T) holds, one can estimate the activation energy as Ea ≈ 460 K. For weaker constant forcing we obtain the values for the damping as follows: ηeff ≈ 55 ps−1 for compression/expansion at T = 310 K, and ηeff ≈ 30 ps−1 for compression at T = 510 K. These values are smaller than those obtained under the influence of stronger forcing; however, they still lie in a reasonable range (the activation energy remains approximately the same, Ea ≈ 480 K).
Note that even though the applied forces were strong enough to yield the free drift of the RNA nanoring parts w.r.t. each other, and to preclude any elastic response, we obtained in this way a set of configurations spanning a whole range of Rg. The question we posed is whether this set of configurations can be used to estimate elastic properties via (possibly parabolic) energy-strain dependences? In order to answer this question, we determined the total potential energy of the RNA ring, E, for each of the configurations that correspond to the compression curves from figure 10. As seen in figure 10, despite some dispersion of the data, obtained E(Rg) dependences are linear rather than parabolic. A possible explanation is that the configurations obtained are not representative of the equilibrium, which precludes a reliable determination of the elastic coefficient in this way too.
It is worth to note that under such strong compression, the ring shows an interesting folding feature. Namely, under the compression regime described above, up to the forces of a ≈ 1.0 Å ps−2 the ring compacts uniformly, without loosing its hexagonal shape. However, at yet stronger compression (a ≥ 1.5 Å ps−2, Rg ≤ 50 Å) the ring starts to fold into a triangular shape (figure 10), where three of the six ‘kissing loops’ form angles and the three remaining ones belong to the sides of the triangle. Of course, at yet higher compressions the RNA acquires a completely spherical shape.
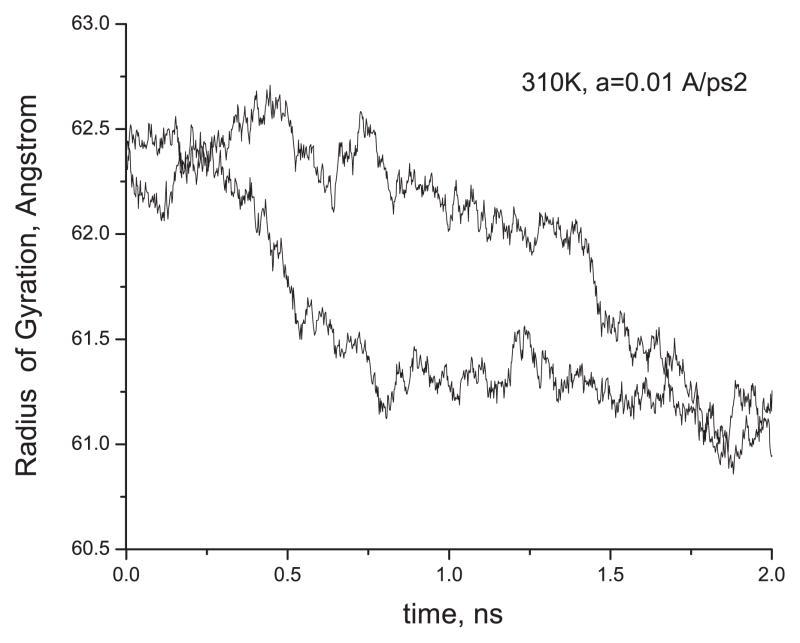
Finally, two 2 ns runs that have been carried out at the smallest force we used, a = 0.01 Å ps−2 (estimated to be about two times smaller than the one needed for breaking the hydrogen bonds in our system), are shown in figure 11. Even if the depicted Rg (t) dependences do not achieve a stable equilibrium yet, one can judge from the appearance of a steady plateaux at T = 310 K, where the system spends a comparatively long time (≥200 ps) before jumping to the next plateau, that in this series of runs the hypotheses of the free drift of the non-interacting RNA backbone particles under the effect of an external force is no longer valid, and equilibrium can be achieved, given longer annealing times. With the current simulation data of a maximum duration of 2 ns we can give only the lower bound for the compressive strain of the nanoring (δRg ≥ 1.5 Å at T = 310 K). This enables us to give, respectively, an upper bound to the corresponding elastic coefficient (since the latter should be inversely proportional to the former). Namely, for the sake of simplicity, and because of the quasi-planar geometry, we write the following 2D formula for the linear elasticity in the plane of the ring:
| (1) |
where δP is the change of the ‘2D-pressure’ (i.e. force per unit length of the nanoring perimeter), and δS is the respective change of the surface in the plane of the ring. Note that this formula is analogous to the expression that defines the bulk modulus K in 3D ( , where V is the volume). Therefore, K2D, a quantity with the dimensions of Nm−1, can be termed a ‘2D surface modulus’.
Figure 11.
Gyration radius of the RNA nanoring versus time under the application of the smallest constant compressive force of a = 0.01 Å ps−2, as described in section 4. Two independent Langevin runs are shown.
Furthermore, given the expressions for the ‘2D pressure’ change δP = aM/2π Rg (where M ≈ 37951 amu is the total mass of the RNA backbone, to which the force is applied), we can estimate the upper bound for K2D as K2D ≤ 0.03 Nm−1. In order to compare this value with some corresponding value in 3D, we divide K2D by the (approximately constant) thickness of the ring h ≈ 30 Å, to obtain Keff ≤ 0.01 GPa at 310 K. This is a very low value, which is expected, as the RNA ring is a ‘soft matter’ material (water bulk modulus is ≈2.2 GPa, and typical values for DNA Young modulus are ~0.1 GPa).
5. Discussion
Our present study demonstrates some interesting features of the RNA nanoring, and opens some questions about the behavior observed.
The phenomenon of the evaporation of adsorbed ions from the RNA into water when the temperature is dropped merits further inquiry, as it can be of practical importance. Indeed, ions are known to be an important factor in the stabilization of the native folds of biopolymers because they efficiently screen the negatively charged phosphate groups. A higher uptake of ions by the RNA ring with an increase in temperature can be interpreted as a mechanism of ‘self-stabilization’ demonstrated by the RNA ring. This mechanism should be ubiquitous for other RNA structures as well.
This intriguing, at first glance, behavior can be readily rationalized even within the simple ‘Manning condensation’ theory [12] if one takes into account the temperature dependence of the water dielectric constant ε. The Manning theory describes the adsorption of counterions onto a rod-like charged polymer of infinite length. It shows that if the polymer (the RNA ring in our case) is charged too much, i.e. if its length per unit charge Le is small enough, Le < ZLB, where Z is the valence of counterions and LB is the so-called Bjerrum length
| (2) |
then the counterions from the solution will condense onto the polymer, thus decreasing its effective charge and increasing Le, until the resulting density of charge falls to the critical value that corresponds to L̃e ~ LB. In equation (2), LB is the distance at which the electrostatic energy between two elementary charges e in a medium with the dielectric constant ε is ~kT. The remaining effective charge per nucleotide after the counterion condensation occurred is given by q̃/e = Le/ZLB, i.e. it is inversely proportional to the Bjerrum length. As Le ≈ 1.3 Å for an A-form RNA double helix [13], and LB ≈ 7Å at T = 310 K in water, the remaining charge per nucleotide would be, e.g. q̃ ≈ 0.1e only for Mg ions (Z = 2) condensation on a straight double helix.
It should be noted that Manning condensation theory has been derived for linear infinite length polymer geometries, and for low counterions strength I, i.e. for polymers whose diameter is much smaller than the Debye’s length , where NA is the Avogadro number. In our case LD ~ 5Å at T = 310 K even for the ‘no salt’ Mg system (that contains barely the ions needed to neutralize RNA) i.e. it is comparable to the thickness of the ring. In the case of a polymer of a general shape, one can still obtain a similar insight into the thermodynamics of the counterion condensation by equating the chemical potentials of the free and condensed counterions in their equilibrium [13]. The chemical potential of the free counterions in solution is μfree ≈ kT ln(c), where c is their concentration. The chemical potential of the condensed ions is given by an average interaction energy of an ion with the RNA polymer, μcond ≈ Nq̃Ze2/4πεRg = Nq̃ZkTlB/Rg, where N is the number of nucleotides and Rg is an average distance between the counterions and the charges in the RNA, i.e. it is a characteristic RNA size. This characteristic size can be approximately taken as Rg ∝ NLe for the linear geometries, and Rg ∝ N1/3 Le for the globular geometries (see e.g. [19]). Equating μcond = μfree, one can see that the remaining charge per nucleotide is again inversely proportional to LB:
| (3) |
If one neglects the variation of Rg with temperature, then the total temperature dependence of q̃ is determined by that of LB. For example if LB decreases while the temperature increases (as would be the case without taking into account the temperature dependence of ε), the effective remaining charge q̃ would increase, and therefore, less ions would be adsorbed onto the polymer at a higher temperature. However, a sufficiently strong change of the dielectric constant ε may actually reverse this picture. It is known that the experimental dielectric constant of water monotonically decreases with increasing temperature in the following fashion [20]: ε = ε*(T */T)1.4 (by ≈2.0 times in the range 310–510 K), so that the Bjerrum length LB actually increases with temperature as LB ∝ T 0.4 according to equation (2). This leads to q̃ ∝ T−0.4, i.e. the remaining effective charge decreases with temperature due to stronger counterion condensation (by a factor of ≈1.2 times in the range 310–510 K). From figure 3 one can see that the remaining charge at 510 K is about 0.1e per phosphate at 510 K (16 Mg ions per 330 nucleotides), while it increases to ≈0.3e per phosphate upon evaporation of 30 Mg ions. Thus, the evaporation of ions from the ring upon quench that we observe in the present work may indeed be qualitatively explained via the behavior of the Bjerrum length (however, in our simulations the magnitude of the phenomenon seems to be stronger than that resulting from the crude estimation above).
Even though the above-mentioned behavior of the water dielectric constant is known to lead to a decrease of ion solubility in water in some cases, simple salts are known to be unaffected (e.g. for NaCl the solubility slightly increases with increasing temperature, up to at least 600 K). On the other hand, the phase transitions or structural changes in some other salts (like the dehydration process in sodium sulphate) may lead to their solubility in water actually decreasing with increasing temperature, similar to the tendency we observe. Therefore, a further analysis of the structural changes/phase transitions in the RNA ring itself may lead to a complete explanation of the observed behavior of the ions.
One of the simplest structural changes in the ring is its thermal expansion (contraction). Indeed, we observe in our simulations that between 510 K and 310 K the ring contracts about 5% in size (this is roughly the same figure seen for pure water). A more subtle structural change in the RNA ring has been evident in section 3.3 from the analysis of the radial distribution functions g(r) for the P–P pairs and the P-P-P angular distributions. The shift of the second P–P neighbour peak with increasing temperature that corresponds to the change of the P–P–P angle from Θ ≈ 150° to a value Θ ≈ 110° (figure 9) may indicate that, on average, the RNA charge density effectively increases with the temperature. Given the 5% thermal expansion, this obviously cannot happen uniformly throughout the ring, but we may expect that the effective increase in charge density can occur at least locally. Indeed, visual inspection of the atomic configurations reveals that while such an angle change occurs throughout the ring, it is somewhat more enhanced in the regions of the kissing loops. As is shown in [17], such an increase in charge density leads on average to an increase of the number of the retained ions. A simple argument behind that is the following: the higher charge density creates stronger attractive electric fields to the ions. It is important to stress that the local peak of the P–P–P angle distributions at Θ ≈ 110°, that we observe in our simulations, and that participates in the structural transition under the temperature change, is not an artifact of the force field used, as it is also observed in similar angular distributions obtained from a wide set of the experimental RNA structures (V Tozzini, private communication).
In a recent article [21], an interesting and closely related effect was observed in the MD simulation of a DNA dodecamer solvated in water with Na ions. The authors artificially modified the dielectric constant of the flexible SPC water by adjusting its atomic charges, and observed the transition of the DNA double-helix from the A-form (more compact) to the B-form, accompanied by ion migration away from DNA upon increase of the water dielectric constant. The authors of [21] interpreted this effect in terms of a subtle interplay between the direct counterion coupling and hydrogen bonding of water to the phosphates. This phenomenon resembles what we see in our simulations for the RNA nanoring, where the dielectric constant of water increases due to a temperature drop, as described above. For RNA there is no B-form helix, so the transition is different in our case, and while it requires a further detailed study, we observe it to be associated with the change of the P–P–P backbone angles. Furthermore, according to equation (2), this effect should be rather universal and, in particular, occur in any temperature range, as long as the dielectric constant of the solvent drops monotonically faster than ∝1/T with increasing temperature (which is the case at least for water). Thus, it represents an ingenious ‘self-stabilization’ mechanism that nature created for DNA/RNA and possibly for a number of other biopolymers.
In addition, let us note that our findings about the behavior of the ions seem to be corroborated by the experimental temperature dependences of the folding isotherms of the Tetrahymena ribozyme [13] versus Na ion concentration. It was observed in [13] that lower volume concentrations of the ions are required to induce the folding transition of RNA at higher temperatures. This means that the effective equilibrium constant of the process increases with temperature. Though the above-mentioned constant should include, in principle, both the contributions from RNA folding itself and the ions associated with the RNA, one may speculate that more efficient ion condensation as temperature increases is the reason for such counter-intuitive behavior.
Finally, one may wonder how the results reported in the present work might have been affected by the use of the simple non-polarizable force fields (such as CHARMM27 for RNA and TIP3P for water). TIP3P water at room temperature has a dielectric constant of 82 which is very close to reality (78.5) [22]. However, we are not aware of any studies of its temperature dependence. We suppose that the TIP3P water dielectric constant behaves under temperature changes at least qualitatively in the same way as the one for real water. This is quite reasonable since the dielectric constant, as a measure of correlation in mutual orientation of water molecule dipoles, should decrease with increasing T in any water model. For a few different simple water models (both non-polarizable and polarizable, but not TIP3P) a decrease of the dielectric constant with temperature, similar in magnitude to experimentally observed values, has been reported in [23]. Polarizable force fields for the biomolecules themselves, that are now being developed for biomolecular simulations, are still in their infancy [24]. Among the advances in this direction, the CHARMM fluctuating charge (FQ) force field for proteins [25], the PMM force field [26] for RNA (that cannot be applied in regular MD simulations, unfortunately), as well as the ff02 AMBER force field [27] can be mentioned. While polarization effects are definitely important in complex inhomogeneous systems, such as the one under study (in particular in terms of the competition between the water and ions for binding to RNA, [5], p 389), the currently available polarizable force fields may actually make the situation in the simulations less realistic compared to the standard non-polarizable ones (see e.g. [28] and [26]). Though it is difficult to tell in advance how the use of an alternative (polarizable) force field for RNA/ions/water would influence our results, the fact that the observed behavior of the ions is the same both for Mg and Na, and that its explanation is quite basic (it relies on the temperature dependence of water dielectic constant) led us to believe that the phenomenon of ions evaporation we observe should be robust and somewhat independent of the force field used (though a verification with the help of a realistic polarizable force field would definitely be an advantage once such a force field for the system under study becomes available).
6. Conclusions
In the present paper we reported a detailed MD study of the RNA nanoring solvated in a water box together with Na and Mg ions. A process of evaporation of the ions from the ring was observed upon the decrease in temperature during ‘quench’ runs, illustrating a strong increase of the equilibrium concentration of the ions adsorbed on the ring with temperature. For example, for the ‘no salt’ system the increase is from ≈0.6 Na per phosphate or ≈0.7 Mg per two phosphates at T = 310 K to ≈0.8 Na or ≈0.9 Mg at T = 510 K. Possible explanations of this behavior in terms of temperature dependence of the water dielectric constant and the structural changes in the ring have been given, though this phenomenon deserves further investigation.
The properties of the ring such as elastic and transport coefficients have been estimated. We gave an estimate for the tensile elasticity of the ring against its uniform 2D in-plane compression, as Keff ≤ 0.01 GPa at 310 K, which is a lower figure in comparison not only with water, but also with some of the typical representatives of ‘soft matter’ (including DNA). To what extent can different elastic coefficients for soft matter materials, obtained by different methods, be compared to each other, requires further clarification.
This first analysis of the properties of RNA nanostructures via full MD simulations by using state-of-the-art computing facilities is currently being supplemented by the development of a coarse-grained model suitable for the description of such nanostructures at much longer time scales.
Acknowledgments
MP and RM are grateful to the NSERC and the CRC Program for the support. BAS was supported in part by the intramural research program of the NIH, National Cancer Institute, Center for Cancer Research. This work was made possible by the facilities of the Shared Hierarchical Academic Research Computing Network (SHARCNET: www.sharcnet.ca). The authors are grateful to Sarah Woodson for helpful comments and suggestions.
References
- 1.Jaeger L, Chworos A. Curr Opin Struct Biol. 2006;16:531. doi: 10.1016/j.sbi.2006.07.001. [DOI] [PubMed] [Google Scholar]
- 2.Jaeger L, Westhof E, Leontis N. Nucleic Acids Res. 2001;29:455. doi: 10.1093/nar/29.2.455. [DOI] [PMC free article] [PubMed] [Google Scholar]
- 3.Holbrook SR. Curr Opin Struct Biol. 2005;15:302. doi: 10.1016/j.sbi.2005.04.005. [DOI] [PMC free article] [PubMed] [Google Scholar]
- 4.Yingling YG, Shapiro BA. Nano Lett. 2007;7:2328. doi: 10.1021/nl070984r. [DOI] [PubMed] [Google Scholar]
- 5.Sponer J, Lankas F. Challenges and Advances in Computational Chemistry and Physics. Vol. 2. Berlin: Springer; 2006. Computational Studies of RNA and DNA. [Google Scholar]
- 6.Woodson SA. Curr Opin Chem Biol. 2005;9:104. doi: 10.1016/j.cbpa.2005.02.004. [DOI] [PubMed] [Google Scholar]
- 7.Vieregg J, Cheng W, Bustamante C, Tinoco I., Jr J Am Chem Soc. 2007;129:14966. doi: 10.1021/ja074809o. [DOI] [PMC free article] [PubMed] [Google Scholar]
- 8.Phillips JC, Braun R, Wang W, Gumbart J, Tajkhorshid E, Villa E, Chipot C, Skeel RD, Kalé L, Schulten K. J Comput Chem. 2005;26:1781. doi: 10.1002/jcc.20289. [DOI] [PMC free article] [PubMed] [Google Scholar]
- 9.Mackerell AD, Bashford D, Bellott M, Dunbrack RL, Evanseck JD, Field MJ, Fischer S, Gao J, Guo H, Ha S. J Phys Chem B. 1998;102:3586. doi: 10.1021/jp973084f. [DOI] [PubMed] [Google Scholar]
- 10.Humphrey W, Dalke A, Schulten K. J Mol Graph. 1996;14:33. doi: 10.1016/0263-7855(96)00018-5. [DOI] [PubMed] [Google Scholar]
- 11.Pettersen EF, Goddard TD, Huang CC, Couch GS, Greenblatt DM, Meng EC, Ferrin TE. J Comput Chem. 2004;25:1605. doi: 10.1002/jcc.20084. [DOI] [PubMed] [Google Scholar]
- 12.Manning GS. Q Rev Biophys. 1978;11:179. doi: 10.1017/s0033583500002031. [DOI] [PubMed] [Google Scholar]
- 13.Heilman-Miller SL, Thirumalai D, Woodson SA. J Mol Biol. 2001;306:1157. doi: 10.1006/jmbi.2001.4437. [DOI] [PubMed] [Google Scholar]
- 14.Paliy M, Melnik R and Shapiro B 2009 in preparation
- 15.Hess B. Phys Rev E. 2000;62:8438. doi: 10.1103/physreve.62.8438. [DOI] [PubMed] [Google Scholar]
- 16.Hess B. Phys Rev E. 2002;65:031910. doi: 10.1103/PhysRevE.65.031910. [DOI] [PubMed] [Google Scholar]
- 17.Draper DE. RNA. 2004;10:335. doi: 10.1261/rna.5205404. [DOI] [PMC free article] [PubMed] [Google Scholar]
- 18.Hyeon C, Thirumalai D. Biophys J. 2007;92:731. doi: 10.1529/biophysj.106.093062. [DOI] [PMC free article] [PubMed] [Google Scholar]
- 19.Hyeon C, Dima RI, Thirumalai D. J Chem Phys. 2006;125:194905. doi: 10.1063/1.2364190. [DOI] [PubMed] [Google Scholar]
- 20.Rouzina I, Bloomfield VA. Biophys J. 1999;77:3242. doi: 10.1016/S0006-3495(99)77155-9. [DOI] [PMC free article] [PubMed] [Google Scholar]
- 21.Gu B, Zhang FS, Wang ZP, Zhou HY. Phys Rev Lett. 2008;100:088104. doi: 10.1103/PhysRevLett.100.088104. [DOI] [PubMed] [Google Scholar]
- 22.Kusalik PG, Svishchev IM. Science. 1994;265:1219. doi: 10.1126/science.265.5176.1219. [DOI] [PubMed] [Google Scholar]
- 23.Zhou J, Li Z, Sadus RJ. J Chem Phys. 2007;127:154509. doi: 10.1063/1.2786449. [DOI] [PubMed] [Google Scholar]
- 24.Halgren TA, Damm W. Curr Opin Struct Biol. 2001;11:236. doi: 10.1016/s0959-440x(00)00196-2. [DOI] [PubMed] [Google Scholar]
- 25.Patel S, Jr, ADM, CLB J Comput Chem. 2004;25:1504. doi: 10.1002/jcc.20077. [DOI] [PubMed] [Google Scholar]
- 26.Gresh N, Sponer JE, Spackova N, Leszczynski J, Sponer J. J Phys Chem B. 2003;107:8669. [Google Scholar]
- 27.Case DA, et al. AMBER 10. San Francisco, CA: University of California; 2008. http://amber.scripps.edu. [Google Scholar]
- 28.Tepper Y, Wu HL, Voth GA. J Chem Phys. 2006;124:024503. doi: 10.1063/1.2136877. [DOI] [PubMed] [Google Scholar]


