Abstract
Through restoration of the light source information in small animals in vivo, optical molecular imaging, such as fluorescence molecular tomography (FMT) and bioluminescence tomography (BLT), can depict biological and physiological changes observed using molecular probes. A priori information plays an indispensable role in tomographic reconstruction. As a type of a priori information, the sparsity characteristic of the light source has not been sufficiently considered to date. In this paper, we introduce a compressed sensing method to develop a new tomographic algorithm for spectrally-resolved bioluminescence tomography. This method uses the nature of the source sparsity to improve the reconstruction quality with a regularization implementation. Based on verification of the inverse crime, the proposed algorithm is validated with Monte Carlo-based synthetic data and the popular Tikhonov regularization method. Testing with different noise levels and single/multiple source settings at different depths demonstrates the improved performance of this algorithm. Experimental reconstruction with a mouse-shaped phantom further shows the potential of the proposed algorithm.
1. Introduction
In vivo small animal optical imaging has become an important tool of biological discovery and preclinical applications [1][2][3]. When mouse models are labeled using optical molecular probes, the probes acting as light sources, reflect corresponding biological information through the emission of visible or near infrared (NIR) light photons. Optical molecular imaging equipment is used to detect the photon distribution over the surface of the small animal to non-invasively investigate these models [4]. In recent years, planar optical molecular imaging, and more specifically bioluminescence imaging, has been extensively applied in tumorigenesis studies, cancer diagnosis, metastasis detection, drug discovery and development, and gene therapies given its convenience and ease operation [5][6]. The technology that is capable to acquire three dimensional information of the light sources will become a next generation instrument for optical molecular imaging. Bioluminescence tomography (BLT) is one such instrument being developed for this purpose [7].
An indispensable parameter for bioluminescence tomography is a priori information, which can be used to localize the optical sources. Theoretically, the source uniqueness proof gives us an important reference [8]. Practically, the richer the a priori information we apply, the further improvements BLT reconstruction can yield. Currently, three types of a priori information are verified and extensively applied in reconstruction algorithms. These include anatomical information [9][10], spectrally-resolved measurements [11][12][9][13], and the distribution of surface photons [14]. Anatomical information is used to assign relevant optical properties to organs. Spectrally resolved data considers the source spectrum and the tissue absorption and scattering characteristics. The use of these a priori information significantly improves source reconstruction. The temperature dependent source spectral shift has recently led to a temperature-modulated bioluminescence tomography method which uses a focused ultrasound array [15]. In principle, this should belong to spectrally-resolved a priori information. The a priori permissible source region is defined by the surface photon distribution and improves the reconstruction by constraining the permissible source position [14]. Overall, it is necessary to define additional a priori parameters for BLT reconstruction.
The diffusion approximation is extensively used in BLT reconstruction despite the fact that higher approximations of the radiative transfer equation lead to improved reconstructed results in some situations [16]. The finite element method (FEM), analytical formulations and Born approximation theory have been applied in combination with the diffusion equation [17]. The FEM has become popular due to its ability to process complex heterogeneous geometries. The adaptive strategy has also been developed to further improve the reconstruction based on the FEM [18][19]. In BLT, although nonlinear optimization strategies [20] used in diffuse optical tomography (DOT) and expectation maximization (EM) algorithms [9] similar with that in positron emission tomography (PET) are used, a linear least square (LS) problem is easily obtained because of the linear nature of the BLT problem [14]. Meanwhile, the inverse crime needs to be carefully considered especially when new algorithms are evaluated using synthetic data [21].
BLT reconstruction is an ill-posed problem. Inhibiting noise in measured data and reducing the ill-posedness is necessary to obtain BLT reconstructions. Regularization is a useful method for such problems. Currently, the weighted least square method is used to reduce the measured noise effects [22][14]. The Tikhonov regularization is a popular method and is extensively applied in BLT reconstruction [23][19]. Mathematically, the Tikhonov method is aiming to stabilize the inverse of an ill-conditioned operator by minimizing a trade-off between a loss function and the l2-norm of the signals. The advantage of the l2 norm is that the associated optimization problem can be efficiently solved using a classic quadratic minimization algorithm. The disadvantage is that the solution obtained is often smoothed everywhere, resulting the loss of high frequency structures of the original signal, especially in the case of noise. Over the past several years, the l1 norm regularization has been investigated in the signal and image processing fields, such as wavelet thresholding denoising [24], basis pursuit [25], and total variation for edge preserving reconstruction [26]. Moreover, a new sampling theory related to l1 minimization, known as compressed sensing (or compressed sampling) provides a strong theoretical foundation for sparse approximations [27][28]. More accurately, this theory allows an exact reconstruction from a greatly reduced number of measurements through the use of convex programming. In other words, if the real signals or images are sparse on some basis and the measurement operator and sparsity basis satisfy certain coherent conditions, then the original sparse signal can be reconstructed with a greatly reduced sampling rate. In BLT, the unknown sources are contained in the reconstructed domain (such as a mouse). Non-invasive measurements only acquire the surface distribution of photons emitted by bioluminescence sources. When using small elements (such as tetrahedron or hexahedron) to discretize the whole domain, the number of the surface discretized points is significantly fewer than that of the volumetric discretized points. The undersampling is inevitable for BLT reconstruction. Compared with single view measurements, multi-view data acquisition improves the BLT reconstruction to a certain degree [29][30], but it limits the high throughput ability of optical imaging. Single view measurements need to be further investigated for improved BLT reconstruction.
Fortunately, when we use optical probes to observe the specified biological process of interest, the domain of the light source is relatively small and sparse compared with the entire reconstruction domain, in this case the mouse body. Here, by a combination of this a priori information and compressed sensing theory, a novel spectrally-resolved bioluminescence reconstruction algorithm is proposed. Specifically, based on the diffusion approximation model, the linear relationship between the spectrally-resolved measured data and the unknown source distribution is established by using the FEM. The l1 norm as a regularization term is combined into the BLT least squares problem, realizing the compressed sensing method. In order to reduce memory and time cost, a limited memory variable metric optimization method is used to solve the bound-constrained BLT problem. In numerical verifications, the inverse crime is demonstrated for different synthetic data sets from different finite element meshes and different simulation methods, showing that the Monte Carlo method is necessary for accurate simulation tests. Furthermore, BLT reconstructions with different noise levels and different source depths demonstrate the usefulness of the compressing sensing method-based l1 norm regularization, especially for sources located deep within tissues and having high noise. Finally, the proposed algorithm is further tested by experimental reconstruction. In the next section, we present the spectrally-resolved BLT framework based on l1 regularization. In the third section, we evaluate the performance of the proposed algorithm with various source settings. In the final section, we discuss the relevant issues and conclusions. To the best of the authors knowledge, this contribution represents the first time that bioluminescence source sparse characteristic is used to improve BLT reconstruction with the compressed sensing method.
2. Model
2.1. Photon Diffusion Model
The available bioluminescence probes typically emit photons in the range of 400-800nm. The diffusion models as the P1 approximation to the radiative transfer equation have been extensively applied in bioluminescence imaging. As the optical properties of biological tissues change depending on the wavelength, the diffusion model is also a function of the wavelength. Assuming the bioluminescence source intensity is stable when photons are collected, the steady-state diffusion equation can be used to depict the photon propagation in tissues:
| (1) |
where Ω and λ is the domain and the wavelength respectively; Φ(r,λ) denotes the photon flux density; S(r,λ) is the source energy density; μa(r,λ) is the absorption coefficient; D(r,λ)=1/(3(μa(r,λ)+(1–g)μs(r,λ))) is the optical diffusion coefficient, μs(r,λ) the scattering coefficient, and g is the anisotropy parameter. On the boundary ∂Ω, the Robin boundary condition is used to depict the refractive index mismatch between the external medium n′ and Ω:
| (2) |
where v is the unit outer normal on ∂Ω. A(r;n,n′) can be approximately represented as:
| (3) |
where n′ is close to 1.0 when the mouse is in air; R(r) can be approximated by R(r) ≈ –1.4399n–2 + 0.7099n–1 + 0.6681 + 0.0636n [31]. When practical measurements are performed with a set of bandpass filters, the measured quantity is the outgoing flux density Q(r,λ) on the discretized wavelength λi, which is:
| (4) |
2.2. Linear Relationship Establishment
Based on the finite element theory [32], the weak solution of the flux density Φ(r,λi)∈H1(Ω) is given considering Eqs. (1) and (2) for a specified wavelength λi:
| (5) |
where ∀Ψ(r)∈H1(Ω), H1(Ω) is the Sobolev space, and Ψ(r) is an arbitrary piece-wise test function. In the numerical finite element computation, the domain Ω needs to be discretized into a group of small elements τ. Correspondingly in three dimensional computations, Ψ(r) is disretized as shape functions regarding the element τ. Tetrahedra and hexahedra are usually used as τ. Regardless of the specified element and shape function, we get the following finite element-based matrix form when the source term is unknown:
| (6) |
where λi, K(λi), C(λi) and B(λi) are called the mass, stiff and boundary matrix respectively. These are obtained from the first, second and third term in Eq. 5's right side [14]. Note that F(λi) can be flexibly selected depending on the choice of S(λi). Generally, we may select discretized elements or points as the unknown variables. Here, we use the point-based mode. When K(λi), C(λi) and B(λi) are summed as M(λi), we have:
| (7) |
Here, we consider the linear relationship between the unknown source variable S(λi) and the flux density Φb(λi) at the measurable boundary discretized points. can be adjustably obtained regarding the whole domain, or a priori or a posteriori permissible source region as unknown source region [19]. When the energy percentage of the wavelength λi is γi, we get:
| (8) |
where
| (9) |
Total energy S at all the wavelengths will be , where I is the total wavelength number.
2.3. Regularization
In optical tomographic imaging, the physical meaning of the various parameters and constraining minimization problem by optimization methods have significant impact on object reconstruction [33]. Therefore, for Eq. 8, we get the following constrained minimization problem for the measured signal Φmeas which corresponds to Φb:
| (10) |
where Ssup is a known upper bound vector and ∥ · ∥ denotes l2 norm of a vector. If we ignore the constraints, this also corresponds to solving the normal equation
When the spectrum of the operator is unbounded or ill-conditioned, the inverse of this equation can cause severe numerical instabilities. A standard procedure is to integrate a priori information in the solution, called regularization. For example, the simplest Tikhonov regularization consists of adding a l2 norm penalty term to the l2 loss functional, i. e.
| (11) |
where Δ is a positive number called the regularization parameter which is used to balance the fidelity term and the regularization term. The related gradient of the objective function of Eq. 11 is written as:
This quadratic functional can be efficiently solved by a large range of convex programming technique.
However, this quadratic stabilizer intends to recover a smoothed version of S independent of the data structure. It is often incapable of recovering local singularities or discontinuities presented in the object in the case of noise. We are now considering a non-quadratic lp norm penalty where 1 ≤ p < 2, since the functional ceases to be convex if p < 1. The main advantage of the non quadratic norm is to promote the sparsity of the solution. Roughly speaking, when p → 1, large components of S are less penalized when compared to the quadratic norm. However, the sum of small components are more penalized, thus leading to a sparse solution. In BLT, an important a priori information is the sparsity of the light source, therefore l1 regularization is a more natural choice for this ill posed inverse problem. It follows the model:
| (12) |
where ∥S∥1 = Σi|Si| denotes the l1 of the vector S. Since this functional is non-differentiable, we can use a differentiable approximation defined as [40] defined as
where ε is a small positive number.
2.4. Algorithm
Through minimizing the objective function Θ(S), BLT reconstruction can be obtained. Θ(S) is a typical bound-constrained regularization-based least square problem. For the constraint problem, an active-set strategy which includes several types of Hessian matrix based optimization algorithms is adopted to obtain a desirable reconstruction [14][19]. Although this least square problem easily obtains the Hessian matrix, it requires a significant amount of memory during the optimization procedure, especially for large-scale problems. In addition, when computing the search direction, it is necessary to invert the Hessian matrix, which is time-consuming and severely affects the speed of BLT reconstruction. One solution is to use quasi-Newton methods. Generally, these build up an approximate Hessian matrix by using gradients and iteration algorithms. This approximate matrix is obtained in real-time by vector-vector multiplications and is easy to invert, saving memory and time requirements. Here, the limited memory variable metric bound constrained quasi-Newton method (BLMVM) [34] is used for BLT reconstruction. The detailed algorithm is shown in Algorithm 1.
| Algorithm 1 Regularization-based BLMVM algorithm for BLT reconstruction | |
|---|---|
| . | |
| 1: | for k = 0 to kmax do |
| 2: | Compute αk using a projected line search. |
| 3: | . |
| 4: | . |
| 5: | |
| 6: | Stop. |
| 7: | else |
| 8: | . |
| 9: | |
| 10: | Update Hk by Eq. 15. |
| 11: | end if |
| 12: | Compute Hk+1∇Θ(Sk+1) using the L-BFGS two-loop recursion. |
| 13: | |
| 14: | d = –Hk+1∇Θ(Sk+1). |
| 15: | else |
| 16: | d = –∇Θ(Sk+1). |
| 17: | end if |
| 18: | end if |
| 19: | end for |
Specifically, an initial guess S0 for the source distribution should be given and the initial searching direction d0 is also provided. Here, the operator is defined as
| (13) |
where d(j),S(j) denotes the j-th element of d and S respectively. When the step size αk is determined, the iterative solution at the next step Sk+1 can be calculated through the projection operator onto the box constraint, defined as
| (14) |
During the minimization procedure, the approximation Hk+1 of the inverse Hessian matrix at the next step is updated when
where , I is the identity matrix. Since the inverse Hessian matrix is usually dense, the memory and time requirements for processing Hk is prohibitive especially for large scale problems. In the BLMVM algorithm, a limited memory BFGS matrix is obtained by the vector pairs from the last m iterations. Given an initial inverse Hessian approximation , the updated matrix Hk is obtained
| (16) |
3. Results
3.1. Simulation Verifications
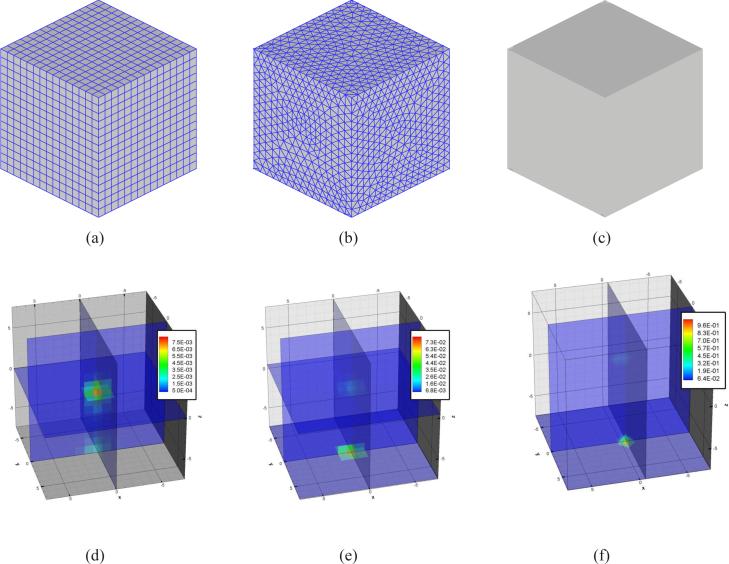
Much attention should always be given to the inverse crime when new algorithms are verified using synthetic data. Monte Carlo methods can simulate the photon propagation better given the ability to incorporate Poisson noise in the simulation. In addition, the same discretized modes used in the forward simulation and inverse reconstruction will significantly affect the evaluation. A cubic domain with a width of 15mm was used to confirm these effects. The synthetic data was obtained through three types of modes, which are hexahedra- and tetrahedra-based FEM, and Monte Carlo method. The diffusion approximation equation was used in the FEM-based simulation. The same discretization with hexahedra-based simulation was used in BLT reconstruction and its element size was 1.0mm in width. The average element diameter in tetrahedra-based discretization was also 1.0mm. Figures 1(a) and 1(b) show the discretized meshes. In reconstruction, three wavelengths (600nm, 650nm and 700nm) were used to obtain spectrally-resolved measurements. We refer to the literature [9] to obtain the corresponding optical properties as listed in Table 1. Photon attenuation is approximately an exponential function of the effective attenuation coefficient . In order to preserve the noise effect for all the wavelengths, we sampled 107 photons for 600nm and half the number of these photons were used at two other wavelengths. Monte Carlo simulation is severely time-consuming. To accelerate the simulation, MPI-based parallel code based on the Molecular Optical Simulation Environment (MOSE) [35] was developed in order to perform spectrally-resolved simulations. Because the parallel program only records the information of the photons emitted through the boundary, we can consider that the cubic domain used in the MC method is not discretized, as shown in Fig. 1(c).
Fig. 1.
Verification to the inverse crime problem. The discretizations of the cubic domain in Figs. (a), (b) and (c) were used to generate the synthetic data using the finite element method (Figs. (a) and (b)) and Monte Carlo method (Fig. (c)). Figures (d), (e) and (f) are the reconstructed results respectively when the real source central position is at (0.0,0.0,0.0). The synthetic data on the top surface is used in reconstruction.
Table 1.
Optical property at three wavelengths for cubic phantom in simulation verifications
| Wavelength | 600nm | 650nm | 700nm |
|---|---|---|---|
| μa(λi)[mm–1] | 0.19 | 0.038 | 0.022 |
| 1.66 | 1.53 | 1.41 |
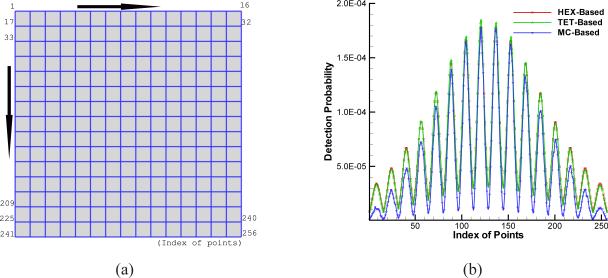
When generating the synthetic data, a cubic source with a width of 1mm was placed at the center of the cubic domain. The source intensity at every wavelength was set to “1.0”. In the reconstruction, we used the synthetic data on the top surface, while the additional noise was not considered. Additionly, regularization methods were not used. Based on three different types of synthetic data, the reconstructed results are shown in Figs. 1(d) to 1(f). When using the hexahedral mesh, the same mathematical model and discretized mesh were used in synthetic data generation and reconstruction. Although there are some artifacts in the reconstructed results, the source position is well localized, as seen in Fig. 1(d). However, when the tetrahedral-based synthetic data is used, the reconstructed results become inaccurate. Also, in Fig. 1(e), it is observed that there are some reconstructed results below the actual source position. MC-based reconstructed results in Fig. 1(f) are similar with those based on the tetrahedral mesh. The difference is that the reconstruction around the actual source position becomes increasingly obscure and its position is proximal to the top surface. Actually, the use of different simulation methods results in different levels of noise in the synthetic data, affecting the reconstructed results. Therefore, the synthetic data results are compared in terms of the three different methods and the results are shown in Fig. 2(b). We can find the Hex- and Tet-based synthetic data is almost the same. The maximal relative error (RE) (RE = (ΦTet – ΦHex)/ΦHex) between them is only 10.4%. However, these errors introduce significant effects during reconstruction, showing the ill-posedness of the BLT problem and the necessity of regularization. Furthermore, we can see there are large errors between the Hex- and MC-based data especially when the discretized points are far from the center. It is clear that this produces the poor reconstructed results. From another aspect, it is necessary to use the MC-based synthetic data for testing the proposed algorithm due to its precise simulation and the inverse crime problem. Note that for convenient comparison the MC-based data is normalized using the Hex-based data based on its respective maximal flux density.
Fig. 2.
Quantitative comparison between HEX-, TET- and MC-based synthetic data at 650nm
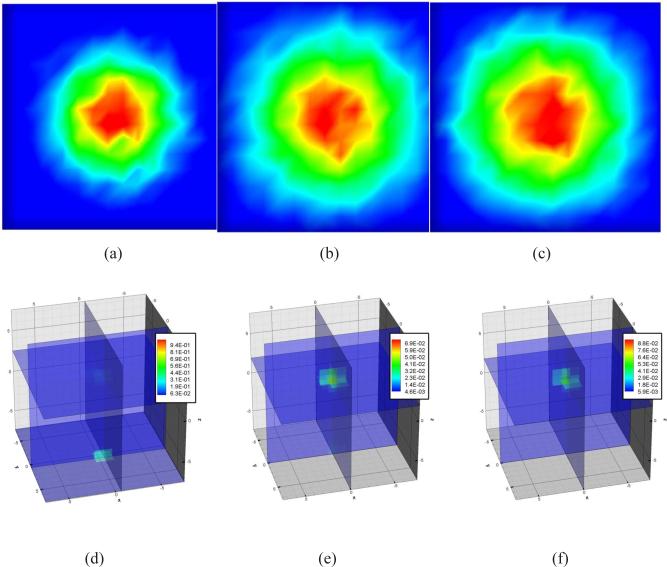
With the MC-based synthetic data, the proposed algorithm is verified. For each method, we present our results with an optimal parameter Δ chosen from a series of values. Generally, based on the reconstruction experience, the ranges of l1 and l2 parameters are from 10–7 to 10–4 and from 10–6 to 10–3 respectively. The regularization parameters become larger along with the noise increase. In the single source case, we use the same settings with those used in the inverse crime evaluations and reduce the simulated photon number to 106 at 600nm. Figs. 3(a) to 3(c) show the photon distribution on the top surface of the cubic domain at three wavelengths. It is obvious that they are different because of the effect of the optical properties at different wavelengths. When regularization methods are not used in the reconstruction, we get similar reconstructed results as in Fig. 1(f), and which are shown in Fig. 3(d). We cannot accurately localize the source position. Figure 3(e) shows the reconstructed results when the l2 regularization method is used. The center position of the reconstructed source is at (0.0,0.0,1.5). Due to the effect of the noise on the source depth information contained in the synthetic data, there is an 1.5mm error in depth localization. Similar localization information is obtained when the l1 regularization is used. Both of the regularization-based BLT reconstructions show good source localization when compared with and without regularization.
Fig. 3.
BLT reconstructions when the real source central position is at (0.0,0.0,0.0) and 106 photons are tracked to generate the synthetic data at 600nm. Figures (a), (b) and (c) are the photons distribution at 600nm, 650nm and 700nm. Figures (d), (e) and (f) are the reconstructed results without regularization method and with l2 and l1 methods.
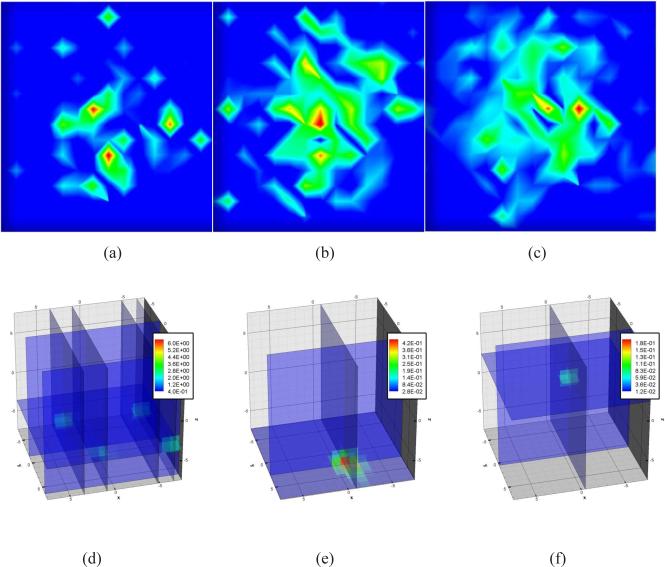
When we reduce the tracking photons number to 104, figures 4(a) to 4(c) show the photon distribution on the top surface. Because few photons are emitted through the boundary, high Poisson noise exists in the synthetic data. It is difficult to distinguish the difference between the three wavelengths. When no regularization method is used, we obtain a degraded reconstruction, which is shown in Fig. 4(d), compared with that obtained by 106 photons. Even if the l2 regularization is used, we cannot always accurately localize the source position using the reconstructed results (Fig. 4(e)) no matter how the regularized parameter is adjusted. When the l1 regularization is used, a similar reconstruction, as shown in Fig. 4(f) as that with 106 photons is obtained. Due to the higher noise level, the center of the reconstructed source is at (0.0,0.0,2.0) and the localization errors further are increased further. However, compared with the l2 regularization, the l1 method shows improvement especially when the source is at a deeper position and high noise exists in the measured data.
Fig. 4.
BLT reconstructions when the real source central position is at (0.0,0.0,0.0) and 104 photons are tracked to generate the synthetic data at 600nm. Figures (a), (b) and (c) are the photons distribution at 600nm, 650nm and 700nm. Figures (d), (e) and (f) are the reconstructed results without regularization method and with l2 and l1 methods.
3.1.2. Dual Source Cases with the Homogeneous Media
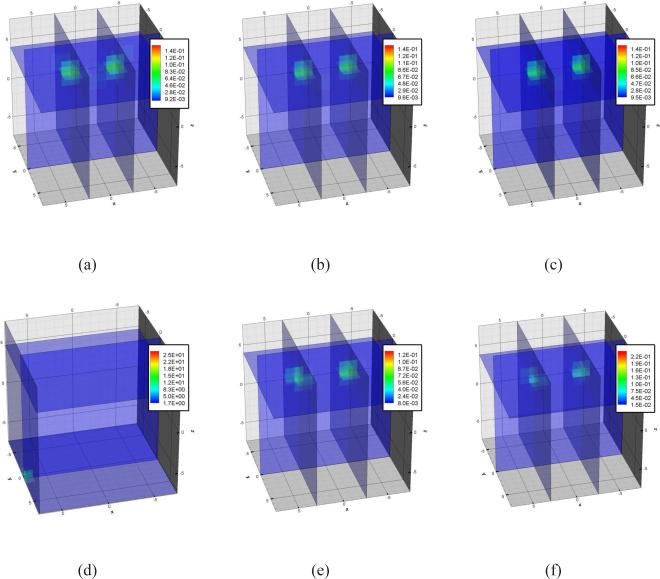
In this simulated reconstruction, dual source settings are considered in order to evaluate the l1 regularization method. Both sources have the same settings as those used in the single source cases and are placed at (–3.0,0.0,3.0) and (3.0,0.0,3.0) respectively. First, 106 photons are tracked at 600nm for each source. Since the sources are close to the top surface and many photons can be captured, we obtain good reconstructed results without regularization, which is shown in Fig. 5(a). The center positions of the reconstructed sources are (–2.5,0.0,3.5) and (2.5,0.0,3.5). Note that even if we set the regularization parameters with the l2 and l1 methods, similar results (Figs. 5(b) and 5(c)) are obtained with those without regularization, illustrating the robust nature of the regularization methods. When the photon number reduces to 104, the reconstructed results are shown in Figs. 5(d) to 5(f). Obviously, without regularization, we cannot obtain accurate source localization due to the high noise in the synthetic data. The l2- and l1-based reconstructions show similar source localization with those using 106 photons. Note that these reconstructions are similar to those in the single source case with 106 photons. In other words, more photons are required for BLT reconstruction with multiple sources compared with single sources. This is true even if these sources are closer to the measured surface than the latter case.
Fig. 5.
Dual source BLT reconstructions when the real source central positions is at (–3.0,0.0,3.0) and (3.0,0.0,3.0). Figures (a), (b) and (c) are the corresponding reconstructed results without regularization and with l2 and l1 methods when 106 photons are tracked at 600nm. Figures (d), (e) and (f) are the counterparts corresponding to (a), (b) and (c) when 104 photons are tracked at 600nm.
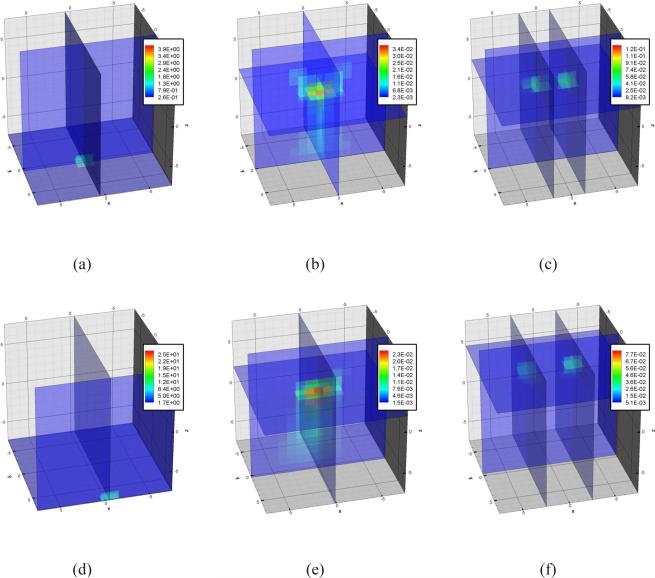
When the two sources are moved to (–3.0,0.0,0.0) and (3.0,0.0,0.0), Figures 6(a) to 3(f) show the reconstructed results when 106 photons are tracked. We cannot distinguish the source position accurately without regularization and with the l2 method, although the lower values in the latter BLT reconstruction show that there are two sources. In contrast, two sources can be distinguished from the reconstruction with the l1 method despite the fact that the localization errors (the reconstructed center positions are (–2.0,0.0,2.5) and (2.0,0.0,2.5)), are bigger than those in the single source case (Fig. 3(f)). Based on the synthetic data with 104 photons, the reconstruction results are shown in Figs. 6(d) to 4(f). Due to the higher noise, we can't distinguish two sources (Fig. 4(e)) in the l2-based reconstruction, or without regularization (Fig. 4(d)). Surprisingly, two sources can be distinguished in the l1-based reconstruction. However, the localization errors become bigger than those in the 106 photon case.
Fig. 6.
Dual source BLT reconstructions when the real source central positions is at (–3.0,0.0,0.0) and (3.0,0.0,0.0). Figures (a), (b) and (c) are the corresponding reconstructed results without regularization and with l2 and l1 methods when 106 photons are tracked at 600nm. Figures (d), (e) and (f) are the counterparts corresponding to (a), (b) and (c) when 104 photons are tracked at 600nm.
3.1.3. Dual Source Cases with the Heterogeneous Media
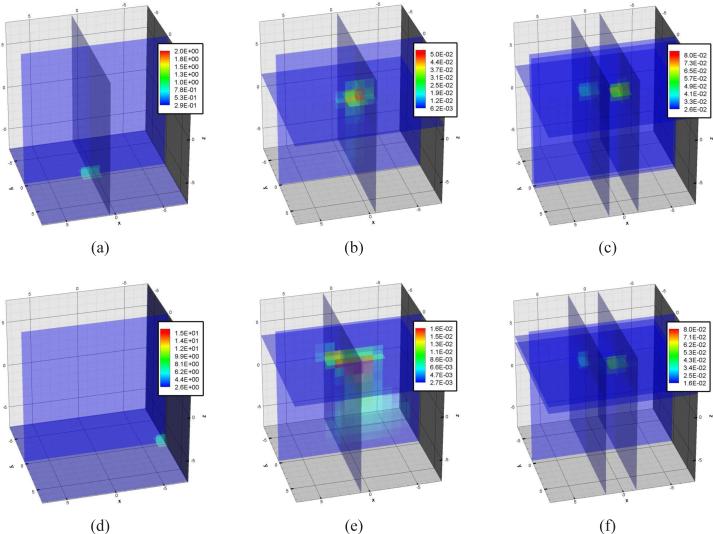
Furthermore, heterogeneous BLT reconstructions with dual source settings are performed. Two sources are placed at (–3.0,0.0,0.0) and (3.0,0.0,0.0) respectively. The heterogeneous characteristics of the domain are realized by placing a 5×5×5 cube within the homogeneous domain. The center of this cube is the same as that of the source at (–3.0,0.0,0.0). The absorption and reduced scattering coefficients at three wavelengths are set to 0.038 and 1.82, 0.015 and 1.73, and 0.004 and 1.57 respectively. When 106 photons are used to generate the measured data at 600nm, the reconstructed results are shown in Figs. 7(a) to 7(c). They are similar with the BLT reconstructions in the homogeneous domain and two sources can not be distinguished without regularization and with the l2 method. When the l1 regularization is used, the reconstructed results have little difference between using heterogeneous and homogeneous domains, as shown in Figs. 6(c) and 7(c). Due to the heterogeneous media characteristics, the reconstructed positions become (–1.5,0.45,2.55) and (1.5,–0.45,2.55) respectively. Although the depth localization is similar in heterogeneous and homogeneous domains, the reconstructed precisions at X and Y directions become worse. When the photon number is reduced to 104, the reconstructed results are shown in Figs. 7(d) to 7(f). Note that the depth localization is improved with the l1 regularization due to the heterogeneous media characteristics, and the reconstructed positions are (–1.35,–0.6,2.7) and (1.8,–0.6,3.45). With the reduced number of photons, the heterogeneous characteristics improve the reconstruction precision.
Fig. 7.
Dual source BLT reconstructions with the heterogeneous media when the real source central positions is at (–3.0,0.0,0.0) and (3.0,0.0,0.0). Figures (a), (b) and (c) are the corresponding reconstructed results without regularization and with l2 and l1 methods when 106 photons are tracked at 600nm. Figures (d), (e) and (f) are the counterparts corresponding to (a), (b) and (c) when 104 photons are tracked at 600nm.
3.1.4. Multiple Source Cases
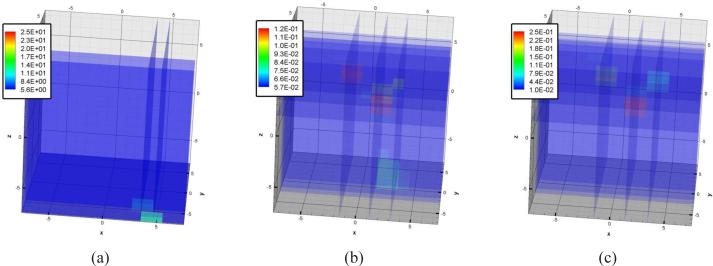
With respect to different source intensities, three sources with different depths are set in the homogeneous domain to test the l1-based reconstruction method. Their positions and intensities are (–2.0,2.0,4.0) and 1.0, (0.0,0.0,0.0) and 5.0, and (3.0,–3.0,2.0) and 3.0 respectively. In this simulation, 104 photons are tracked at 600nm. The reconstructed results are shown in Figs. 8(a) to 8(c). Without regularization methods, the three sources cannot be distinguished (Fig. 8(a)). When the l2 and l1 methods are used, the three sources can be distinctly distinguished. However, overall there is a coupling between the source depth and intensity, and the source depth localizations become worse, while the source intensities cannot be reconstructed accurately. When comparing the reconstructed results based on the l2 and l1 methods, there is an artifact in the l2-based reconstruction, which is shown in Fig. 8(b). To obtain good source depth and intensity reconstruction, more sophisticated l1-based reconstruction algorithms should be developed.
Fig. 8.
Triple source BLT reconstructions with the homogeneous media when the real source central positions is at (–2.0,2.0,4.0), (0.0,0.0,0.0), and (3.0,–3.0,2.0). Figures (a), (b) and (c) are the corresponding reconstructed results without regularization and with l2 and l1 methods when 104 photons are tracked at 600nm.
3.2. Experimental Data Reconstructions
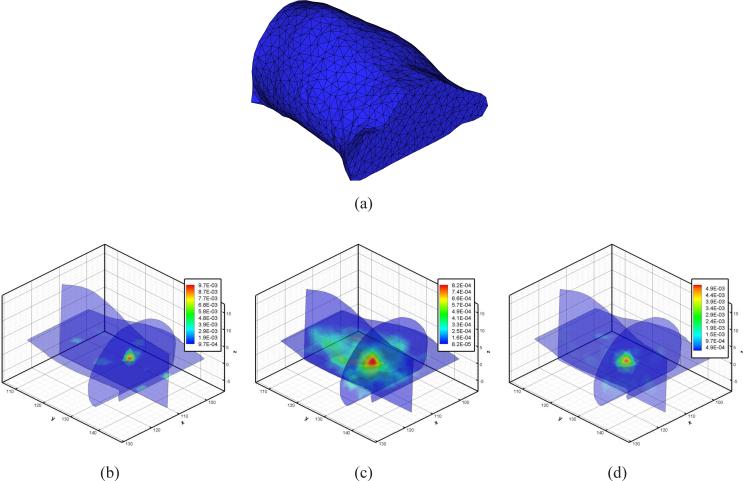
In order to test the spectrally-resolved l1-based BLT reconstruction algorithm, a commercially available solid mouse shaped homogeneous phantom was used. This phantom was fabricated with a polyester resin, TiO2 and Disperse Red. Table 2 shows the optical properties (μa and ) at six wavelengths measured with the inverse adding doubling method [36]. To imitate the bioluminescence source, an optical fiber coupled to a green LED was embedded within the phantom. The emission spectrum of the LED (wavelength range was from 500nm to 700nm and the peak was at about 567nm) was similar to that of a bioluminescence source. More detailed information about this phantom can be obtained elsewhere in [22]. To acquire the shape of this phantom and localize the source position, an Imtek microCAT system (Siemens Preclinical Solutions, Knoxville, TN) was used. Since the diameter of the optical fiber was only 200μm, the source could be considered as a point source. GFP (515–575nm) and DsRed (575–650nm) emission filters were used to acquire the spectrally-solved measured data. In the reconstruction, the optical properties at 560nm were used for the GFP filter-based data. The averaged μa and from 580nm to 660nm (0.013mm–1 and 1.68mm–1) was considered for the DrRed filter-based measurement. To avoid the effects of the curved surface in the measured data, the photon distribution was obtained from the bottom surface of the phantom in a Caliper IVIS 100 imaging system (Caliper Life Sciences Alameda, CA). Using the commercial software Amira 3.0 (Mercury Computer Systems, Inc. Chelmsford, MA), the tetrahedral-based finite element volumetric mesh shown in Fig. 10(a) for reconstruction was generated based on the CT images. With respect to the photons distribution, about 2/3 of the whole phantom was selected for mesh generation. The mesh had the average element diameter of 3.0mm and included 1929 nodes and 7766 elements. The measured data was manually registered using the simultaneously obtained photograph in Amira.
Table 2.
Optical properties of Caliper mouse phantom at six wavelengths
| Wavelength | 560nm | 580nm | 600nm | 620nm | 640nm | 660nm |
|---|---|---|---|---|---|---|
| μa(λi)[mm–1] | 0.091 | 0.038 | 0.015 | 0.006 | 0.004 | 0.0043 |
| 1.88 | 1.82 | 1.73 | 1.66 | 1.57 | 1.46 |
Fig. 10.
Experimental BLT reconstructions with mouse-shaped phantom. Figure (a) are the volumetric mesh used in reconstruction. Figures (b), (d) and (d) show the reconstructed results without regularization and with l2 and l1 methods.
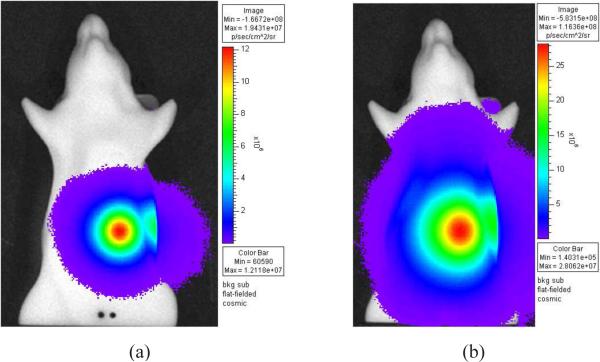
The photon distributon for 2 minute acquisitions using two types of filters is shown in Fig. 9. Since the optical properties at two wavelength ranges are different, we can clearly observe the difference in the photon distribution. Using the CT images, the actual source position was localized at (114.5,131.0,3.0). When the BLT reconstruction without regularization was performed, the reconstructed results are shown in Fig. 10(b), indicating a distributed source. The difference between the corresponding maximal values in several distributed regions is small. When the maximal reconstructed values are used to decide the reconstructed position, its center is localized at (111.7,132.6,2.7). Overall, there are large reconstruction errors especially along X-axis direction. When the l2 regularization-based reconstruction was performed, the reconstructed results are shown in Fig. 10(c). Due to the smoothness function of the l2 regularization, the whole reconstructed region is almost filled by the values close to the maximal. However, the center position of the reconstructed results is easily localized at (115.1,131.7,2.4). The errors at three axes are 0.6, 0.7, 0.6 compared with the actual position. Compared with the reconstruction without regularization, this localization is better. Figure 10(d) shows the reconstructed results with l1 regularization, and the reconstructed position (114.7,131.7,2.9) is similar with that based on l2 method. However, the reconstructed results are compact, which shows that the BLT reconstruction is significantly improved when sparse a priori information is used.
Fig. 9.
Surface radiance images of the mouse-shaped phantom with embedded fiber optic source using GFP and DsRed emission filters.
4. Conclusion
In this paper, a spectrally-resolved l1 regularization based reconstruction algorithm is proposed. Based on the linear relationship between the unknown source variable and the boundary measurements, the spectrally-resolved information is used to improve BLT reconstruction. Sparse source characteristics are considered in a graceful way along with the l1 regularization method. The use of quasi-Newton optimization methods accelerates the BLT reconstruction. Simulation verifications with MC-based synthetic data show that the use of the sparse a priori information significantly improves the BLT reconstruction compared with the popular l2 regularization. Particularly the case when the sources exist at deeper positions and the measured data contains high noise, the l1-based methods are necessary to obtain improved location reconstruction. Reconstruction of experimental data further shows the effectiveness of the proposed algorithm.
In BLT reconstruction, it is vital to solve the ill-posed and unique problems. Regularization and a priori information significantly improve the reconstruction. From the results obtained here, reconstruction without regularization is not stable. Although l2 regularization improves performance, its smooth characteristic is not apropriate for the BLT problem. Since the l1 regularization considers sparse information, it is more suitable for BLT reconstruction especially when multiple sources exist. Note that to strictly meet the condition of compressed sensing theory, signal incoherence should be considered further. In practice, for a more general inverse problem, it is not simple to check the incoherence condition. Perfect matching between theory and practice is limited in some simple cases [37]. It is still standard to use a nonquadratic norm to promote sparsity, roughly speaking, for most large under-determined systems of linear equations, the minimal of l1 norm solution is also the sparsest solution [38]. Fortunately, the improved reconstructed results show the inherent characteristics of BLT problem can meet the compressed sensing theory to a certain extent.
Although in vivo mouse BLT reconstructions with the diffusion approximation theory obtain good results, the nature of photon propagation in biological tissues demonstrates that more precise mathematical models should be considered for the BLT problem when the bioluminescence source is in or close to specific tissues. Several improved models have been proposed to improve the reconstruction quality [16][39]. Since BLT reconstruction is a linear inverse source problem in nature, as a regularization method, the l1 method can be used in improved precise model based reconstructions.
In conclusion, we have developed a spectrally-resolved compressed sensing based reconstruction method for BLT, obtained encouraging preliminary results in both numerical simulations and physical phantom experiments, and established that our proposed method is effective for BLT. In vivo mouse studies using the proposed method will be reported in the future.
Acknowledgement
We gratefully thank Dr. Richard Taschereau for his useful discussion about parallel Monte Carlo method. This work is supported by the NIBIB R01-EB001458, NIH/NCI 2U24 CA092865 cooperative agreement, DE-FC02-02ER63520 grants, NSF DMS 0312222, ONR N00014-06-1-0345, NSF CCF-0528583 and the Project for the National Basic Research Program of China (973) under Grant No. 2006CB705700.
Footnotes
OCIS codes: (110.6960) Tomography; (170.3010) Image reconstruction techniques; (170.6280) Spectroscopy, fluorescence and luminescence.
References and links
- 1.Weissleder R, Mahmood U. Molecular imaing. Radiology. 2001;219:316–333. doi: 10.1148/radiology.219.2.r01ma19316. [DOI] [PubMed] [Google Scholar]
- 2.Ntziachristos V, Ripoll J, Wang LV, Weisslder R. Looking and listening to light: the evolution of whole body photonic imaging. Nat. Biotechnol. 2005;23:313–320. doi: 10.1038/nbt1074. [DOI] [PubMed] [Google Scholar]
- 3.Willmann JK, van Bruggen N, Dinkelborg LM, Gambhir SS. Molecular imaging in drug development. Nat. Rev. Drug Discovery. 2008;7:591–607. doi: 10.1038/nrd2290. [DOI] [PubMed] [Google Scholar]
- 4.Contag CH, Bachmann MH. Advances in bioluminescence imaging of gene expression. Annu. Rev. Biomed. Eng. 2002;4:235–260. doi: 10.1146/annurev.bioeng.4.111901.093336. [DOI] [PubMed] [Google Scholar]
- 5.Bhaumik S, Gambhir SS. Optical imaging of renilla luciferase reporter gene expression in living mice. Proc. Natl. Acad. Sci. USA. 2002;99:377–382. doi: 10.1073/pnas.012611099. [DOI] [PMC free article] [PubMed] [Google Scholar]
- 6.Massoud TF, Gambhir SS. Molecular imaging in living subjects: seeing fundamental biological processes in a new light. Genes Dev. 2003;17:545–580. doi: 10.1101/gad.1047403. [DOI] [PubMed] [Google Scholar]
- 7.Wang G, Hoffman EA, McLennan G, Wang LV, Suter M, Meinel JF. Development of the first bioluminescence CT scanner. Radiology. 2003;566:229. [Google Scholar]
- 8.Wang G, Li Y, Jiang M. Uniqueness theorems in bioluminescence tomography. Med. Phys. 2004;31:2289–2299. doi: 10.1118/1.1766420. [DOI] [PubMed] [Google Scholar]
- 9.Alexandrakis G, Rannou FR, Chatziioannou AF. Tomographic bioluminescence imaging by use of a combined optical-PET (OPET) system: a computer simulation feasibility study. Phys. Med. Biol. 2005;50:4225–4241. doi: 10.1088/0031-9155/50/17/021. [DOI] [PMC free article] [PubMed] [Google Scholar]
- 10.Lv Y, Tian J, Cong W, Wang G. Experimental study on bioluminescence tomography with multimodality fusion. Int. J. Biomed. Img. 2007;1:86741. doi: 10.1155/2007/86741. [DOI] [PMC free article] [PubMed] [Google Scholar]
- 11.Kuo C, Coquoz O, Stearns DG, Rice BW. Proceedings of the 3rd International Meeting of the Society. MIT Press; 2004. Diffuse luminescence imaging tomography of in vivo bioluminescent markers using multi-spetral data; p. 227. [Google Scholar]
- 12.Chaudhari AJ, Darvas F, Bading JR, Moats RA, Conti PS, Smith DJ, Cherry SR, Leahy RM. Hyperspectral and multispectral bioluminescence optical tomography for small animal imaging. Phys. Med. Biol. 2005;50:5421–5441. doi: 10.1088/0031-9155/50/23/001. [DOI] [PubMed] [Google Scholar]
- 13.Dehghani H, Davis SC, Jiang S, Pogue BW, Paulsen KD, Patterson MS. Spectrally resolved bioluminescence optical tomography. Opt. Lett. 2006;31:365–367. doi: 10.1364/ol.31.000365. http://www.opticsinfobase.org/abstract.cfm?URI=ol-31-3-365. [DOI] [PubMed]
- 14.Cong W, Wang G, Kumar D, Liu Y, Jiang M, Wang LV, Hoffman EA, McLennan G, McCray PB, Zabner J, Cong A. Practical reconstruction method for bioluminescence tomography. Opt. Express. 2005;13:6756–6771. doi: 10.1364/opex.13.006756. http://www.opticsinfobase.org/oe/abstract.cfm?URI=oe-13-18-6756. [DOI] [PubMed]
- 15.Wang G, Shen H, Cong W, Zhao S, Wei G. Temperature-modulated bioluminescence tomography. Opt. Express. 2006;14:7852–7871. doi: 10.1364/oe.14.007852. http://www.opticsinfobase.org/abstract.cfm?URI=oe-14-17-7852. [DOI] [PubMed]
- 16.Klose AD, Ntziachristos V, Hielscher AH. The inverse source problem based on the radiative transfer equation in optical molecular imaging. J. Comput. Phys. 2005;202:323–345. [Google Scholar]
- 17.Gibson AP, Hebden JC, Arridge SR. Recent advances in diffuse optical imaging. Phys. Med. Biol. 2005;50:R1–R43. doi: 10.1088/0031-9155/50/4/r01. [DOI] [PubMed] [Google Scholar]
- 18.Lv Y, Tian J, Cong W, Wang G, Luo J, Yang W, Li H. A multilevel adaptive finite element algorithm for bioluminescence tomography. Opt. Express. 2006;14:8211–8223. doi: 10.1364/oe.14.008211. http://www.opticsinfobase.org/abstract.cfm?URI=oe-14-18-8211. [DOI] [PubMed]
- 19.Lv Y, Tian J, Cong W, Wang G, Yang W, Qin C, Xu M. Spectrally resolved bioluminescence tomography with adaptive finite element analysis: methodology and simulation. Phys. Med. Biol. 2007;52:4497–4512. doi: 10.1088/0031-9155/52/15/009. [DOI] [PubMed] [Google Scholar]
- 20.Gu X, Zhang Q, Larcom L, Jiang H. Three-dimensional bioluminescence tomography with model-based reconstruction. Opt. Express. 2004;12:3996–4000. doi: 10.1364/opex.12.003996. http://www.opticsinfobase.org/oe/abstract.cfm?URI=oe-12-17-3996. [DOI] [PubMed]
- 21.Holder S. Electrical Impedance Tomography. Institute of Physics Publishing; Bristol and Philadelphia: 2005. [Google Scholar]
- 22.Kuo C, Coquoz O, Troy TL, Xu H, Rice BW. Three-dimensional reconstruction of in vivo biolumines-cent sources based on multispectral imaging. J. Biomed. Opt. 2007;12:024007. doi: 10.1117/1.2717898. [DOI] [PubMed] [Google Scholar]
- 23.Cong W, Durairaj K, Wang LV, Wang G. A Born-type approximation method for bioluminescence tomography. Med. Phys. 2006;33:679–686. doi: 10.1118/1.2168293. [DOI] [PubMed] [Google Scholar]
- 24.Donoho D, Johnstone I. Ideal spatial adaption via wavelet shrinkage. Biometrika. 1994;81:425–455. [Google Scholar]
- 25.Mallat SG, Zhang Z. Matching pursuits with time-frequency dictionaries. IEEE Trans. Signal Process. 2002;41:3397–3415. [Google Scholar]
- 26.Rudin L, Osher S, Fatemi E. Nonlinear total variation based noise removal algorithms. J. Phys. D. 1992;60:259–268. [Google Scholar]
- 27.Candès EJ, Romberg JK, Tao T. Stable signal recovery from incomplete and inaccurate measurements. Commun. Pur. Appl. Math. 2006;59:1207–1223. [Google Scholar]
- 28.Candès EJ. Compressive sampling. Proceedings of the International Congress of Mathematicians, Madrid, Spain. 2006;3:1433–1452. [Google Scholar]
- 29.Kuo C, Coquoz O, Troy T, Zwarg D, Rice B. Bioluminescent tomography for in vivo localization and quantification of luminescent sources from a multiple-view imaging system. Mol. Img. 2005;4:370. [Google Scholar]
- 30.Wang G, Shen H, Durairaj K, Qian X, Cong W. The first bioluminescence tomography system for simultaneous acquisition of multiview and multispectral data. Int. J. Biomed. Img. 2006 doi: 10.1155/IJBI/2006/58601. 2006:Article ID 58601. [DOI] [PMC free article] [PubMed] [Google Scholar]
- 31.Schweiger M, Arridge SR, Hiraoka M, Delpy DT. The finite element method for the propagation of light in scattering media: Boundary and source conditions. Med. Phys. 1995;22:1779–1792. doi: 10.1118/1.597634. [DOI] [PubMed] [Google Scholar]
- 32.Rao SS. The finite element method in engineering. Butterworth-Heinemann; Boston: 1999. [Google Scholar]
- 33.Roy R, Sevick-Muraca EM. Active constrained truncated newton method for simple-bound optical tomography. J. Opt. Soc. Am. A. 2000;17:1627–1641. doi: 10.1364/josaa.17.001627. http://www.opticsinfobase.org/abstract.cfm?URI=josaa-17-9-1627. [DOI] [PubMed]
- 34.Benson SJ, Moré J. Technical Report ANL/MCS-P909-0901. Mathematics and Computer Science Division, Argonne National Laboratory; 2001. A limited-memory variable-metric algorithm for bound-constrained minimization. [Google Scholar]
- 35.Li H, Tian J, Zhu F, Cong W, Wang LV, Hoffman EA, Wang G. A mouse optical simulation enviroment (MOSE) to investigate bioluminescent phenomena in the living mouse with the Monte Carlo Method. Acad. Radiol. 2004;11:1029–1038. doi: 10.1016/j.acra.2004.05.021. [DOI] [PubMed] [Google Scholar]
- 36.Prahl SA, van Gemert MJC, Welch AJ. Determining the optical properties of turbid mediaby using the addingdoubling method. Appl. Opt. 1993;32:559–568. doi: 10.1364/AO.32.000559. http://www.opticsinfobase.org/abstract.cfm?URI=ao-32-4-559. [DOI] [PubMed]
- 37.Lustig Michael. Sparse MRI, PhD thesis. Stanford University; 2008. [Google Scholar]
- 38.Donoho D. For most large underdetermined systems of linear equations the minimal 1-norm solution is also the sparsest solution. Commun. Pur. Appl. Math. 2006;59:797–829. [Google Scholar]
- 39.Klose AD, Beattie B. Bioluminescence tomography with SP3 equations. Biomedical Optics Topical Meeting. 2008 http://www.opticsinfobase.org/abstract.cfm?URI=BIOMED-2008-BMC8.
- 40.Cai J, Osher S, Shen Z. CAM report 08-52. 2008. Convergence of the Linearized Bregman Iteration for ℓ1-Norm Minimization. [Google Scholar]


