


Abstract
Transcription factors (TFs) regulate gene expression by binding to specific binding sites (TFBSs) in gene promoters. TFBS motifs may contain one or more variable positions. Although the prevailing assumption is that nucleotide variants at such positions are functionally equivalent, there is increasing evidence that such variants play a role in regulation of gene expression. In this article, we propose a method for studying the relationship between the expression of target genes and nucleotide variants in TFBS motifs at a genome-wide scale in Saccharomyces cerevisiae, especially the combinatorial effects of variants at two positions. Our analysis shows that nucleotide variations in more than one-third of variable positions and in 20% of dependent position pairs are highly correlated to gene expression. We define such positions as ‘functional’. However, some positions are only functional as dependent pairs, but not individually. In addition, a significant proportion of the functional positions have been well conserved across all yeast-related species studied. We also find that some positions require the presence of co-occurring TFs, while others maintain their functionality in the absence of a co-occurring TF. Our analysis supports the importance of nucleotide variants at variable positions of TFBSs in gene regulation.
INTRODUCTION
Gene expression is regulated by the interaction between transcription factors (TFs) and their binding sites (TFBSs). TFBSs are known to be short (5–20 bases) and may contain invariant and variable positions. It is believed that nucleotide substitutions at invariant positions usually result in binding site loss, while substitutions at variable positions have little or no effect on the TF recognition of the site (1,2). Thus, nucleotide variants at variable positions are commonly considered to be functionally equivalent. A number of TFBS scanning methods (3–6) are based on this assumption and use position weight matrices (PWMs) (7) to represent the binding nature or specificities of the nucleotide distribution in TFBSs. The components of PWMs give the probability of observing a particular sequence in a collection of known sites, where each position contributes independently to the total binding energy.
Recent advances in the field of transcriptional regulation have given us insight into the role of variable positions in gene regulation as well as in evolution (2,8–12). Moses et al. (2) found that the rate of evolution in TFBSs varies with the positions, suggesting that some positions are under stronger functional constraints than others. Recently, Michal et al. (11) estimated the functional outcome of substituting nucleotides across putative binding sites and found that specific nucleotide substitutions might have a harsher effect on the binding affinity. In addition, Rest,J.S. et al. (personal communication) showed that many nucleotide variants at variable positions in TFBSs exhibit differential expression patterns. Most models assess the functionality of individual variable positions by profiling binding sites. However, the role of the combination of variable positions in biological processes is still unclear, although positional dependency (at both variable and invariant positions) has been demonstrated (13–16). These studies have resulted in the formation of better matrix models to assess the dependence among positions from available experimental data, and thereby gain a deeper understanding of the underlying TF-DNA-binding mechanisms. The findings motivated us to conduct a more comprehensive analysis to assess the impact of nucleotide variation at variable positions in TFBS motifs on gene regulation, and to further study the effects of combinatorial positions.
Previous studies (17–19) indicated that nucleotides occurring at different frequencies in a genome differ in their binding affinities with a TF and genes with different variants fall into different functional categories. Thus, the variants at the same position may have different effects of gene expression under different conditions. In the present work, we integrated the annotations of TFBSs and microarray expression data in Saccharomyces cerevisiae to study the relationship between variable positions and gene expression. For this purpose, we examined each variable position to assess its functionality. A variable position in a TFBS motif was considered functional if the expression patterns of target genes with different nucleotides in that position were significantly different (Rest,J.S. et al., personal communication). We extended this strategy to determine whether a combination of two variable positions that are jointly correlated with the expression of target genes (i.e. dependent position pairs). Our analysis indicates that nucleotide variants at more than one-third of variable positions are functional (i.e., highly correlated to gene expression). In addition, more than 20% of dependent position pairs show a significant effect on gene expression patterns.
MATERIALS AND METHODS
Figure 1 shows the model used to infer the functionality of variable positions. The analysis involved four steps. First, the target genes and the binding motif consensus of each TF in S. cerevisiae were downloaded from the MYBS database (http://cg1.iis.sinica.edu.tw/∼mybs/) (20) and the variable positions in each consensus were identified. Second, the target genes were separated into groups based on the nucleotides at those positions. Third, the degree of co-expression was quantified. Finally, the Kolmogorov-Smirnov (KS) test was applied to determine whether the gene expression of two groups was significantly different.
Figure 1.

Flowchart of the proposed method: (a) the TFBSs were downloaded from MYBS (using PHO4 as an example); (b) the target genes are grouped into two groups, b and ¬b, according to the nucleotide at a certain variable position; (c) the target genes are grouped into two groups (bi bj and ¬bibj) by considering dependent position pairs; (d) the Pearson correlation coefficient for any two genes in the same group was calculated; and (e) the KS test was used to determine whether the degrees of co-expression between two groups are significantly different.
Collecting TFBSs
The TFBSs in the S. cerevisiae genome were also downloaded from the MYBS database (20), which integrates an array of experimentally verified and predicted PWMs that correspond to 183 TFs. The database allows users to identify TFBSs by using DNA-binding affinity data and phylogenetic footprinting data from eight related yeast species. We used the following two criteria to collect TFBSs in the promoter region of each gene: (i) if a TFBS exists in the promoter region of the gene in S. cerevisiae, the TFBS should be conserved in at least two of the other seven yeast species; and (ii) the p-value of the corresponding TF ChIP-chip experiment for the gene should be ≤ 0.01.
Because MYBS integrates both experimental and predicted motifs from several databases, there can be more than one binding motif consensus for a TF. Therefore, for each TF with more than one consensus, a universal consensus was determined by taking the part of each consensus that was common to the entire consensus of the TF. To avoid ambiguity, a gene was excluded in the analysis if the TFBS motif occurred more than once in the promoter region of the gene and the sequences of the occurrences were different. After the above steps, the refined dataset consisted of 71 TFs.
The variable positions in a consensus were determined according to the following criterion. For each position in a consensus, we calculated the frequency of each nucleotide (i.e. the number of target genes containing that nucleotide in the position). Though it is customary to use information content (IC) cutoff to decide whether a position is variable, in our work, for calculation purposes a position was defined as variable if at least two nucleotides were each found more than five times in the total number of occurrences. This is a limitation imposed by the KS test statistic in our method (see the following paragraph). The 71 TFs in our refined dataset contained 632 positions. As binding motifs of 47 TFs lacked variable positions, we omitted them from our analysis. The remaining 24 TFs (with 213 positions) contained 75 variable positions (Table 1).
Table 1.
Information on the studied TFs
| TF | Positions | Variable positions | Individual-position | Deg-pair | Dependence | Dependent-position pairs |
|---|---|---|---|---|---|---|
| ABF1 | 13 | 8 | 8 | 28 | 10 | 10 |
| CAD1 | 10 | 1 | 0 | ‐ | ‐ | ‐ |
| CIN5 | 10 | 6 | 5 | 15 | 11 | 0 |
| DIG1 | 8 | 1 | 0 | ‐ | ‐ | ‐ |
| FHL1 | 10 | 2 | 1 | 1 | 1 | 0 |
| FKH1 | 8 | 2 | 0 | 1 | 0 | 0 |
| FKH2 | 8 | 2 | 0 | 1 | 0 | 0 |
| HAP1 | 11 | 11 | 1 | 55 | 27 | 8 |
| HAP4 | 8 | 2 | 1 | 1 | 1 | 0 |
| INO2 | 9 | 4 | 1 | 6 | 3 | 0 |
| MCM1 | 10 | 6 | 2 | 15 | 5 | 3 |
| RAP1 | 9 | 6 | 2 | 15 | 3 | 2 |
| REB1 | 7 | 1 | 0 | ‐ | ‐ | ‐ |
| RLM1 | 10 | 1 | 0 | ‐ | ‐ | ‐ |
| SKN7 | 10 | 1 | 0 | ‐ | ‐ | ‐ |
| STB1 | 9 | 1 | 1 | ‐ | ‐ | ‐ |
| STE12 | 8 | 1 | 0 | ‐ | ‐ | ‐ |
| SUM1 | 9 | 5 | 1 | 10 | 4 | 0 |
| SWI4 | 7 | 3 | 1 | 3 | 1 | 1 |
| SWI6 | 6 | 4 | 3 | 6 | 6 | 6 |
| TYE7 | 8 | 1 | 0 | ‐ | ‐ | ‐ |
| UME6 | 9 | 4 | 1 | 6 | 2 | 2 |
| YAP1 | 7 | 1 | 0 | ‐ | ‐ | ‐ |
| YDR026C | 9 | 1 | 0 | ‐ | ‐ | ‐ |
| Total | 213 | 75 | 28 | 163 | 74 | 32 |
Positions: the length of the consensus of a TFBS; Variable positions: the number of variable positions; Individual-position: the number of positions that are functional (see ‘Materials and Methods’ section); Deg-pair: the number of variable position pairs; Dependence: the number of variable position pairs that are dependent (passed the χ2-test); Dependent-position pairs: the number of variable position pairs that are functional (see ‘Materials and Methods’ section).
Identifying functional variable positions in TFBSs
For TF α, we grouped its target genes according to their nucleotides at a variable position p in its consensus. The target genes with nucleotide b (A, C, G, or T) at position p formed group b and the remaining genes constituted group ¬b (Figure 1b). We used this grouping strategy to determine whether the nucleotide b relates to a particular pattern in gene expression. If the nucleotide variant at a variable position contained A, T, C and G, we further assessed whether a combination of two nucleotides relates to a particular pattern in gene expression.
The degree of co-expression of any group of genes in a condition was quantified by calculating the distribution of the pairwise Pearson correlation coefficients for all genes in the group [Figure 1(d)]. In a pair of genes, if any of the data for a condition was missing, we only used data that was present for both genes to compute the similarities under the constraint that the proportion of calculated observations in each condition was >65%.
To determine whether the degree of co-expression in one group was significantly higher than that in another group, we applied the one-sided Kolmogorov-Smirnov (KS) test, a non-parametric and distribution free statistical method. The hypotheses H0:  and H1:
  were tested using the one-sided KS test, where F denotes the distribution function of the co-expression levels of genes in a specific group. If H0 is rejected,
  , which means that the co-expression levels in group b are ‘stochastically greater’ than the co-expression levels in group ¬b. In addition, we used the false discovery rate (FDR) (21) to compute the q-value in order to determine the balance between the numbers of true and false positives. If a position had at least one nucleotide with a q-value ≤ 0.05, it was deemed a functional variable position.
To find the dependent relationships between two variable positions, we extended the individual position model to consider two variable positions simultaneously. For two variable positions, pi and pj, the target genes with nucleotide bi at pi and nucleotide bj at pj were collected to form the bibj group, and the remaining genes formed the ¬bi bj group [Figure 1(c)]. Then, based on the two groups, we deduced whether positions pi and pj had an inter-dependent relationship that related to the difference in their gene expression.
Before measuring the difference in gene co-expression between two groups, we applied the χ2-test to determine the dependency between two variable positions. Let n(b, i) be the number of target genes with nucleotide b at position pi, and let N be the total number of target genes. The probability of the occurrence of nucleotide b is
In addition, let n(bi, bj, pi, pj) be the number of target genes with nucleotides bi at position pi and nucleotides bj at position pj. Then, the χ2 statistic is defined as
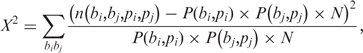 |
where n(bi,bj,pi,pj) is the observed value and 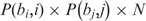 is the expected (theoretical) frequency asserted by the null hypothesis. We use this test to verify the hypothesis H0:
  . If H0 is rejected, there is reason to believe that these two variable positions are interdependent. The criterion for a combination of two variable positions to be dependent is that the p-value derived by the χ2-test must be ≤ 0.05. Correction for multiple testing was not applied at this stage, because it could reduce the number of potential position pairs for further analysis and because we later applied the correction when measuring the difference in gene co-expression. The latter procedure would effectively exclude false positives that might have been included in the set of dependent variable positions detected by the χ2-test.
Microarray data
From the 25 expression datasets of S. cerevisiae, available in the Stanford Microarray Database (SMD, http://genome-www5.stanford.edu/) (22), we downloaded the datasets with at least seven time points; we empirically determined that a dataset should have at least seven time points for a reliable estimation of the Pearson correlation coefficients. Ten expression datasets satisfied this criterion. Each dataset corresponded to a particular biological function. In the glucose dataset (23), we only used the experiments related to galactose limitation and transcriptional response. The functions of the other nine datasets are as follows: glucT2 (24) relates to the physical responses in glucose-limited cultures; calcium (25) is an experiment that adds Ca2+ to yeast; mec1 (26) investigates the relationship between DNA damage responses and Mec1 in yeast; fkh (27) probes the role of Fkh1 and Fkh2 in the regulation of the cell cycle; snf (28) deals with Snf2 and Swi1 in both rich and minimal media; alpha and cdc15 (29) are experiments in which alpha is obtained from cells treated with alpha-factor transiently, and cdc15 is collected from a cdc15-2 temperature sensitive mutant that resumes growth after release from heat shock; sporulation (30) is related to yeast meiosis and spore formation; and diauxic (31) investigates the gene expression accompanying the diauxic shift. In addition, we used the MA lowess (32) and quantile (33) normalization methods to reduce the systematic biases within each microarray, as well as the intensity-dependent effects and biases between microarray data.
Determining potential co-occurring TFs
For each TF α, we also investigated whether there was another TF β that was associated in the same target genes more often than random expectation, and could therefore be a potential co-occurring TF. This is estimated by calculating whether N12/N is greater than the random expectation (N1/N) × (N2/N), where N1 is the total number of target genes of TF α; N2 is the total number of target genes of TF β; N12 is the number of target genes of both TFs α and β; and N is the total number of genes in the S. cerevisiae genome. Under random association, the joint probability of N12/N should be equal to the product of the two marginal probabilities, (N1/N) × (N2/N), which correspond to the random variables of row and column factors in the contingency table. If N12/N is significantly greater than (N1/N) × (N2/N), then there is a positive association. The pairs of TFs whose binding sites overlapped in more than 60% of their target genes were not considered. Our criterion for detecting potential co-occurring TFs was nominal, because using a stringent criterion would reduce their number for further statistical analysis.
Association between variable positions and co-occurring TFs
For each variable position p in the binding motif consensus of TF α, we studied whether the nucleotide variations at position p were significantly associated with the co-occurrence of TF β. For this purpose, we constructed a contingency table (Figure 2). Each of the target genes of TF α is grouped according to the nucleotide at position p (column) and with/without the co-occurring TF β (row). Fisher’s exact test (34) was used to examine the association between the row and the column variables. The null hypothesis is that the nucleotide frequencies at position p are independent of the occurrence of TF β. If the p-value is significantly small, it means that, at position p in the consensus binding motif of TF α, there is a statistically different nucleotide preference when TF β co-occurs, compared to that without the co-occurrence of TF β. We also determined the FDR (21) by computing the q-value in order to correct for possible false positives from multiple tests. If the q-value of a position is ≤0.05, we consider that it has a significant association with the co-occurring TF β.
Figure 2.

Fisher’s exact test for the association between co-occurring TFs and variable positions of a given TF. Here, Xij represents the number of target genes of TF α with nucleotide i (A, T, C or G) at the predicted functional variable position in the TFBS and with/without ( j = 0 or 1, respectively) co-occurring TF β. Ni, where i = 1, 2, 3, 4, indicates the number of target genes whose TFBSs contain nucleotide i (A, T, C or G) at their functional variable positions. K1 indicates the number of target genes containing the TFBSs of TF α and TF β in their upstream or promoter region. K2 represents the frequency of target genes that only contain the TFBS of TF α. M is the total number of target genes used. The exact probability of observing the particular arrangement of the target genes of TF α was calculated by the hypergeometric distribution  .
.
Conservation of variable position and position pairs
For each TF that had a predicted functional variable position (or position pairs), we collected the TFBSs in the promoters of its putative target genes and their ortholog genes in seven related species of S. cerevisiae from MYBS (20). We formed two groups: one for functional variable position/position-pair, which contained the ortholog genes that had TFBSs and our predicted nucleotide variant (or combination of two nucleotides) at these variable positions in the promoters of S. cerevisiae and called them the functional group. The other group (non-functional group) corresponds to functional variable positions/position-pairs, but lacked our predicted nucleotides at these positions.
We then calculated the proportion of a nucleotide variant at the functional variable position/position-pair that is conserved in the functional group in the following manner. We computed the ratio of the number of target genes from the functional group with the total number of target genes with the TFBS in the promoter that contains the nucleotide variant. We calculated the proportion of variable positions/position-pairs for the non-functional group in a similar manner, using the target genes from the non-functional counterpart.
To examine whether the conserved proportion of the functional group was higher than that of non-functional group, the one-sided Wilcoxon Signed-Rank test was performed. The null hypothesis was that the proportion of nucleotide variants that are conserved in the non-functional group is greater than or equal to the proportion in the functional group.
In addition, we performed the one-sided two-sample proportion test (35) to determine the precise significance of the proportion of a nucleotide variant in functional variable positions/position-pairs that are conserved. This was done with a cutoff of Z-score at the 0.01 critical value from the standard normal distribution table. The null hypothesis was that the proportion of a nucleotide variant of functional variable positions/position-pairs in the functional group and the proportion of a nucleotide variant in the non-functional group are equal. Next, we calculated the standard error of differences between the two proportions. If zero lies within the one-sided confidence interval at Z0.01, the null hypothesis cannot be rejected, implying there is no statistical difference in the two proportions.
RESULTS AND DISCUSSION
Individual variable positions in TFBS motifs that are functional
To determine whether individual variable positions have a significant influence on the expression profile, we compiled a dataset comprising of 24 binding motifs (with 213 positions) with 75 variable positions (Tables 1 and S1). Furthermore, 28 variable positions in 13 binding motifs met our criteria for the KS test and were identified as functional in at least one condition (Table 1; see also Figure 3). Eight TFs, namely FHL1, HAP1, HAP4, INO2, STB1, SUM1, SWI4 and UME6, were found to have only one functional variable position in their TFBS motifs. The remaining TFs had more than one variable position that satisfied our criteria of functionality, e.g. the number of functional variable positions in the TFBS motifs of ABF1, CIN5, MCM1, RAP1 and SWI6 are 8, 5, 2, 2 and 3, respectively. The substantial proportion of TFs with functional variable positions was consistent with the results of previous studies on regulatory rules in binding site variants (Rest,J.S. et al., personal communication) (13). This suggests that different nucleotides at a variable position in a TFBS motif are not functionally equivalent.
Figure 3.

Overview of the results with individual functional positions: ‘TFBS’ lists the TFs with variable positions in their TFBS motifs. ‘Positions’ shows the functional positions in our study. ‘b group’ represents the nucleotide at a functional variable position considered functionally significant. The abbreviations at the top of the table correspond to different microarray conditions: G1 (glucose), G2 (glucT2), Ca (calcium), M (mec1), F (fkh), Sn (snf), A (alpha), Cd (cdc15), Sp (sporulation) and D (diauxic). In this figure, the positions that satisfy our criteria (see ‘Materials and Methods’ section) are shown in grey.
Due to the unavailability of biological experiments dealing with variable positions in TFBS motifs, it is difficult to verify the correctness of functional variable positions predicted from our analysis. Here, we tried to validate the biological relevance of these 13 TFs to the conditions used in the microarray experiments by comparing our results with those reported in previous studies. The functionality of most TFs is consistent with the results from past experiments. For example, it is known that ABF1 is functional as a DNA replicating factor in mitotic and meiotic cell cycle progression, chromatin restructuring, fermentation, respiration, sporulation and gene silencing (36–38). We found that ABF1 was functional in almost all the experimental conditions in our analysis (Figure 3). Similarly, consistent with the results reported in ref. (39), we found that the functionality of UME6 is demonstrated in conditions related to galactose limitation.
Functional variants that are condition dependent
A closer inspection of the functional variable positions under different conditions (Figure 3) revealed the following interesting pattern. Of the 28 positions that met our criteria for the KS test, 13 were transiently activated pertinent to one specific condition, while the others were involved in different biological conditions. For example, we found that all the variable positions in the CIN5 motif were only functional in the calcium condition; and some TFBS motifs were only functional at particular positions, e.g. FHL1, HAP4, INO2, STB1, SUM1, SWI4 and UME6. Interestingly, for some positions, we could infer that different nucleotides were functional under different conditions. In Figure 3, position 3 in the TFBS motif of HAP1 with nucleotide ‘T’ is functional in the alpha condition, but with nucleotide ‘G’, it is functional in the diauxic condition. Similarly, positions 4, 5 and 6 in the TFBS motif of SWI6 with nucleotide ‘A’ are functional under conditions glucose and cdc15. Such behavior is also evident in the TFBS motifs of ABF1, MCM1 and RAP1.
In addition, at some positions, more than one nucleotide formed a functional group. For example, ABF1, which is a multi-functional TF, is known to be functional in galactose metabolism (40). However, according to our results, positions 6 and 9 of the ABF1 motif are also functional with the nucleotide ‘AT’ in this role. We also found that ‘AT’ at position 9 and ‘AG’ at position 10 in the ABF1 motif, as well as ‘AT’ at position 6 in the RAP1 motif, were functional in cell-cycle related conditions (alpha and cdc15). These results indicate that variable positions definitely play a role in gene regulation.
Comparison with another study
We compared our results with a recent study of individual position variants by (Rest,J.S. et al., personal communication), who considered 48 TFs with 195 position variants in S. cerevisiae. Their analysis was based on a regulatory circuit that has genes with a single TFBS in the promoter. Approximately 29% of their TFBS motifs had individual functional variants. In terms of the overall percentage of functional individual position variants, our results are close to theirs. In addition, a number of TFBS motifs e.g. ABF1, MCM1, SUM1, RAP1, CIN5 and SWI4 considered in both studies have common functional variable positions (∼60%). For example, positions 6, 8 and 9 in ABF1 as well as position 2 in SWI4 were considered functional in both studies.
There are some differences between the results of the two studies. For example, according to our analysis, both positions 4 and 8 in MCM1 are functional with nucleotide ‘A’, but were not found in their study. Another area of disagreement relates to the TFBS motif of REB1. In their analysis, position 9 with nucleotide ‘G’ is considered functional in the TFBS motif of REB1, but we did not detect this functionality. However, REB1-binding sites are known to contain few functional variants, which is indicative of selection pressure at variable positions (41). Such differences could be in part due to the fact that the expression datasets used were different between the two studies; Affymetrix and cDNA microarray data were used in the work of Rest et al., whereas only the cDNA microarray data from the Stanford Microarray Database were used in our study. Another possible reason is that the two studies used different consensus configurations.
Our study of inferring the functionality of individual functional variable positions was inspired by the work of Rest et al. However, Rest et al.’s work dealt with the evolutionary significance of variable positions among the Saccharomyces sensu stricto species, while we did not study evolutionary aspects in detail, but we used the conservation of functional positions to support our results. Moreover, we extended the study to infer the functionality of position pairs in TFBS motifs (see the following sections), where we tried to predict the co-occurring TFs that work synergistically. This second part is totally new.
Functionality of variable position pairs
We extended our study to include dependent variable position pairs and assessed their functionality. For this purpose, we first used a χ2-test to determine whether the nucleotides distributed between two positions were dependent. We identified 163 variable position pairs, 74 of which met the criteria discussed in the ‘Materials and Methods’ section. The KS test was then applied to the 74 pairs and yielded 32 functional position pairs. Our results suggest that ∼43% of dependent position pairs (20% of all variable position pairs) have functional meaning under different conditions (Tables 1 and 2).
Table 2.
Functional-dependent variable position pairs
| TFBS | (i, j) | (bi, bj, C) |
|---|---|---|
| ABF1 | (1, 9)1 | (A, A, Ca), (A, G, Sn)*, (G, G, Sp), (G, G, D)* |
| (4, 6)1 | (A, C, G1), (A, A, Ca), (A, T, A), (A, T, Sp)* | |
| (4, 7)1 | (A, A, Ca) | |
| (4, 9)1 | (A, A, Ca), (A, G, Sp) | |
| (4, 10)1 | (A, C, G1), (A, C, Ca), (A, G, Sn) | |
| (6, 7)1 | (G, C, G1), (A, T, Ca), (G, T, Sn) | |
| (6, 8)1 | (T, T, G1), (T, C, A)*, (C, A, A), (T, T, A)* | |
| (6, 10)1 | (C, C, G1), (T, C, Ca) | |
| (8, 10)1 | (T, G, G1), (T,G, G2), (T,C, Ca), (T, G, M)*, (T, G, F), (T, T, Cd ) | |
| (9, 10)1 | (A, C, Ca), (T, C, A), (C, A, Sp) | |
| HAP1 | (1, 3)3 | (G, T, A) |
| (2, 3)3 | (G, A, Cd ) | |
| (2, 8)2 | (C, T, D) | |
| (3, 5)3 | (T, T, Ca), (T, T, A) | |
| (3, 6)3 | (T, T, A) | |
| (3, 9)3 | (T, C, A) | |
| (3, 10)3 | (T, G, A) | |
| (3, 11)3 | (A, G, Cd ) | |
| MCM1 | (5, 6)2 | (T, T, Cd ), (T, T, D) |
| (5, 7)2 | (T, T, Cd ) | |
| (6, 7)2 | (T, T, Cd ) | |
| RAP1 | (2, 7)3 | (C, A, G2) |
| (5, 6)3 | (A, T, Cd ) | |
| SWI4 | (2, 4)3 | (A, G, Cd ) |
| SWI6 | (1, 4)3 | (A, A, G1), (G, A, Cd ) |
| (1, 5)3 | (A, A, G1), (G, A, Cd ) | |
| (1, 6)3 | (A, A, G1), (G, A, Cd ) | |
| (4, 5)1 | (A, A, G1), (A, A, Cd ) | |
| (4, 6)1 | (A, A, G1), (A, A, Cd ) | |
| (5, 6)1 | (A, A, G1), (A, A, Cd ) | |
| UME6 | (2, 7)2 | (G, C, G1) |
| (7, 8)3 | (C, C, G1) |
In this table, i and j denote, respectively, the first and second positions of a variable position pair; and in (bi, bj, C), bi and bj are the nucleotides at positions i and j, respectively; and C corresponds to the following microarray conditions: G1 (glucose), G2 (glucT2), Ca (calcium), M (mec1), F (fkh), Sn (snf), A (alpha), Cd (cdc15), Sp (sporulation), and D (diauxic). Subscripts 1–3, respectively, denote the position pairs in Category 1 (functional individually and in combination), Category 2 (only functional as combinations) and Category 3 (one position was functional individually but the other position was not). The superscript asterist indicates position pairs in Category 1 that are only functional as a combination under specific conditions.
To further investigate the functionality of the dependent variable position pairs, we examined them under different experimental conditions (Table 2) and found that some were dependent and functional in several TFBS motifs. Some motifs were only functional in one condition, i.e. UME6 in the glucose condition and SWI4 in the cdc15 condition. In the remaining TFBS motifs, the variable position pairs were functional in more than one condition and some had more than one functional position pair. The position pair (3, 5) of HAP1 was found to be functional in both the calcium and alpha conditions. In the RAP1 motif, dependent position pairs (2, 7) and (5, 6) with corresponding nucleotides (C, A) and (A, T) were found to be functional in conditions glucT2 and cdc15, respectively (Table 2 and Figure S1). Moreover, the condition-specificity demonstrated by position pairs in our results confirms the findings of previous biological experiments. Although there is no direct evidence of the contribution of our detected position pairs in these experiments, the functionality of a TF in specific conditions could be explained by the role of variable positions in TF-DNA interactions. For example, SWI4 is responsible for binding to the SWI4-6-dependent cell cycle box (SCB) (42). The position pair (2, 4) with corresponding nucleotides (A, G) in the SWI4 motif is identified as functional in condition cdc15. Another example is HAP1, which acts as repressor in the gene encoding function related to respiration and oxidative damage (43). In our work, position pair (2, 8) with (C, T) in the HAP1 motif is considered functional in the diauxic condition, which is consistent with the function attributed to HAP1 in previous experiments (44,45). Moreover, we found that several position pairs in HAP1 were functional under experimental conditions related to the cell cycle, which is consistent with previous findings (46).
Higher order combination of variable positions can be more informative
It is possible that some of the functional position pairs in TFBSs could be integrated to infer the functionality of higher order combinatorial positions. For example, all the possible pairs for positions 1, 4, 5 and 6 in SWI6 are listed in Table 2. By considering these pairs, we can infer that the position combination (1, 4, 5, 6) in the SWI6 motif may play a role in regulating its target genes. Here, different nucleotide combinations (A, A, A, A) and (G, A, A, A) are found to be functional in conditions glucose and cdc15, respectively. This could mean that position 1 with an ‘A’ in the quadruplet (A, A, A, A) has a higher probability of regulating genes in the glucose condition, and position 1 with a ‘G’ in (G, A, A, A) might be significant in cell cycle related conditions. Similar cases can be found in other TFBSs, e.g. positions 5, 6 and 7 in MCM1. These results indicate that higher order combinatorial positions might play a role in the regulatory mechanism; thus, the issue warrants further investigation.
Relationships between individual functional positions and position pairs
In our results, 13 TFs contain functional individual positions and seven have functional variable position pairs. The latter can be classified into the following three categories (Table 2): (i) both positions in a pair are functional individually and in combination; (ii) both positions in a pair are functional only as a combination; and (iii) one position in the pair was functional individually but the other position was not. The numbers of position pairs in the three categories are 13, 5 and 14, respectively. Categories 2 and 3 indicate that some positions were only functional as a pair but not individually. Moreover, although positions in Category 1 are functional individually and in combination, some variants in these positions were found to be functional in combination under some conditions that were not detected when considered individually (see the six nucleotide variant pairs indicated by asterisk in Table 2). For example, ABF1 was found to be functional at the position pair (1, 9) with the corresponding nucleotides (A, G) in the snf condition (27,37,47).
Category two contained five position pairs that were non-functional individually, but formed functional position pairs in combination with one another. For example, MCM1, a member of the MADS box family, is known to be active in diverse cellular processes, such as transcriptional regulation and sequence specific DNA binding; hence, its binding site is well characterized (48,49). According to our analysis, in cell cycle-related experiments, MCM1 is functional at (5, 6), (5, 7) and (6, 7), and all the corresponding nucleotides at these position pairs are (T, T). However, individual positions in any of these three position pairs are non-functional.
There are also positions that are functional individually, but they have no significance as position pairs. For example, the SUM1-binding site with the ‘C’ nucleotide at position 7 is functional in the sporulation stage of the yeast cell cycle, and is also detected in the glucose condition (23) at this position. However, the pair was not found to be functional, probably because the unavailability of pairs of variable positions that satisfy our criteria for functionality and dependency (see ‘Materials and Methods’ section).
Interestingly, position pairs with the nucleotides (A, A) and (T, T) occurred more frequently than the other groups (Table 4). Furthermore, in our results for individual functional variants, the ‘A’ and ‘T’ nucleotide groups occurred most frequently. These results are consistent with the findings reported in ref. (11), which demonstrated the positional functional importance of TFBSs by performing an in silico experiment on single nucleotide substitutions. The results in ref. (11) indicate that substitutions of binding sites between A and T and vice versa are involved in fewer cases of binding site loss. In addition, occurrences of the combination of ‘C’ and ‘G’ nucleotides at two dependent variable positions were infrequent. The results also suggest that substitutions between G and C might have a stronger effect on gene expression patterns, leading to more cases of binding site loss, which partially agrees with our results.
Table 4.
The frequency of each group of nucleotide variations
| Nucleotide | Frequency | (bi, bj) | Frequency |
|---|---|---|---|
| A | 19 | (A, A) | 13 |
| AC | 7 | (A, C) | 4 |
| AG | 8 | (A, G) | 5 |
| AT | 13 | (A, T) | 4 |
| C | 15 | (C, A) | 3 |
| G | 13 | (C, C) | 2 |
| T | 16 | (C, T) | 1 |
| (G, A) | 4 | ||
| (G, C) | 2 | ||
| (G, G) | 2 | ||
| (G, T) | 2 | ||
| (T, C) | 5 | ||
| (T, G) | 5 | ||
| (T, T) | 7 |
‘Nucleotide’ represents the individual nucleotide types A, T, G and C; bi and bj are the nucleotides that form functional-dependent pairs (bi, bj); ‘Frequency’ denotes the frequency of the ‘Nucleotide’ and nucleotide pairs (bi, bj).
Conservation of functional variable positions
Positions with functional constraints are probably under purifying selection and therefore, they might have undergone fewer substitutions (2). It is also known from the work of Kotelnikova et al. (50) that in bacteria not so frequently occurring nucleotides can be evolutionary stable and subjected to fewer substitutions in comparison to the number of neutral substitutions. To further verify the reliability of our results, we considered the evolutionary conservation of our predicted functional positions in all seven related species of S. cerevisiae in MYBS (20). For this, we calculated the proportion for each nucleotide variant at functional variable position/position-pair that is conserved in the functional group and the corresponding proportion in the non-functional group (see ‘Materials and Methods’ section). The significant result (P-value = 9 × 10⁻⁶) of one-sided Wilcoxon Signed-Rank test showed that the conserved proportions in the functional group are stochastically greater than that in the non-functional group.
To examine the significance of each nucleotide variant corresponding to variable position/position-pair in the functional group, we performed a one-sided two-sample proportion test (35). In general, the proportion of a nucleotide variant at functional variable position/position-pair that is conserved in the functional group was higher than the proportion in the non-functional group. Table S2 shows the proportion of functional position pairs and the pairs of nucleotide bases conserved between the orthologs (the proportions of individual positions are not shown). Approximately 40% of these combinations were found to be conserved in orthologs of S. cerevisiae. Among the seven TFBSs with functional position pairs, two had all the predicted functional position pairs conserved and two exhibited conservation between orthologs at ∼ 55% of the predicted position pairs. Thus, the position-pairs detected from our analysis appear to be under purifying selection and have not evolved neutrally.
Supporting evidence from TF-DNA complex structures
To check the biological consistency of our results, we analyzed the crystal structure data of TF-DNA complexes. For example, HAP1 is an asymmetric homodimeric DNA-binding protein, where asymmetric dimerization helps in orienting HAP1 to identify the specific DNA-binding site (51). HAP1 contains a ZN2Cys6 cluster domain that binds to DNA sequences at two DNA half sites with either an inverted 5′-CGG(NN)CCG-3′ orientation or an everted 5′-CCG(NN)CGG-3′ orientation. The nucleotides detected by our analysis at the dependent position pairs (2, 8) with the corresponding nucleotides (C, T) interact with Lys-71 and Arg-57; and the nucleotide G at position 3 interacts individually with Lys-71. In addition, it is known that the position pairs (5, 6), (5, 7) and (6, 7) in MCM1 can form hydrogen bonds with MCM1 monomer residues (52). In the case of the RAP1–DNA complex, the two-domain protein binds to DNA in a tandem orientation (53). The nucleotide bases at the binding site interacted in the RAP1–DNA crystal structure, which matched our results. At the position pair (2, 7) with nucleotide combination (C, A), ‘C’ interacted with Ser-594 of the C-terminal tail and ‘A’ interacted with Arg-544 and Phe-449 in domain 2. Meanwhile, for the position pair (5, 6), interactions were observed for the residues Tyr-592 of C-terminal tail and Thr-578 in domain 2. Next, for the three TFs HAP1, MCM1 and RAP1, we calculated the functional ratio, i.e. the ratio of the number of functional variable positions in their consensus motifs that also had interactions in their respective crystal structures to the total number of nucleotide-amino acid interactions in the corresponding crystal structures (Table S3). The functional ratios were high. Of course, it is possible that some or all of the functional positions predicted by our method do not have such interactions. Nevertheless, these crystallographic observations, though small due to the unavailability of TF–DNA complex structures for most TFs, do support the functionality of dependent position pairs detected by our method.
Relationship between functional variable positions and co-occurring TFs
We also considered the possible relationship between the co-occurring TFs and our predicted functional variable positions. Although most in silico studies of gene regulation focus on the interaction between a TF and its binding site, other factors are also involved in this process, e.g. co-factors bound to the TF or interaction with other co-occurring TFs. We focused on the latter and tried to determine the association between co-occurring TFs and our predicted functional variable positions. First, we identified potential co-occurring TFs for all the variable positions in each of the 13 TFs with individual functional nucleotide variants listed in Figure 3. To be consistent with the study of the relationship between variable positions and gene expression, the target genes of each TF were also constrained by the criteria for the ChIP-chip p-value and phylogenetic criteria. The latter requires that each TFBS should be conserved in at least two yeast-related species. We further examined the relationship between co-occurring TFs and the nucleotide composition at these variable positions using Fisher’s exact test (34). TFs were classified into two categories. The first contained the TFBSs (ABF1, CIN5 and RAP1) whose nucleotide variants preferred to be associated with one or more co-occurring TFs and matched our results (shown in Figure 3). The second contained TFBSs (others) whose nucleotides preferred to be associated with co-occurring TFs that differed from our predictions (Table 3). Figure S2 shows the results of Fisher’s exact test.
Table 3.
Relationships between co-occurring TFs and functional variable positions
| TFBS | Position | Less-preferred | More-preferred | Co-TF |
|---|---|---|---|---|
| ABF1 | 4 | A | G | MBP1 |
| 6 | A | TYE7 | ||
| 7 | T | CBF1 | ||
| 8 | T | G | REB1 | |
| 9 | C | INO2 | ||
| 10 | G | CBF1 | ||
| C | HAP1 | |||
| CIN5 | 3 | T | A | MBP1 |
| T | A | PUT3 | ||
| T | A | SWI4 | ||
| T | A | SWI6 | ||
| 4 | C | MBP1 | ||
| C | PUT3 | |||
| C | SWI4 | |||
| C | SWI6 | |||
| 8 | T | A | MBP1 | |
| T | A | PUT3 | ||
| T | A | SWI4 | ||
| T | A | SWI6 | ||
| FHL1 | 8 | A | G | RAP1 |
| MCM1 | 8 | T | RPN4 | |
| RAP1 | 6 | A | RPN4 | |
| 7 | C | INO2 | ||
| T | SUM1 | |||
| SWI6 | 4 | A | C | MBP1 |
| 5 | A | G | MBP1 | |
| 6 | A | T | MBP1 |
Functional positional variants in TFBS motifs that are associated with co-occurring TFs are listed. ‘TFBS’ corresponds to TFs with individual functional variable positions. ‘Position’ is the list of individual functional variable positions. ‘Less-preferred’ and ‘More-preferred’ correspond to nucleotide variants that are significantly and non-significantly associated with co-occurring TFs. ‘Co-TF’ is the list of co-occurring TFs for each TF listed in the first column of the table. The nucleotides that matched our predictions in the ‘More-preferred’ category are shown in bold font.
We repeated the above experiment, but excluded the criteria for the ChIP-chip P-values (results not shown). This was done because a ChIP-chip P-value of 0.01 or less might constrain the set of TFBSs that we selected for our analysis. However, there was no significant change in their association with co-occurring TFs. This suggested the possibility that, in an experimental condition, the variable positions of the TFBSs in category one could be functional only in the presence of a co-occurring TF, while those in category two could probably maintain their functionality in the absence of a co-occurring TF.
Variable positions with lower IC can be functional
It was proposed that invariant positions with high IC tend to be important in gene regulation (54). To analyze the relationship between IC and functionality of a variable position, we calculated the ICs of all the functional positions (both variable positions and position pairs) from our analysis using the method described by Wasserman et al. (55). We determined the number of functional variable positions that had IC <1 bit of information (category 1) and those which had more than 1 bit of information (category 2). As shown in Figure S3, for the 28 variable positions that are functional individually, 14 of them were in the category 1 and the remaining positions were in the category 2. Among the 32 functional position pairs, 13 had both the positions in the category 1 and 19 belonged to both categories. Also, 20 positions in the category 1 were highly variable or truly degenerate (i.e. all the four nucleotides represent at least to some degree). Furthermore, the TFBSs of STB1, SWI4, SWI6, UME6, INO2 and FHL1 lacked any highly variable positions that were also functional, while the TFBSs of the other TFs had one or more functional highly variable positions. Previous studies have shown that different rates of nucleotide substitution at binding sites can be associated with functionality of the TFBSs (56,57). Analysis of the effect of purifying selection on both variable and invariant positions among the yeast species is an ongoing work and has not been described here in detail.
CONCLUSION
In this study, we have assessed the impact of nucleotide variation at variable positions of TFBSs on gene expression. This is a challenging problem because of incomplete TFBS annotation and the noise inherent in gene expression. To address the problem, we proposed a novel method that infers the functionality of nucleotide variations at the variable positions of TFBSs, as well as their combinatorial effects on gene expression. Interestingly, we found a substantial proportion of TFs with functional position variants, contradicting the prevailing assumption that nucleotides in variable positions are functionally equivalent. We also found that functional variants are condition dependent, and that many dependent position pairs have a significant impact on gene expression patterns. Our results are consistent with the available experimental data and TF–DNA complex crystal structure analysis. Finally, our findings suggest that, in yeast, nucleotide variants at the variable positions of TFBSs contribute to variation in gene expression.
SUPPLEMENTARY DATA
Supplementary Data are available at NAR Online.
FUNDING
Institute of Information Science, Academia Sinica and National Science Council [grant number NSC97-2627-P-001-002] to HKT. Funding for open access charge: Institute of Information Science, Academia Sinica and National Science Council [grant number NSC97-2627-P-001-002].
Conflict of interest statement. None declared.
Supplementary Material
ACKNOWLEDGEMENTS
The authors wish to thank Joshua Rest for sharing unpublished manuscript. Two reviewers and Wen-Hsiung Li provided valuable suggestions and comments.
REFERENCES
- 1.Mirny LA, Gelfand MS. Structural analysis of conserved base pairs in protein-DNA complexes. Nucleic Acids Res. 2002;30:1704–1711. doi: 10.1093/nar/30.7.1704. [DOI] [PMC free article] [PubMed] [Google Scholar]
- 2.Moses AM, Chiang DY, Kellis M, Lander ES, Eisen MB. Position specific variation in the rate of evolution in transcription factor binding sites. BMC Evol. Bio.l. 2003;3:19. doi: 10.1186/1471-2148-3-19. [DOI] [PMC free article] [PubMed] [Google Scholar]
- 3.Su G, Mao B, Wang J. A web server for transcription factor binding site prediction. Bioinformation. 2006;1:156–157. doi: 10.6026/97320630001156. [DOI] [PMC free article] [PubMed] [Google Scholar]
- 4.Sandelin A, Alkema W, Engstrom P, Wasserman WW, Lenhard B. JASPAR: an open-access database for eukaryotic transcription factor binding profiles. Nucleic Acids Res. 2004;32:D91–D94. doi: 10.1093/nar/gkh012. [DOI] [PMC free article] [PubMed] [Google Scholar]
- 5.Tompa M, Li N, Bailey TL, Church GM, De Moor B, Eskin E, Favorov AV, Frith MC, Fu Y, Kent WJ, et al. Assessing computational tools for the discovery of transcription factor binding sites. Nat. Biotechnol. 2005;23:137–144. doi: 10.1038/nbt1053. [DOI] [PubMed] [Google Scholar]
- 6.MacIsaac KD, Wang T, Gordon DB, Gifford DK, Stormo GD, Fraenkel E. An improved map of conserved regulatory sites for Saccharomyces cerevisiae. BMC Bioinformatics. 2006;7:113. doi: 10.1186/1471-2105-7-113. [DOI] [PMC free article] [PubMed] [Google Scholar]
- 7.Stormo GD. DNA binding sites: representation and discovery. Bioinformatics. 2000;16:16–23. doi: 10.1093/bioinformatics/16.1.16. [DOI] [PubMed] [Google Scholar]
- 8.Berg J, Willmann S, Lassig M. Adaptive evolution of transcription factor binding sites. BMC Evol. Biol. 2004;4:42. doi: 10.1186/1471-2148-4-42. [DOI] [PMC free article] [PubMed] [Google Scholar]
- 9.Moses AM, Chiang DY, Pollard DA, Iyer VN, Eisen MB. MONKEY: identifying conserved transcription-factor binding sites in multiple alignments using a binding site-specific evolutionary model. Genome Biol. 2004;5:R98. doi: 10.1186/gb-2004-5-12-r98. [DOI] [PMC free article] [PubMed] [Google Scholar]
- 10.Moses AM, Pollard DA, Nix DA, Iyer VN, Li XY, Biggin MD, Eisen MB. Large-scale turnover of functional transcription factor binding sites in Drosophila. PLoS Comput Biol. 2006;2:e130. doi: 10.1371/journal.pcbi.0020130. [DOI] [PMC free article] [PubMed] [Google Scholar]
- 11.Michal L, Mizrahi-Man O, Pilpel Y. Functional characterization of variations on regulatory motifs. PLoS Genet. 2008;4:e1000018. doi: 10.1371/journal.pgen.1000018. [DOI] [PMC free article] [PubMed] [Google Scholar]
- 12.Andersen MC, Engstrom PG, Lithwick S, Arenillas D, Eriksson P, Lenhard B, Wasserman WW, Odeberg J. In silico detection of sequence variations modifying transcriptional regulation. PLoS Comput. Biol. 2008;4:e5. doi: 10.1371/journal.pcbi.0040005. [DOI] [PMC free article] [PubMed] [Google Scholar]
- 13.Stormo GD, Schneider TD, Gold L. Quantitative analysis of the relationship between nucleotide sequence and functional activity. Nucleic Acids Res. 1986;14:6661–6679. doi: 10.1093/nar/14.16.6661. [DOI] [PMC free article] [PubMed] [Google Scholar]
- 14.Tomovic A, Oakeley EJ. Position dependencies in transcription factor binding sites. Bioinformatics. 2007;23:933–941. doi: 10.1093/bioinformatics/btm055. [DOI] [PubMed] [Google Scholar]
- 15.Zhang MQ, Marr TG. A weight array method for splicing signal analysis. Comput. Appl. Biosci. 1993;9:499–509. doi: 10.1093/bioinformatics/9.5.499. [DOI] [PubMed] [Google Scholar]
- 16.Barrick D, Villanueba K, Childs J, Kalil R, Schneider TD, Lawrence CE, Gold L, Stormo GD. Quantitative analysis of ribosome binding sites in E.coli. Nucleic Acids Res. 1994;22:1287–1295. doi: 10.1093/nar/22.7.1287. [DOI] [PMC free article] [PubMed] [Google Scholar]
- 17.Gaudet J, Mango SE. Regulation of organogenesis by the Caenorhabditis elegans FoxA protein PHA-4. Science. 2002;295:821–825. doi: 10.1126/science.1065175. [DOI] [PubMed] [Google Scholar]
- 18.Gaudet J, Muttumu S, Horner M, Mango SE. Whole-genome analysis of temporal gene expression during foregut development. PLoS Biol. 2004;2:e352. doi: 10.1371/journal.pbio.0020352. [DOI] [PMC free article] [PubMed] [Google Scholar]
- 19.Giordano M, Godi M, Giacopelli F, Lessi M, Mellone S, Paracchini R, Petri A, Bellone J, Ravazzolo R, Bona G, et al. A variation in a Pit-1 site in the growth hormone gene (GH1) promoter induces a differential transcriptional activity. Mol. Cell Endocrinol. 2006;249:51–57. doi: 10.1016/j.mce.2006.01.006. [DOI] [PubMed] [Google Scholar]
- 20.Tsai HK, Chou MY, Shih CH, Huang GT, Chang TH, Li WH. MYBS: a comprehensive web server for mining transcription factor binding sites in yeast. Nucleic Acids Res. 2007;35:W221–W226. doi: 10.1093/nar/gkm379. [DOI] [PMC free article] [PubMed] [Google Scholar]
- 21.Storey JD, Tibshirani R. Statistical significance for genomewide studies. Proc. Natl Acad. Sci. USA. 2003;100:9440–9445. doi: 10.1073/pnas.1530509100. [DOI] [PMC free article] [PubMed] [Google Scholar]
- 22.Demeter J, Beauheim C, Gollub J, Hernandez-Boussard T, Jin H, Maier D, Matese JC, Nitzberg M, Wymore F, Zachariah ZK, et al. The stanford microarray database: implementation of new analysis tools and open source release of software. Nucleic Acids Res. 2007;35:D766–D770. doi: 10.1093/nar/gkl1019. [DOI] [PMC free article] [PubMed] [Google Scholar]
- 23.Ronen M, Botstein D. Transcriptional response of steady-state yeast cultures to transient perturbations in carbon source. Proc. Natl Acad. Sci. USA. 2006;103:389–394. doi: 10.1073/pnas.0509978103. [DOI] [PMC free article] [PubMed] [Google Scholar]
- 24.Brauer MJ, Saldanha AJ, Dolinski K, Botstein D. Homeostatic adjustment and metabolic remodeling in glucose-limited yeast cultures. Mol. Biol. Cell. 2005;16:2503–2517. doi: 10.1091/mbc.E04-11-0968. [DOI] [PMC free article] [PubMed] [Google Scholar]
- 25.Yoshimoto H, Saltsman K, Gasch AP, Li HX, Ogawa N, Botstein D, Brown PO, Cyert MS. Genome-wide analysis of gene expression regulated by the calcineurin/Crz1p signaling pathway in Saccharomyces cerevisiae. J. Biol. Chem. 2002;277:31079–31088. doi: 10.1074/jbc.M202718200. [DOI] [PubMed] [Google Scholar]
- 26.Gasch AP, Huang M, Metzner S, Botstein D, Elledge SJ, Brown PO. Genomic expression responses to DNA-damaging agents and the regulatory role of the yeast ATR homolog Mec1p. Mol. Biol. Cell. 2001;12:2987–3003. doi: 10.1091/mbc.12.10.2987. [DOI] [PMC free article] [PubMed] [Google Scholar]
- 27.Zhu G, Spellman PT, Volpe T, Brown PO, Botstein D, Davis TN, Futcher B. Two yeast forkhead genes regulate the cell cycle and pseudohyphal growth. Nature. 2000;406:90–94. doi: 10.1038/35017581. [DOI] [PubMed] [Google Scholar]
- 28.Sudarsanam P, Iyer VR, Brown PO, Winston F. Whole-genome expression analysis of snf/swi mutants of Saccharomyces cerevisiae. Proc. Natl Acad. Sci. USA. 2000;97:3364–3369. doi: 10.1073/pnas.050407197. [DOI] [PMC free article] [PubMed] [Google Scholar]
- 29.Spellman PT, Sherlock G, Zhang MQ, Iyer VR, Anders K, Eisen MB, Brown PO, Botstein D, Futcher B. Comprehensive identification of cell cycle-regulated genes of the yeast Saccharomyces cerevisiae by microarray hybridization. Mol. Biol. Cell. 1998;9:3273–3297. doi: 10.1091/mbc.9.12.3273. [DOI] [PMC free article] [PubMed] [Google Scholar]
- 30.Chu S, DeRisi J, Eisen M, Mulholland J, Botstein D, Brown PO, Herskowitz I. The transcriptional program of sporulation in budding yeast. Science. 1998;282:699–705. doi: 10.1126/science.282.5389.699. [DOI] [PubMed] [Google Scholar]
- 31.DeRisi JL, Iyer VR, Brown PO. Exploring the metabolic and genetic control of gene expression on a genomic scale. Science. 1997;278:680–686. doi: 10.1126/science.278.5338.680. [DOI] [PubMed] [Google Scholar]
- 32.Quackenbush J. Microarray data normalization and transformation. Nat. Genet. 2002;32(Suppl):496–501. doi: 10.1038/ng1032. [DOI] [PubMed] [Google Scholar]
- 33.Bolstad BM, Irizarry RA, Astrand M, Speed TP. A comparison of normalization methods or high density oligonucleotide array data based on variance and bias. Bioinformatics. 2003;19:185–193. doi: 10.1093/bioinformatics/19.2.185. [DOI] [PubMed] [Google Scholar]
- 34.Agresti A. A survey of exact inference for contingency tables. Stat. Sci. 1992;7:131–153. [Google Scholar]
- 35.Tsai HK, Huang GT, Chou MY, Lu HH, Li WH. Method for identifying transcription factor binding sites in yeast. Bioinformatics. 2006;22:1675–1681. doi: 10.1093/bioinformatics/btl160. [DOI] [PubMed] [Google Scholar]
- 36.Schlecht U, Erb I, Demougin P, Robine N, Borde V, Nimwegen EV, Nicolas A, Primig M. Genome-wide expression profiling, in vivo DNA binding analysis, and probabilistic motif prediction reveal novel Abf1 target genes during fermentation, respiration, and sporulation in Yeast. Mol. Biol. Cell. 2008;19:2193–2207. doi: 10.1091/mbc.E07-12-1242. [DOI] [PMC free article] [PubMed] [Google Scholar]
- 37.Yarragudi A, Miyake T, Li R, Morse RH. Comparison of ABF1 and RAP1 in chromatin opening and transactivator potentiation in the budding yeast Saccharomyces cerevisiae. Mol. Cell Biol. 2004;24:9152–9164. doi: 10.1128/MCB.24.20.9152-9164.2004. [DOI] [PMC free article] [PubMed] [Google Scholar]
- 38.Casey L, Patterson EE, Muller U, Fox CA. Conversion of a replication origin to a silencer through a pathway shared by a forkhead transcription factor and an S phase cyclin. Mol. Biol. Cell. 2008;19:608–622. doi: 10.1091/mbc.E07-04-0323. [DOI] [PMC free article] [PubMed] [Google Scholar]
- 39.Lemmens K, Dhollander T, De Bie T, Monsieurs P, Engelen K, Smets B, Winderickx J, De Moor B, Marchal K. Inferring transcriptional modules from ChIP-chip, motif and microarray data. Genome Biol. 2006;7:R37. doi: 10.1186/gb-2006-7-5-r37. [DOI] [PMC free article] [PubMed] [Google Scholar]
- 40.Jung SY, Yoo HY, Kim YH, Kim J, Rho HM. The glucose-dependent transactivation activity of ABF1 on the expression of the TDH3 gene in yeast. Curr. Genet. 1995;27:312–317. doi: 10.1007/BF00352099. [DOI] [PubMed] [Google Scholar]
- 41.Bilu Y, Barkai N. The design of transcription-factor binding sites is affected by combinatorial regulation. Genome Biol. 2005;6:R103. doi: 10.1186/gb-2005-6-12-r103. [DOI] [PMC free article] [PubMed] [Google Scholar]
- 42.Andrews BJ, Moore LA. Interaction of the yeast Swi4 and Swi6 cell cycle regulatory proteins in vitro. Proc. Natl Acad. Sci. USA. 1992;89:11852–11856. doi: 10.1073/pnas.89.24.11852. [DOI] [PMC free article] [PubMed] [Google Scholar]
- 43.Hon T, Lee HC, Hu Z, Iyer VR, Zhang L. The heme activator protein Hap1 represses transcription by a heme-independent mechanism in Saccharomyces cerevisiae. Genetics. 2005;169:1343–1352. doi: 10.1534/genetics.104.037143. [DOI] [PMC free article] [PubMed] [Google Scholar]
- 44.Lombardia LJ, Cadahia-Rodriguez JL, Freire-Picos MA, Gonzalez-Siso MI, Rodriguez-Torres AM, Cerdan ME. Transcript analysis of 203 novel genes from Saccharomyces cerevisiae in hap1 and rox1 mutant backgrounds. Genome. 2000;43:881–886. doi: 10.1139/g00-049. [DOI] [PubMed] [Google Scholar]
- 45.Verwaal R, Arako M, Kapur R, Verkleij AJ, Verrips CT, Boonstra J. HXT5 expression is under control of STRE and HAP elements in the HXT5 promoter. Yeast. 2004;21:747–757. doi: 10.1002/yea.1106. [DOI] [PubMed] [Google Scholar]
- 46.Tsai HK, Lu HH, Li WH. Statistical methods for identifying yeast cell cycle transcription factors. Proc. Natl Acad. Sci. USA. 2005;102:13532–13537. doi: 10.1073/pnas.0505874102. [DOI] [PMC free article] [PubMed] [Google Scholar]
- 47.Workman JL, Kingston RE. Alteration of nucleosome structure as a mechanism of transcriptional regulation. Annu. Rev. Biochem. 1998;67:545–579. doi: 10.1146/annurev.biochem.67.1.545. [DOI] [PubMed] [Google Scholar]
- 48.Acton TB, Zhong H, Vershon AK. DNA-binding specificity of Mcm1: operator mutations that alter DNA-bending and transcriptional activities by a MADS box protein. Mol. Cell Biol. 1997;17:1881–1889. doi: 10.1128/mcb.17.4.1881. [DOI] [PMC free article] [PubMed] [Google Scholar]
- 49.Zhong H, McCord R, Vershon AK. Identification of target sites of the alpha2-Mcm1 repressor complex in the yeast genome. Genome Res. 1999;9:1040–1047. doi: 10.1101/gr.9.11.1040. [DOI] [PubMed] [Google Scholar]
- 50.Kotelnikova EA, Makeev VJ, Gelfand MS. Evolution of transcription factor DNA binding sites. Gene. 2005;347:255–263. doi: 10.1016/j.gene.2004.12.013. [DOI] [PubMed] [Google Scholar]
- 51.King DA, Zhang L, Guarente L, Marmorstein R. Structure of a HAP1-DNA complex reveals dramatically asymmetric DNA binding by a homodimeric protein. Nat. Struct. Biol. 1999;6:64–71. doi: 10.1038/4940. [DOI] [PubMed] [Google Scholar]
- 52.Tan S, Richmond TJ. Crystal structure of the yeast MATalpha2/MCM1/DNA ternary complex. Nature. 1998;391:660–666. doi: 10.1038/35563. [DOI] [PubMed] [Google Scholar]
- 53.Konig P, Giraldo R, Chapman L, Rhodes D. The crystal structure of the DNA-binding domain of yeast RAP1 in complex with telomeric DNA. Cell. 1996;85:125–136. doi: 10.1016/s0092-8674(00)81088-0. [DOI] [PubMed] [Google Scholar]
- 54.Tanay A, Regev A, Shamir R. Conservation and evolvability in regulatory networks: the evolution of ribosomal regulation in yeast. Proc. Natl Acad. Sci. USA. 2005;102:7203–7208. doi: 10.1073/pnas.0502521102. [DOI] [PMC free article] [PubMed] [Google Scholar]
- 55.Wasserman WW, Sandelin A. Applied bioinformatics for the identification of regulatory elements. Nat. Rev. Genet. 2004;5:276–287. doi: 10.1038/nrg1315. [DOI] [PubMed] [Google Scholar]
- 56.Tanay A, Gat-Viks I, Shamir R. A global view of the selection forces in the evolution of yeast cis-regulation. Genome Res. 2004;14:829–834. doi: 10.1101/gr.2064404. [DOI] [PMC free article] [PubMed] [Google Scholar]
- 57.Papatsenko D, Levine M. Quantitative analysis of binding motifs mediating diverse spatial readouts of the Dorsal gradient in the Drosophila embryo. Proc. Natl Acad. Sci. USA. 2005;102:4966–4971. doi: 10.1073/pnas.0409414102. [DOI] [PMC free article] [PubMed] [Google Scholar]
Associated Data
This section collects any data citations, data availability statements, or supplementary materials included in this article.