Abstract
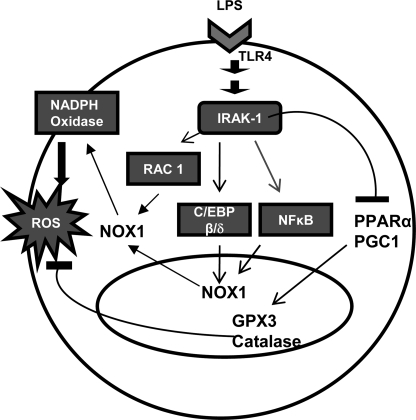
Inflammatory stimulants such as bacterial endotoxin (lipopolysaccharide (LPS)) are known to induce tissue damage and injury partly through the induction of reactive oxygen species (ROS). Although it is recognized that the induction of ROS in macrophages by LPS depends upon the expression and activation of NADPH oxidase, as well as the suppression of antioxidative enzymes involved in ROS clearance, the underlying molecular mechanisms are poorly defined. In this study, we examined the contribution of the interleukin-1 receptor-associated kinase 1 (IRAK-1) to LPS-induced generation of ROS. We observed that LPS induced significantly less ROS in IRAK-1−/− macrophages, indicating that IRAK-1 is critically involved in the induction of ROS. Mechanistically, we observed that IRAK-1 is required for LPS-induced expression of NOX-1, a key component of NADPH oxidase, via multiple transcription factors, including p65/RelA, C/EBPβ, and C/EBPδ. On the other hand, we demonstrated that IRAK-1 associated with and activated small GTPase Rac1, a known activator of NOX-1 oxidase enzymatic activity. IRAK-1 forms a close complex with Rac1 via a novel LWPPPP motif within the variable region of IRAK-1. On the other hand, we also observed that IRAK-1 is required for LPS-mediated suppression of peroxisome proliferator-activated receptor α and PGC-1α, nuclear factors essential for the expression of antioxidative enzymes such as GPX3 and catalase. Consequently, injection of LPS causes significantly less plasma lipid peroxidation in IRAK-1−/− mice compared with wild type mice. Taken together, our study reveals IRAK-1 as a novel component involved in the generation of ROS induced by LPS.
Introduction
Reactive oxygen species (ROS)2 play a critical role in the regulation of inflammatory processes causing the oxidation of lipids and proteins and eventually leading to tissue damage and organ failure. The generation of ROS is modulated by two families of opposing enzymes, oxidative enzymes such as NADPH oxidase and antioxidative enzymes, including glutathione peroxidase, catalase, and superoxide dismutase. Bacterial products such as lipopolysaccharide (LPS) selectively induce the expression and activation of oxidative enzymes, while decreasing the expression of antioxidative enzymes (1, 2). Taken together, LPS challenge significantly contributes to the production of ROS and the pathogenesis of diverse inflammatory diseases.
Most of the published studies regarding NADPH oxidase have been specifically focused on the regulation and activation of NOX-2, the enzymatic NADPH oxidase component primarily expressed in neutrophils (3, 4). NOX-2 protein is constitutively expressed and is not regulated transcriptionally (3). LPS challenge causes rapid translocation of the functional NOX-2 containing NADPH oxidase to the membrane complex, leading to its activation (3). In contrast, NOX-1, the primary NADPH oxidase in macrophages, can be both transcriptionally induced and post-transcriptionally activated by LPS. However, the molecular mechanism for LPS-induced expression and activation of NOX-1 is poorly defined. Based on studies done in other cell types (5, 6), it is conceivable that LPS may contribute to the activation of NOX-1 containing NADPH oxidase via the small GTPase Rac1 in macrophages (7). However, the detailed molecular mechanism underlying LPS-mediated activation of Rac1 in macrophages is not known.
On the other hand, LPS treatment decreases the levels of nuclear receptor family transcription factors such as PPARα and PGC-1, which are responsible for the sustained expression of antioxidative enzymes, including glutathione peroxidase and catalase (8–11). Collectively, the LPS-triggered up-regulation of oxidative enzymes and concurrent down-regulation of antioxidases leads to the generation and accumulation of ROS and tissue damage.
IRAK-1 is one of many intracellular signaling components downstream of the LPS receptor (TLR4) (12–14). A series of studies have revealed that IRAK-1 positively contributes to the activation of NFκB, STAT1/3, and IRF5/7, while negatively regulating the activities of nuclear factor of activated T-cells and nuclear receptors (15–20). Despite the prominent role that IRAK-1 plays within the TLR4 signaling pathway, its involvement in LPS-mediated ROS production in macrophages has never been defined.
In this study, we tested the hypothesis that IRAK-1 may activate the transcription of NOX-1 via NFκB and other related transcription factors and suppress the transcription of antioxidative enzymes through nuclear receptors. Furthermore, we tested whether IRAK-1 may facilitate LPS-mediated activation of the small GTPase Rac1, a key factor involved in the activation of NOX-1-containing NADPH oxidase. The generation of ROS following LPS challenge was measured both in vivo and in vitro using wild type (WT) and IRAK-1−/− mice and cells.
EXPERIMENTAL PROCEDURES
Reagents
LPS (Escherichia coli O111:B4) was obtained from Sigma. The antibodies against catalase, Nox-1, PPARα, PGC1α, C/EBPδ, C/EBPβ, LaminB, and β-actin were purchased from Santa Cruz Biotechnology. The primer sets were obtained from IDT. The primer sequences are as follows: Nox-1(+), 5′-TCCATTTCCTTCCTGGAGTGGCAT-3′, and Nox-1(−), 5′-GGCATTGGTGAGTGCTGTTGTTCA-3′; Gpx3(+), 5′-GCCAGCTACTGAGGTCTGACAGA-3′, and Gpx3(−), 5′-CAAATGGCCCAAGTTCTTCTTG-3′; catalase(+), 5′-TTCAGAAGAAAGCGGTCAAGAAT-3′, catalase(−), 5′-GATGCGGGCCCCATAGTC-3′; and Gapdh(+), 5′-AACTTTGGCATTGTGGAAGGGCTC-3′, and Gapdh(−), 5′-TGGAAGAGTGGGAGTTGCTGTTGA-3′.
Mice and Primary Murine Cells
Wild type C57BL/6 mice were obtained from the Charles River Laboratories. IRAK1−/− mice with C57BL/6 background were kindly provided by Dr. James Thomas from the University of Texas Southwestern Medical School. All mice were housed and bred at Derring Hall Animal Facility in compliance with approved Animal Care and Use Committee protocols at Virginia Polytechnic Institute and State University. Bone marrow-derived macrophages (BMDM) and murine embryonic fibroblasts (MEF) were harvested and cultured as we have described previously (21).
Western Blot Analysis
Isolation of whole cell lysates was performed as described earlier (18). Briefly, untreated or treated BMDMs and MEFs were rinsed in PBS and then lysed on ice in 1× SDS lysis buffer (80 mm Tris-HCl (pH 6.8), 2% SDS, 50% glycerol) containing protease inhibitor mixture. Western blot analysis of the protein samples was performed as described previously. Immunoblots were developed by using the Amersham Biosciences ECL Plus chemiluminescent detection system (GE Healthcare). The intensities of the bands were quantified using the Fujifilm MultiGauge software and then normalized against β-actin levels.
Real Time RT-PCR
Total RNA was extracted from untreated or treated BMDM and MEF cells using TRIzol (Invitrogen) according to the manufacturer's protocol. Similar protocol was followed to isolate total RNA from small pieces of mouse liver and kidney tissues (50–100 μg) using TRIzol. Reverse transcription was carried out using the high capacity cDNA reverse transcription kit (Applied Biosystems), and subsequent real time RT-PCR analyses were performed using the SYBR green supermix on an IQ5 thermocycler (Bio-Rad). The relative levels of transcripts were calculated using the ΔΔCt method after normalizing with Gapdh as the internal control.
Measurement of Intracellular ROS
To monitor the net intracellular accumulation of ROS, the fluorescent probe chloromethyl-2′,7′-dichlorofluorescein diacetate (Molecular Probes, Eugene, OR) was used. WT and IRAK1−/− BMDM cells (5 × 10⁵ cells/well on 12-well plates) were treated with LPS 10 ng/ml overnight in phenol-free medium containing 1% fetal bovine serum and then rinsed with PBS containing calcium and magnesium followed by addition of 10 μm chloromethyl-2′,7′-dichlorofluorescein diacetate. After 30 min of incubation at 37 °C, cells were washed twice with PBS to remove any extracellular dye. The formation of fluorescent product, dichlorofluorescein, was analyzed using a fluorescence spectrometer with excitation and emission wavelength of 488 and 525 nm, respectively. DCFDA undergoes deacetylation and reacts quantitatively with intracellular radicals (mainly H2O2) and is converted to its fluorescent product, dichlorofluorescein, which is retained within the cells and thus provides an index of cell cytosolic oxidation.
Assessment of Plasma Lipid Peroxidation
The extent of lipid peroxidation in plasma was determined by commercially available colorimetric assay kit BIOXYTECH® LPO-586 (OXIS Research, Portland, OR). Plasma samples were collected from WT and IRAK1−/− mice 16 h after intraperitoneal injection of LPS. Samples were then diluted with 3.25 volumes of diluted R1 reagent (10.3 mm N-methyl-2-phenylindole in acetonitrile) and mixed by gentle vortexing. After addition of 75 μl of 37% (v/v) HCl, the mixtures were incubated at 45 °C for 60 min, followed by centrifugation at 15,000 × g for 15 min. The absorbance of the clear supernatant was analyzed at 586 nm.
Rac1 Activity Assay
The activity of Rac1 was measured by the affinity precipitation assay based on the specific interaction of activated Rac with its downstream effectors using the Active Rac1 detection kit (Thermo Scientific). For the Rac activity assay, BMDM cells were lysed in a buffer containing 25 mm Tris-HCl (pH 7.5), 1% Nonidet P-40, 150 mm NaCl, 5 mm MgCl2, 5% glycerol, and 1 mm dithiothreitol supplemented with protease inhibitor mixture (Sigma). GST-p21-activated protein kinase binding domain beads were used for affinity precipitation assays, and the activated Rac was detected by immunoblotting using an anti-Rac1 antibody.
Cell Transfection, Immunoprecipitation, and Western Blot
MAT4 cells (HeLa cells stably transfected with TLR4 and MD2) were cultured in complete Dulbecco's modified Eagle's medium supplemented with 10% fetal bovine serum and antibiotics as described previously (22). Cells were transfected with the wild type pFLAG-IRAK-1 plasmid, the N-terminal deletion pFLAG-IRAK-1-ΔN plasmid, the C-terminal deletion pFLAG-IRAK-1ΔC plasmids, or the pFLAG-IRAK-1 mutant plasmids (L167A/W168A) as described previously (23). Twenty four hours after the transfection, the cells were treated with 100 ng/ml LPS for 5 min. Total cell lysates were prepared using lysis buffer containing 50 mm HEPES (pH 7.6), 150 mm NaCl, 0.5% Nonidet P-40, 1 mm EDTA, 100× protease inhibitors, and 800 μg of cell lysate was used to perform immunoprecipitation with an anti-Rac1 antibody or an isotype control antibody from the same company (Sigma). Co-immunoprecipitates were separated on SDS-PAGE and probed for the presence of various IRAK-1 forms and Rac1 using specific antibodies as described in the figure legends.
GPX3 and Catalase Activity Assay
GPX activity in LPS-treated MEF and BMDM cells was assessed using a commercially available colorimetric kit (Cayman Chemical), which measures GPX3 activity indirectly by a coupled reaction with glutathione reductase. 170 μl of reaction mixture containing 20 μl of cell lysates from BMDM or MEF cells, 100 μl of assay buffer (50 mm Tris-HCl (pH 7.6), 5 mm EDTA), and 50 μl of co-substrate (5.0 mm GSH, 0.1 mm NADPH, 0.1 unit of glutathione reductase) was added in a 96-well plate. The reaction was initiated by the addition of 20 μl of 0.2 mm cumene hydroperoxide. The oxidation of NADPH to NADP+ leading to a decrease in absorbance at 340 nm was recorded at 1-min intervals for 5 min. The rate of decrease in the absorbance is directly proportional to the GPX activity in the sample. The enzyme activity was expressed as nanomoles of NADPH oxidized per min/ml/mg protein.
The catalase activity in BMDM cells was determined using a commercially available colorimetric kit (Cayman Chemical) based on the peroxidation function of catalase for determination of enzyme activity. The amount of formaldehyde produced was measured spectrophotometrically at 540 nm with the assistance of Purpald®, a chromogen that generates a purple color upon reaction with an aldehyde.
Chromatin Immunoprecipitation Assays
WT and IRAK1−/− BMDM cells were either untreated or treated with 100 ng/ml for 2 h followed by cross-linking with 1% formaldehyde in complete media for 15 min with gentle rocking at room temperature. Cells were then washed twice with ice-cold PBS and treated with glycine solution for 5 min to stop the cross-linking reaction. Cells were then lysed in buffer containing SDS and protease inhibitor mixture. Samples were sonicated six times with 30-s pulses at 4 °C followed by centrifugation to collect the sheared chromatin. The sheared chromatin was used to set up immunoprecipitation reactions with the indicated antibodies using the CHIP-IT Express kit (Active Motif) as per the manufacturer's recommendations. The immunoprecipitated DNA fragments were analyzed by PCR using the primers spanning the binding sites of the specified transcription factors on the murine Nox-1 promoter.
siRNA Interference Assays
For siRNA interference, WT BMDM cells (2 × 10⁶ cells) were plated in 6-well plates and transfected the following day by Lipofectamine 2000 (Invitrogen) with the indicated siRNA oligonucleotides (Santa Cruz Biotechnology). After 36 h post-transfection, the cells were treated with LPS (100 ng/ml) for the indicated time points followed by DCFDA staining. Whole cell extracts were prepared for Western blot analysis using the specified antibodies.
Statistical Analyses
Statistical significance was determined using the unpaired two-tailed Student's t test. p values less than 0.05 were considered statistically significant. The log-rank test was performed to evaluate the statistical significance of the mice mortality.
RESULTS
IRAK-1 Is Involved in LPS-induced ROS Formation
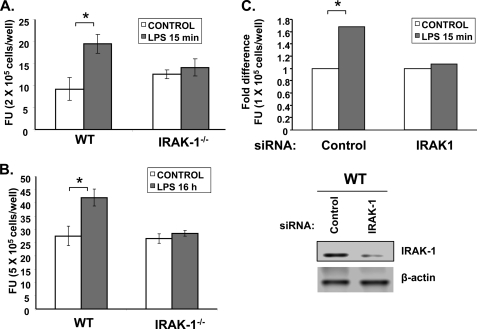
To determine whether IRAK-1 is involved in LPS-induced production of ROS, we measured the intracellular levels of ROS induced by LPS in BMDMs harvested from WT and IRAK-1−/− mice. Following LPS treatment, the cells were stained with the ROS-selective fluorescent dye DCFDA. The fluorescent intensities reflecting the levels of intracellular ROS were measured with a fluorescent plate reader. As shown in Fig. 1, A and B, LPS treatments induced a significant increase in ROS production in WT BMDM (20% increase after 15 min of treatment; 60% increase after 16 h of treatment). In contrast, there was no significant induction of ROS following either LPS treatment in IRAK-1−/− BMDM. To further confirm the specificity and involvement of IRAK-1 in LPS-induced ROS expression, we performed siRNA experiments to knock down the expression of IRAK-1 in WT BMDMs. As shown in Fig. 1C, IRAK-1-specific siRNA results in significant knockdown of IRAK-1 protein expression as compared with the control siRNA (lower panel). The transfected cells were either untreated or treated with LPS for 15 min followed by the measurement of intracellular ROS levels. Consistent with the previous data using IRAK1−/− BMDMs, LPS treatment failed to induce ROS levels in IRAK-1 siRNA-transfected cells as compared with the control siRNA (Fig. 1C).
FIGURE 1.
IRAK-1 is involved in LPS-induced ROS formation. A, effect of LPS on ROS production in WT and IRAK1−/− BMDM cells. Intracellular ROS levels were measured by DCFDA staining using fluorescence microscope after LPS (100 ng/ml) stimulation in WT and IRAK1−/− BMDM cells for 15 min and for 16 h in B. The Student's t test was used to calculate statistical significance; *, p < 0.05. Data are representative of three independent experiments. C, loss of IRAK-1 abrogates LPS-induced ROS expression in WT BMDM cells. The cells were transfected with either scrambled control siRNA or IRAK-1-specific siRNA followed by measurement of intracellular ROS levels in response to LPS using DCFDA staining (top panel). The lysates of control and IRAK-1-specific siRNA-transfected cells were analyzed by Western blotting to detect the expression of IRAK-1 (bottom panel). The same blot was probed with β-actin as the loading control. FU, fluorescence units.
IRAK-1 Contributes to LPS-induced Expression of NOX-1
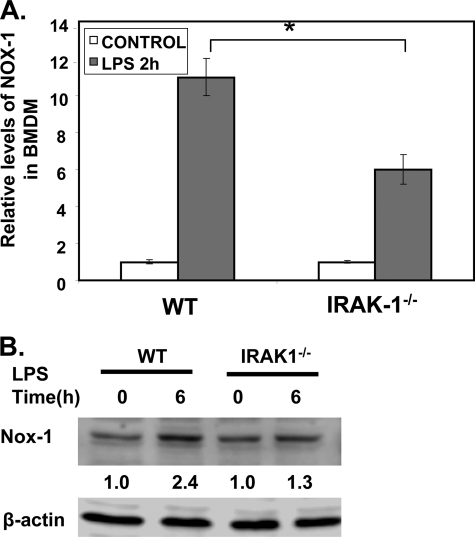
LPS is known to induce the expression of NOX-1, although the underlying mechanism is not well understood (24). The induction of NOX-1 contributes to the generation of ROS following LPS treatment. Because our study indicates that IRAK-1 deficiency ablates the induction of ROS following LPS treatments, we tested the hypothesis that IRAK-1 may be required for LPS-induced expression of NOX-1. WT and IRAK-1−/− BMDM were stimulated with LPS for 2 h. Total RNAs were harvested and used to measure the levels of Nox-1 messages by real time RT-PCR. As shown in Fig. 2A, the induction of Nox-1 by LPS was significantly lower in IRAK-1−/− BMDM (3-fold induction in IRAK-1−/− BMDM compared with 6-fold induction in WT BMDM). Similarly, the protein levels of NOX-1 were significantly higher in WT as compared with IRAK-1−/− BMDMs in response to LPS (Fig. 2B). In contrast, the levels of Nox-2 remain constant with or without LPS challenge in WT or IRAK-1 cells (data not shown).
FIGURE 2.
IRAK-1 contributes to LPS-induced expression of NOX-1. A, effect of LPS on Nox-1 expression in WT and IRAK1−/− BMDM cells. The cells were stimulated with LPS (100 ng/ml) for 2 h. After stimulation, the mRNA levels of Nox-1 were analyzed using real time RT-PCR. Each data point represents the mean ± S.D. of at least three independent experiments. *, p < 0.05, compared with control. B, protein levels of NOX-1 were analyzed after LPS stimulation in WT and IRAK1−/− BMDM cells by Western blot using an anti-NOX-1 antibody. The same blots were probed with β-actin as the loading control. The band intensities were quantified using the Fujifilm MultiGauge software and then expressed as the fold difference as compared with the untreated control group, assigned a value of 1.
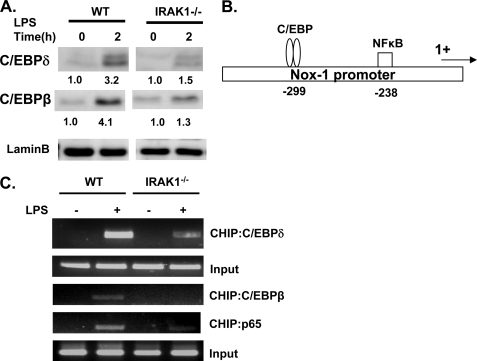
Although the transcriptional mechanism for NOX-1 expression is not known, previous studies have identified putative C/EBP-binding sites within the proximal promoter of Nox-1 (25). We therefore examined the status of C/EBPβ and C/EBPδ in WT and IRAK-1−/− macrophages. As shown in Fig. 3A, LPS treatment led to a significant induction of C/EBPβ and C/EBPδ levels in the nuclear lysates from WT cells. Strikingly, LPS-mediated C/EBPβ and C/EBPδ induction was significantly impaired in IRAK1−/− cells (Fig. 3A). Furthermore, we examined the in vivo binding of C/EBPδ to the proximal promoter of Nox-1 in WT and IRAK-1−/− BMDMs using chromatin immunoprecipitation analysis. As shown in Fig. 3C, there was no basal interaction of C/EBPδ with Nox-1 promoter. LPS treatment led to a significant recruitment of C/EBPδ to the endogenous Nox-1 promoter in WT BMDMs. In contrast, the binding of C/EBPδ to the Nox-1 promoter in response to LPS treatment in IRAK-1−/− BMDMs was dramatically reduced (Fig. 3C).
FIGURE 3.
IRAK-1 mediates LPS-induced activation of p65 and C/EBPβ/δ. A, WT and IRAK1−/− BMDM cells were treated with 100 ng/ml LPS for 2 h. Equal amounts of total cell lysates were resolved on SDS-PAGE and blotted with antibodies specific for C/EBPδ and C/EBPβ. Data are representative of three independent experiments. B, putative binding sites of transcription factors within the proximal promoter of murine Nox-1. 1+ denotes the transcription start site. C, decreased binding of multiple transcription factors to the proximal promoter of murine Nox-1 in IRAK1−/− BMDMs. The BMDMs were either uninduced or induced with 100 ng/ml LPS for 2 h and subjected to chromatin immunoprecipitation (CHIP) assay using the indicated antibodies and primers specific to the proximal promoter of murine Nox-1. Data are representative of three independent experiments.
It is increasingly recognized that cooperation among multiple transcription factors is required for inducible gene expression. Besides the C/EBP-binding site, we also observed a putative binding site for NFκB within the Nox-1 proximal promoter region (Fig. 3B). We subsequently examined whether LPS may induce the association of p65/RelA to the Nox-1 promoter. As shown in Fig. 3C, LPS induced a significant recruitment of p65/RelA to the Nox-1 promoter in WT BMDM but not in IRAK-1−/− BMDMs. Our data revealed that LPS induces a combinatorial effect of multiple transcription factors in the regulation of Nox-1 expression.
IRAK-1 Interacts with and Activates the Small GTPase Rac1, the Activator of NOX-1 Enzyme
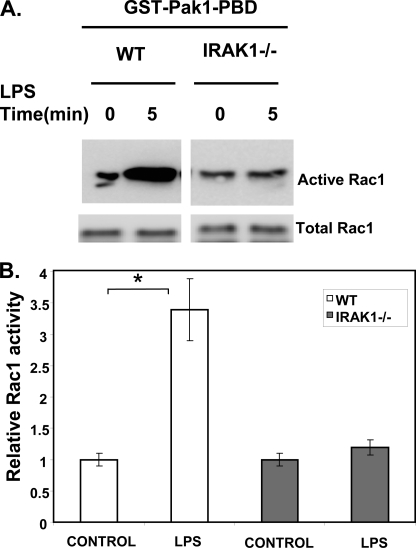
Once the NOX-1 protein is expressed, its enzymatic activity can be activated by LPS through the small GTPase Rac1 (26, 27). Thus, we further tested whether IRAK-1 also participates in LPS-induced activation of Rac1. Using the Rac1 activation assay, we observed that LPS treatment for 5 min resulted in significant activation of Rac1 in WT but not in IRAK-1−/− BMDM (Fig. 4, A and B).
FIGURE 4.
IRAK-1 is required for LPS-mediated activation of Rac1, a small GTPase necessary for activating NOX-1 enzyme. A, Rac1 activity was determined using the PBD pulldown assay following LPS stimulation (100 ng/ml) for 5 min in WT and IRAK1−/− BMDM cells followed by immunoblotting with an anti-Rac1 antibody. The bottom immunoblot panel shows total Rac1 expression in whole cell lysates. B, amount of activated Rac1 was normalized to the amount of total Rac1 in whole cell lysates. The bar graphs are densitometric analyses of the active Rac1-specific bands from three independent experiments.
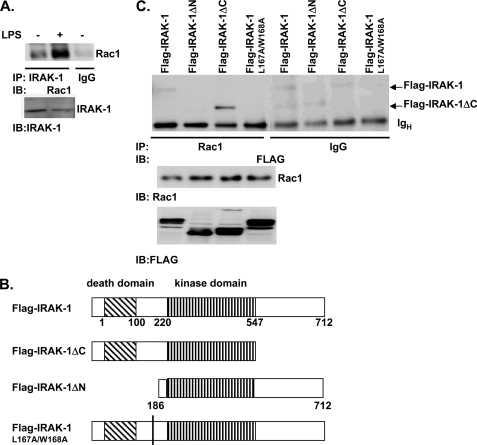
To examine the molecular mechanism for the IRAK-1-mediated activation of Rac1, we examined whether IRAK-1 and Rac1 may form a close complex following LPS treatment. WT BMDM cells were stimulated with LPS for 5 min, and IRAK-1-associated proteins were immunoprecipitated with IRAK-1-specific antibody (Upstate, Millipore). An isotype-matched control antibody from the same company was used as a negative control. As shown in Fig. 5A, LPS treatment induced dramatic co-immunoprecipitation of IRAK-1 and Rac1.
FIGURE 5.
IRAK-1 interacts with Rac1. A, WT murine BMDM cells were either untreated or treated with 100 ng/ml LPS for 5 min. Equal amounts of total cell lysates were used to perform immunoprecipitation (IP) analyses using an anti-IRAK-1 antibody. Co-immunoprecipitated protein complexes were resolved on a SDS-PAGE and blotted with an anti-Rac1 antibody (top panel). An isotype control antibody from the same company was used to perform similar immunoprecipitation study, which gave no signal near the Rac1 region (data not shown). The levels of IRAK-1 in the cell lysates are shown in the bottom panel. IB, immunoblot. B, diagrammatic illustration of various FLAG-tagged IRAK-1 full-length and deletion constructs used in the transfection studies. C, MAT4 cells were transiently transfected with either pFLAG-IRAK-1, pFLAG-IRAK-1 ΔN, pFLAG-IRAK-1 ΔC, or pFLAG-IRAK-1(L167A/W168A) mutant. Equal amounts of lysates were harvested from the transfected cells and used to perform immunoprecipitation analyses using an anti-Rac1 antibody. Co-immunoprecipitated protein complexes were resolved on SDS-PAGE and blotted with an anti-FLAG antibody (top panel). An isotype control rabbit IgG was used to perform a similar immunoprecipitation study and did not give a nonspecific signal near the region of interest. The expression levels of Rac1 and various FLAG-IRAK-1 mutants within the cell lysates are indicated in the bottom panels. The data represent three independent experiments.
We further studied the protein domain(s) required for the interaction between IRAK-1 and Rac1. FLAG-tagged WT and mutant IRAK-1 plasmids were transiently transfected into MAT4 cells (HeLa cells stably transfected with TLR4 and MD2) (Fig. 5B). Transfected cells were treated with LPS for 5 min. Co-immunoprecipitation analyses were performed using the anti-FLAG antibody as described under “Experimental Procedures.” An isotype-matched control antibody purchased from the same company was used as a negative control. The resulting immunoprecipitated proteins were resolved on SDS-PAGE and blotted with either the anti-FLAG antibody (detecting various IRAK-1 forms) or the anti-Rac1 antibody. As shown in Fig. 5C, LPS treatment led to co-immunoprecipitation of Rac1 with the full-length FLAG-IRAK-1 and the FLAG-IRAK-1ΔC. Particularly, Rac1 interacted strongly with the FLAG-IRAK-1ΔC mutant, suggesting that the C terminus may inhibit the interaction of Rac1 and the full-length IRAK-1. On the other hand, we observed that the FLAG-IRAK-1ΔN failed to co-immunoprecipitate with Rac1. Therefore, our data indicate that the N-terminal region of IRAK-1 molecule is required to interact with Rac1. We further noticed that the IRAK-1 N terminus contains a novel LWPPPP motif. Interestingly, similar L(W/F/Y)PPPP motifs are present in proteins involved in cytoskeletal re-arrangement that recruit small GTPases such as CDC42 and Rac1. Intriguingly, we found that the FLAG-IRAK-1(L167A/W168A) mutant also failed to co-immunoprecipitate with Rac1 (Fig. 5C).
IRAK-1 Is Required for Suppression of GPX3 and Catalase
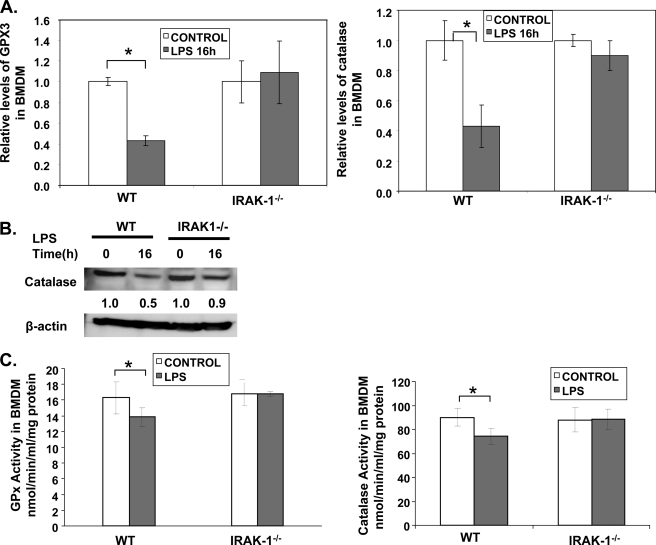
The levels of intracellular ROS are not only regulated by the activities and levels of NADPH oxidase but also by the levels of antioxidases. LPS is known to suppress the expression of antioxidases such as GPX and catalase through suppressing nuclear receptor-mediated gene transcription (8). Because IRAK-1 participates in LPS-mediated suppression of nuclear receptor (20), we tested whether IRAK-1 may also contribute to the suppression of antioxidases by LPS. As shown in Fig. 6, A and B, LPS treatment led to a significant reduction of both GPX3 and catalase in WT BMDM (∼60% reduction for both GPX3 and catalase). In contrast, their expression levels were not significantly altered by LPS treatment in IRAK-1−/− BMDM.
FIGURE 6.
IRAK-1 is required for LPS-mediated suppression of GPX3 and catalase. A, effect of LPS on GPX3 and catalase expression in WT and IRAK1−/− BMDM cells. The cells were stimulated with LPS (100 ng/ml) for the indicated time points. After stimulation, the mRNA levels of GPX3 and catalase were analyzed using real time RT-PCR. Each data point represents the mean ± S.D. of at least three independent experiments. *, p < 0.05, compared with control. B, protein levels of catalase were measured after LPS stimulation in WT and IRAK1−/− BMDMs by Western blot. The same blots were probed with β-actin as the loading control. C, effect of LPS on GPX3 and catalase activity in WT and IRAK1−/− BMDM cells. The cells were stimulated with LPS overnight, and the GPX3 and catalase activities were analyzed in the cell lysate using the Cayman kit. Data are representative of three independent experiments.
To test whether the reduced expression correlates with the actual activities of GPX3 and catalase, we performed activity assays as shown in Fig. 6C. LPS treatment led to a significant decrease in the activities of both GPX and catalase in WT but not IRAK-1−/− BMDMs.
Key Nuclear Receptor Transcription Factors Involved in GPX3 and Catalase Expression Are Selectively Suppressed in WT but Not IRAK-1−/− Cells
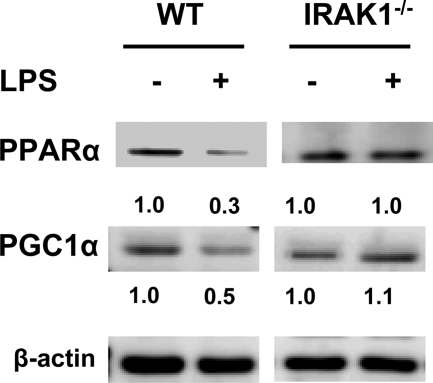
LPS is known to reduce the levels of nuclear receptors such as PPARα and co-activators like PGC-1α (8), which are involved in the transcription of GPX and catalase (9, 11). We then tested whether IRAK-1 participates in LPS-mediated suppression of PPARα and PGC-1α. As shown in Fig. 7, LPS treatment led to a 70% reduction of PPARα and a 50% reduction of PGC-1α in WT BMDM. In contrast, their levels remained unchanged following similar LPS treatment in IRAK-1−/− BMDM.
FIGURE 7.
Suppression of key nuclear receptors by LPS was mediated by IRAK-1. WT and IRAK1−/− BMDMs were stimulated with LPS for the indicated time points followed by whole cell lysate extraction. The lysates were resolved on SDS-PAGE and analyzed using specific antibodies as indicated. The same blots were probed with β-actin as the loading control. The band intensities were quantified using the Fujifilm MultiGauge software and expressed below the respective blots after normalization against β-actin levels.
Reduced Plasma Lipid Peroxidation in IRAK-1−/− Mice following Lethal LPS Challenge
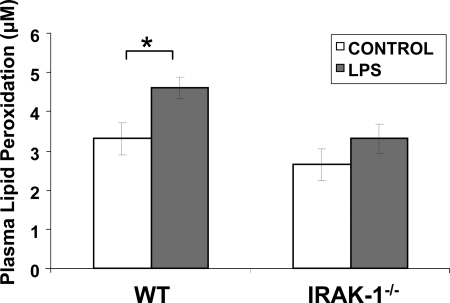
We subsequently tested the in vivo consequence of IRAK-1 gene deletion using WT and IRAK-1−/− mice. To determine whether IRAK-1 contributes to LPS-induced mortality via elevated generation of ROS and oxidative damage, we examined the plasma levels of lipid peroxidation from WT and IRAK-1−/− mice injected with LPS. As shown in Fig. 8, 16 h after the LPS injection, there was a significant increase in plasma lipid peroxidation in WT mice but not in IRAK-1−/− mice.
FIGURE 8.
Loss of IRAK-1 protects against LPS-induced lipid peroxidation. Plasma samples were collected from WT and IRAK1−/− mice after 16 h following intraperitoneal injection of LPS or PBS, and the extent of lipid peroxidation was measured using colorimetric assay.
DISCUSSION
In this study, we have defined the molecular mechanism underlying the complex regulation of LPS-induced ROS generation in macrophages. We identified that IRAK-1 is critically involved in this process by inducing both the expression and activation of NOX-1 and suppressing the expression of antioxidative enzymes, GPX3 and catalase. Collectively, IRAK-1−/− cells and mice exhibit reduced ROS production following LPS challenge.
Our data provide first-hand evidence revealing the molecular mechanism responsible for the transcriptional regulation of Nox-1 by LPS in macrophages. In particular, we demonstrate that multiple transcription factors, including p65 and C/EBPβ/δ, are coordinately involved in the LPS-induced transcription of Nox-1. Historically, p65/NFκB is the most extensively studied transcription factor downstream of TLR4. However, it has been increasingly recognized that p65/NFκB alone is usually not sufficient for effective transcription of selected target genes. Instead, cooperation among multiple transcription factors, co-activators, and/or co-repressors is essential for precise control of gene transcription (28, 29). Our study also confirms a recent report demonstrating that the TLR4 pathway leads to the activation of C/EBPβ and C/EBPδ and indicates that IRAK-1 is necessary for LPS-induced activation of C/EBPβ/δ. Further work is warranted to clarify how p65 and C/EBPs cooperate in inducing the ordered transcription of Nox-1 by LPS in macrophages.
Besides transcriptional regulation, our study indicates that IRAK-1 also facilitates the activation of NOX-1 through activating the small GTPase Rac1 (Fig. 9). Rac1 is a well known activator for the NOX-1 enzyme, and LPS is known to induce Rac1 activation (27). Using transfection assays and dominant negative constructs, O'Neill and co-workers (30) initially reported that dominant negative IRAK-1 antagonizes the function of Rac1. This study confirms and expands upon that finding and provides the first biochemical evidence indicating that IRAK-1 physically associates with Rac1 upon LPS challenge and is upstream of Rac1 activation. Furthermore, our data confirm that the novel N-terminal LWPPPP motif of IRAK-1 is required for its interaction with Rac1. The surrounding region near the LWPPPP of IRAK-1 has been shown to be highly phosphorylated following LPS treatment (31, 32). However, its functional implication is still poorly understood. Our study indicates that LPS-induced IRAK-1 phosphorylation near its LWPPPP motif may be required for the subsequent recruitment and activation of Rac1 in macrophages. In addition, our data reveal enhanced interaction between Rac1 and IRAK-1ΔC suggesting that the C terminus of IRAK-1 may negatively regulate its interaction with Rac1.
FIGURE 9.
Schematic diagram illustrating the contribution of IRAK-1 to LPS-induced ROS formation.
Intriguingly, our data also demonstrate that IRAK-1 further contributes to LPS-induced ROS formation by suppressing the expression of antioxidases such as GPX3 and catalase. IRAK-1 suppresses their expression by decreasing the levels of nuclear receptors such as PPARα and PGC-1α (8). Although the molecular mechanism underlying IRAK-1-mediated suppression of these nuclear receptors is not clear yet, it is interesting to note that IRAK-1 is distributed in both the cytoplasm and nucleus (18, 33). In addition, IRAK-1 can interact with Tollip, a molecule implicated in protein ubiquitination, sumoylation, and trafficking (34–36). It is therefore plausible that IRAK-1, together with Tollip, may selectively regulate the protein stability and/or trafficking of nuclear receptors such as PPAR and PGC-1 following LPS treatment. Future biochemical studies are warranted to test such hypothesis.
Collectively, our study reveals the potential mechanism underlying the beneficial effects observed in animal models with IRAK-1 gene deletion (14, 37, 38). IRAK-1-deficient mice are reported to be protected from various inflammatory diseases, including experimental autoimmune encephalomyelitis, endotoxemia, atherosclerosis, and systemic lupus erythematosus (37, 39–41). This study further revealed that the IRAK-1-deficient mice undergo significantly less plasma lipid peroxidation following lethal LPS injection. Our data provide compelling evidence indicating that IRAK-1 is not only a key mediator for LPS-induced production of inflammatory cytokines but also regulates the generation of reactive oxygen species leading to oxidative damages. Taken together, we postulate that IRAK-1 can serve as a viable target for future intervention of inflammatory diseases.
Acknowledgments
We thank Sarah Davis for technical support and Samantha Chang for proofreading.
This work was supported, in whole or in part, by National Institutes of Health Grants AI50089 and AI64414.
- ROS
- reactive oxygen species
- LPS
- lipopolysaccharide
- IRAK-1
- interleukin-1 receptor associated kinase 1
- PPAR
- peroxisome proliferator-activated receptor
- MEF
- murine embryonic fibroblast
- BMDM
- Bone marrow-derived macrophage
- RT
- reverse transcription
- C/EBP
- CCAAT/enhancer-binding protein
- WT
- wild type
- siRNA
- small interfering RNA
- PBS
- phosphate-buffered saline
- DCFDA
- 2′,7′-dichlorofluorescein diacetate
- GPX
- glutathione peroxidase.
REFERENCES
- 1.Wiesel P., Patel A. P., DiFonzo N., Marria P. B., Sim C. U., Pellacani A., Maemura K., LeBlanc B. W., Marino K., Doerschuk C. M., Yet S. F., Lee M. E., Perrella M. A. (2000) Circulation 102, 3015–3022 [DOI] [PubMed] [Google Scholar]
- 2.Yoshikawa T., Takano H., Takahashi S., Ichikawa H., Kondo M. (1994) Circ. Shock 42, 53–58 [PubMed] [Google Scholar]
- 3.Singh A., Zarember K. A., Kuhns D. B., Gallin J. I. (2009) J. Immunol. 182, 6410–6417 [DOI] [PMC free article] [PubMed] [Google Scholar]
- 4.Raad H., Paclet M. H., Boussetta T., Kroviarski Y., Morel F., Quinn M. T., Gougerot-Pocidalo M. A., Dang P. M., El-Benna J. (2009) FASEB J. 23, 1011–1022 [DOI] [PMC free article] [PubMed] [Google Scholar]
- 5.Qin L., Li G., Qian X., Liu Y., Wu X., Liu B., Hong J. S., Block M. L. (2005) Glia 52, 78–84 [DOI] [PubMed] [Google Scholar]
- 6.Chéret C., Gervais A., Lelli A., Colin C., Amar L., Ravassard P., Mallet J., Cumano A., Krause K. H., Mallat M. (2008) J. Neurosci. 28, 12039–12051 [DOI] [PMC free article] [PubMed] [Google Scholar]
- 7.Bokoch G. M., Zhao T. (2006) Antioxid. Redox Signal. 8, 1533–1548 [DOI] [PubMed] [Google Scholar]
- 8.Feingold K. R., Wang Y., Moser A., Shigenaga J. K., Grunfeld C. (2008) J. Lipid Res. 49, 2179–2187 [DOI] [PMC free article] [PubMed] [Google Scholar]
- 9.Chung S. S., Kim M., Youn B. S., Lee N. S., Park J. W., Lee I. K., Lee Y. S., Kim J. B., Cho Y. M., Lee H. K., Park K. S. (2009) Mol. Cell. Biol. 29, 20–30 [DOI] [PMC free article] [PubMed] [Google Scholar]
- 10.Klucis E., Crane D., Masters C. (1984) Mol. Cell. Biochem. 65, 73–82 [DOI] [PubMed] [Google Scholar]
- 11.Girnun G. D., Domann F. E., Moore S. A., Robbins M. E. (2002) Mol. Endocrinol. 16, 2793–2801 [DOI] [PubMed] [Google Scholar]
- 12.Akira S., Takeda K. (2004) Nat. Rev. Immunol. 4, 499–511 [DOI] [PubMed] [Google Scholar]
- 13.O'Neill L. (2000) Biochem. Soc. Trans. 28, 557–563 [DOI] [PubMed] [Google Scholar]
- 14.Li L. (2004) Curr. Drug Targets Inflamm. Allergy 3, 81–86 [DOI] [PubMed] [Google Scholar]
- 15.Uematsu S., Sato S., Yamamoto M., Hirotani T., Kato H., Takeshita F., Matsuda M., Coban C., Ishii K. J., Kawai T., Takeuchi O., Akira S. (2005) J. Exp. Med. 201, 915–923 [DOI] [PMC free article] [PubMed] [Google Scholar]
- 16.Song Y. J., Jen K. Y., Soni V., Kieff E., Cahir-McFarland E. (2006) Proc. Natl. Acad. Sci. U.S.A. 103, 2689–2694 [DOI] [PMC free article] [PubMed] [Google Scholar]
- 17.Knop J., Wesche H., Lang D., Martin M. U. (1998) Eur. J. Immunol. 28, 3100–3109 [DOI] [PubMed] [Google Scholar]
- 18.Huang Y., Li T., Sane D. C., Li L. (2004) J. Biol. Chem. 279, 51697–51703 [DOI] [PubMed] [Google Scholar]
- 19.Nguyen H., Chatterjee-Kishore M., Jiang Z., Qing Y., Ramana C. V., Bayes J., Commane M., Li X., Stark G. R. (2003) J. Interferon Cytokine Res. 23, 183–192 [DOI] [PubMed] [Google Scholar]
- 20.Maitra U., Parks J. S., Li L. (2009) Mol. Cell. Biol., 29, 5989–5997 [DOI] [PMC free article] [PubMed] [Google Scholar]
- 21.Wang D., Fasciano S., Li L. (2008) Mol. Immunol. 45, 3902–3908 [DOI] [PMC free article] [PubMed] [Google Scholar]
- 22.Su J., Xie Q., Wilson I., Li L. (2007) Cell. Signal. 19, 1596–1601 [DOI] [PMC free article] [PubMed] [Google Scholar]
- 23.Hu J., Jacinto R., McCall C., Li L. (2002) J. Immunol. 168, 3910–3914 [DOI] [PubMed] [Google Scholar]
- 24.Qin L., Liu Y., Wang T., Wei S. J., Block M. L., Wilson B., Liu B., Hong J. S. (2004) J. Biol. Chem. 279, 1415–1421 [DOI] [PubMed] [Google Scholar]
- 25.Adachi Y., Shibai Y., Mitsushita J., Shang W. H., Hirose K., Kamata T. (2008) Oncogene 27, 4921–4932 [DOI] [PubMed] [Google Scholar]
- 26.Cheng G., Diebold B. A., Hughes Y., Lambeth J. D. (2006) J. Biol. Chem. 281, 17718–17726 [DOI] [PubMed] [Google Scholar]
- 27.Kawahara T., Kohjima M., Kuwano Y., Mino H., Teshima-Kondo S., Takeya R., Tsunawaki S., Wada A., Sumimoto H., Rokutan K. (2005) Am. J. Physiol. Cell Physiol. 288, C450–C457 [DOI] [PubMed] [Google Scholar]
- 28.Pietilä T. E., Veckman V., Lehtonen A., Lin R., Hiscott J., Julkunen I. (2007) J. Immunol. 178, 253–261 [DOI] [PubMed] [Google Scholar]
- 29.Lu Y. C., Kim I., Lye E., Shen F., Suzuki N., Suzuki S., Gerondakis S., Akira S., Gaffen S. L., Yeh W. C., Ohashi P. S. (2009) J. Immunol. 182, 7212–7221 [DOI] [PMC free article] [PubMed] [Google Scholar]
- 30.Jefferies C., Bowie A., Brady G., Cooke E. L., Li X., O'Neill L. A. (2001) Mol. Cell. Biol. 21, 4544–4552 [DOI] [PMC free article] [PubMed] [Google Scholar]
- 31.Cooke E. L., Uings I. J., Xia C. L., Woo P., Ray K. P. (2001) Biochem. J. 359, 403–410 [DOI] [PMC free article] [PubMed] [Google Scholar]
- 32.Kollewe C., Mackensen A. C., Neumann D., Knop J., Cao P., Li S., Wesche H., Martin M. U. (2004) J. Biol. Chem. 279, 5227–5236 [DOI] [PubMed] [Google Scholar]
- 33.Böl G., Kreuzer O. J., Brigelius-Flohé R. (2000) FEBS Lett. 477, 73–78 [DOI] [PubMed] [Google Scholar]
- 34.Neumann D., Kollewe C., Resch K., Martin M. U. (2007) Biochem. Biophys. Res. Commun. 354, 1089–1094 [DOI] [PubMed] [Google Scholar]
- 35.Burns K., Clatworthy J., Martin L., Martinon F., Plumpton C., Maschera B., Lewis A., Ray K., Tschopp J., Volpe F. (2000) Nat. Cell Biol. 2, 346–351 [DOI] [PubMed] [Google Scholar]
- 36.Ciarrocchi A., D'Angelo R., Cordiglieri C., Rispoli A., Santi S., Riccio M., Carone S., Mancia A. L., Paci S., Cipollini E., Ambrosetti D., Melli M. (2009) PLoS ONE 4, e4404. [DOI] [PMC free article] [PubMed] [Google Scholar]
- 37.Deng C., Radu C., Diab A., Tsen M. F., Hussain R., Cowdery J. S., Racke M. K., Thomas J. A. (2003) J. Immunol. 170, 2833–2842 [DOI] [PubMed] [Google Scholar]
- 38.Gottipati S., Rao N. L., Fung-Leung W. P. (2008) Cell. Signal. 20, 269–276 [DOI] [PubMed] [Google Scholar]
- 39.Jacob C. O., Zhu J., Armstrong D. L., Yan M., Han J., Zhou X. J., Thomas J. A., Reiff A., Myones B. L., Ojwang J. O., Kaufman K. M., Klein-Gitelman M., McCurdy D., Wagner-Weiner L., Silverman E., Ziegler J., Kelly J. A., Merrill J. T., Harley J. B., Ramsey-Goldman R., Vila L. M., Bae S. C., Vyse T. J., Gilkeson G. S., Gaffney P. M., Moser K. L., Langefeld C. D., Zidovetzki R., Mohan C. (2009) Proc. Natl. Acad. Sci. U.S.A. 106, 6256–6261 [DOI] [PMC free article] [PubMed] [Google Scholar]
- 40.Thomas J. A., Haudek S. B., Koroglu T., Tsen M. F., Bryant D. D., White D. J., Kusewitt D. F., Horton J. W., Giroir B. P. (2003) Am. J. Physiol. Heart Circ. Physiol. 285, H597–H606 [DOI] [PubMed] [Google Scholar]
- 41.Lakoski S. G., Li L., Langefeld C. D., Liu Y., Howard T. D., Brosnihan K. B., Xu J., Bowden D. W., Herrington D. M. (2007) Exp. Mol. Pathol. 82, 280–283 [DOI] [PMC free article] [PubMed] [Google Scholar]


