Abstract
Nutrient overload is associated with the development of obesity, insulin resistance, and type II diabetes. High plasma concentrations of amino acids have been found to correlate with insulin resistance. At the cellular level, excess amino acids impair insulin signaling, the mechanisms of which are not fully understood. Here, we report that STAT3 plays a key role in amino acid dampening of insulin signaling in hepatic cells. Excess amino acids inhibited insulin-stimulated Akt phosphorylation and glycogen synthesis in mouse primary hepatocytes as well as in human hepatocarcinoma HepG2 cells. STAT3 knockdown protected insulin sensitivity from inhibition by amino acids. Amino acids stimulated the phosphorylation of STAT3 at Ser727, but not Tyr705. Replacement of the endogenous STAT3 with wild-type, but not S727A, recombinant STAT3 restored the ability of amino acids to inhibit insulin signaling, suggesting that Ser727 phosphorylation was critical for STAT3-mediated amino acid effect. Furthermore, overexpression of STAT3-S727D was sufficient to inhibit insulin signaling in the absence of excess amino acids. Our results also indicated that mammalian target of rapamycin was likely responsible for the phosphorylation of STAT3 at Ser727 in response to excess amino acids. Finally, we found that STAT3 activity and the expression of its target gene socs3, known to be involved in insulin resistance, were both stimulated by excess amino acids and inhibited by rapamycin. In conclusion, our study reveals STAT3 as a novel mediator of nutrient signals and identifies a Ser727 phosphorylation-dependent and Tyr705 phosphorylation-independent STAT3 activation mechanism in the modulation of insulin signaling.
Introduction
Insulin resistance is a major risk factor and a principal defect in type II diabetes. Nutrient overload in affluent societies has been associated with increased occurrence of metabolic syndrome (1, 2). High protein diets are associated with altered glucose metabolism and increased occurrence of type II diabetes (3, 4). Elevated plasma concentrations of amino acids have long been found in obesity and insulin-resistant states (5–8). Furthermore, amino acid infusion induces insulin resistance in healthy individuals (9). Most recently, it has been reported that branched-chain amino acids in diet contribute to insulin resistance in high fat diet-fed rats and that a similar consequence of such a dietary pattern may exist in human (10). Currently, a role of dietary proteins in the pathogenesis of insulin resistance has been well recognized (11), but the underlying molecular mechanisms are not yet fully understood.
The signal transducer and activator of transcription (STAT)3 proteins are activated by a wide range of cytokines and growth factors. STAT3, activated by the IL-6 family of cytokines among others, is phosphorylated on two key residues, Tyr705 and Ser727. Tyr705 phosphorylation, typically by the Janus kinase kinases, is involved in STAT3 dimerization and activation (12), whereas Ser727 phosphorylation is believed to modulate STAT3 activity (13, 14). Several protein kinases have been reported to phosphorylate STAT3 on Ser727 in response to various stimuli under different cellular contexts (14); among them the mammalian target of rapamycin (mTOR) has been shown to phosphorylate STAT3 in neuronal cells (15, 16) and IL-6-stimulated hepatocytes (17).
As a negative feedback control, STATs induce the expression of SOCS proteins, which are characterized by their ability to down-regulate cytokine signaling (18). SOCSs also play an important role in the pathogenesis of insulin resistance by integrating cytokine signaling with insulin signaling (19). Overexpression of SOCS3 inhibited insulin-induced glycogen synthase activity in myotubes and glucose uptake in adipocytes (20), whereas hepatocyte-specific socs3 deletion improved insulin sensitivity in the liver (21). Mechanistically, SOCS proteins inhibit insulin-induced signaling by directly interfering with IR activation, blocking IRS activation or inducing IRS degradation (22). A STAT3-SOCS3 pathway has been reported to be responsible for IL-6-induced insulin resistance (17, 23, 24).
A major intracellular signaling pathway sensing the availability of amino acids at the cellular level involves the Ser/Thr kinase mTOR. Two functionally distinct protein complexes, mTORC1 and mTORC2, are characterized by mTOR association with Raptor and Rictor, which mediate the rapamycin-sensitive and rapamycin-insensitive signaling of mTOR, respectively (25). mTORC1 transduces both mitogen and amino acid sufficiency signals. One of the best characterized target of mTORC1 is ribosomal S6 kinase 1, a regulator of protein synthesis (26). mTORC1 signaling has emerged as an important modulator of insulin sensitivity. In vivo, amino acid intake has been correlated with increased mTORC1 activity and dampened insulin sensitivity (27, 28). In vitro, amino acids activate mTORC1 signaling (29, 30) and concurrently inhibit insulin signaling in adipocytes, hepatocytes, and skeletal muscle cells (31–34). Several other conditions known to activate mTORC1 have also been shown to lead to inhibition of insulin signaling, including hyperinsulinemia, acute and chronic insulin stimulation, deletion of the tumor suppressor TSC1/2, and exposure to the proinflammatory cytokine IL-6 (2, 17). In all cases, the specific inhibitor of mTORC1, rapamycin, rescues insulin signaling. With the exception of IL-6 suppression of insulin signaling, which is mediated by an mTOR-STAT3-SOCS3 pathway (17), the current model for the role of mTOR in insulin sensitivity is a negative feedback loop where activated S6 kinase 1 phosphorylates IRS-1 on serine residues, which results in degradation of IRS-1, leading to impaired phosphoinositide 3-kinase stimulation (2).
A connection between STAT3 and amino acid signals has never been reported. In this study, we uncover an unexpected role of STAT3 in amino acid modulation of insulin sensitivity in hepatic cells. We further show that Ser727 phosphorylation in response to excess amino acids is essential for STAT3 function in suppressing insulin signaling and that mTOR is the kinase for Ser727 in this context.
EXPERIMENTAL PROCEDURES
Cell Culture and Transfection
HepG2 human hepatocarcinoma cells were maintained in Dulbecco's modified Eagle's medium (DMEM) with 1 g/liter glucose containing 10% fetal bovine serum at 37 °C with 5% CO2. For amino acid and insulin stimulation, cells were incubated in serum-free DMEM overnight followed by incubation in amino acid-free DMEM (Hyclone) for 1 h prior to various treatments described in the text or figure legends. For transient transfections, cells grown on 12-well plates at 60–70% confluence were transfected with 1 μg of each plasmid (wild-type or mutant STAT3) using FuGENE 6 (Roche Applied Science).
Freshly isolated primary hepatocytes were plated in William's medium with 10% fetal bovine serum and incubated for several hours at 37 °C with 5% CO2. The cells were then incubated in serum-free Williams' medium overnight followed by 1-h amino acid deprivation, and then they were subjected to various treatments and assays as described in the text.
Animals and Primary Hepatocyte Isolation
Mouse primary hepatocytes were isolated from 10–14-week-old mice as described previously (17). All handling of animals was in accordance with IACUC regulations at the University of Illinois.
Reagents and Plasmids
Human recombinant insulin was purchased from Sigma-Aldrich. Rapamycin and genistein were from Calbiochem. The Luciferase Assay System was from Promega. Antibodies against STAT3, α-tubulin, and FLAG (M2) were from Santa Cruz Biotechnology, Abcam, and Sigma, respectively. The following antibodies were from Cell Signaling Technology: phospho-Akt (Ser473), Akt, phospho-mTOR (Ser2481), mTOR, Raptor, Rictor, phosphor-STAT3 (Tyr705) and phosphor-STAT3 (Ser727). All secondary antibodies were obtained from Jackson ImmunoResearch Laboratories. The S727D STAT3 mutant was created by site-directed mutagenesis using the QuikChange kit (Stratagene). All other plasmids were described previously (17).
shRNA
All shRNAs used in this study were constructed in the lentiviral vector pLKO.1-puro. Lentivirus packaging and infection were performed as described previously (17). The infected cells were subjected to puromycin selection (2 mg/ml) for 3 days prior to various treatments described in figure legends. shRNA sequences for human STAT3, mTOR, Raptor, Rictor, and a negative control (Scramble) were all reported previously (17, 35).
Western Blot Analysis
Cells were lysed in 1× SDS sample buffer and briefly sonicated to shear the DNA. Boiled lysates were run on SDS-PAGE followed by transferring to polyvinylidene difluoride membranes. Antibody incubations were performed following the manufacturers' recommendations. Horseradish peroxidase-conjugated secondary antibodies and enhanced chemiluminescence reagent (Western Lightning®, PerkinElmer Life Sciences) were used to develop images on x-ray films. Quantification of Western band intensities was performed by densitometry of x-ray images using the software ImageJ.
Glycogen Synthesis Assay
Mouse primary hepatocytes or HepG2 cells seeded in 6-well plates were serum-starved overnight and amino acid-starved for 1 h and then incubated in a 2-fold increase in amino acid concentrations (2×AA) for 1 h with or without pretreatment by 100 nm rapamycin for 30 min, followed by incubation in 1.5 mCi of d-[14C]glucose and 100 nm insulin for 3 h. The cells were then processed for measurement of radiolabeled glycogen as described previously (17).
Luciferase Assays
HepG2 cells grown on 12-well plates at 60–70% confluence were co-transfected with 1 μg of 3×Ly6E reporter (17) and 1 μg of wild-type STAT3 plasmid. After various treatments, the cells were lysed in 200 μl/well passive lysis buffer (Promega). Luciferase activity was measured using the Luciferase Assay System following the manufacturer's protocol.
Quantitative Reverse Transcription-PCR
Total RNA was extracted from HepG2 cells by using the RNeasy mini kit (Qiagen), according to the manufacturer's instructions. cDNA was synthesized from 2 μg of total RNA with Superscript II reverse transcriptase (Invitrogen) using oligo(dT) primer (Invitrogen). Quantitative reverse transcription-PCR was performed to determine relative levels of socs3 mRNA on an iCycler system (Bio-Rad Laboratories) using SYBR Green chemistry in a MicroAmp 96-well reaction plate following the manufacturer's protocols. β-Actin was used as a reference to obtain the relative fold change for target samples using the comparative CT method. Sequences of the primers were reported previously (17).
Statistical Analysis
Each experiment was repeated three or four times. All quantitative data are shown as mean ± S.D. Paired t tests or one-sample t tests were performed to compare the data as indicated in the figure legends.
RESULTS
STAT3 Mediates the Effect of Amino Acids on Suppressing Insulin Signaling
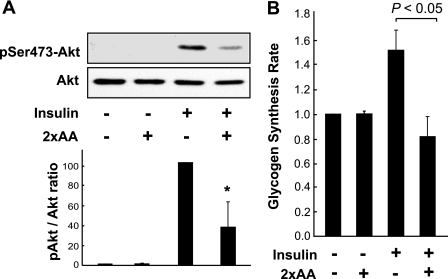
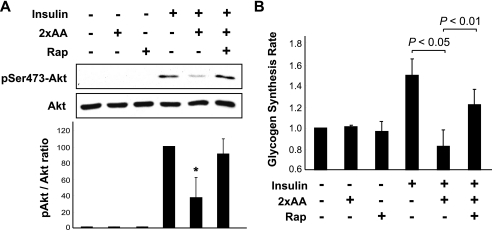
The effect of amino acids on insulin signaling was examined in mouse primary hepatocytes. Acute insulin stimulation activated Akt phosphorylation at Ser473 (a commonly used measurement of insulin signaling) in the absence of amino acids (Fig. 1A) or in the presence of normal concentrations of amino acids typically found in DMEM (data not shown). A 2-fold increase in amino acid concentrations (2×AA) markedly inhibited insulin-stimulated Akt phosphorylation (Fig. 1A). This is consistent with previously reported observations in Fao hepatoma cells (33). As one of the metabolic end points of insulin action in the liver, glycogen synthesis was examined in primary hepatocytes and was found to mirror the activity of insulin signaling faithfully: insulin stimulated glycogen synthesis to a degree consistent with that reported by others (36), and 2×AA abolished this rate increase (Fig. 1B). Similar effects of 2×AA on insulin-stimulated Akt phosphorylation and glycogen synthesis were found in the human hepatocarcinoma HepG2 cells (data not shown), a commonly used cell type for studies of insulin sensitivity in vitro.
FIGURE 1.
Excess amino acids suppress insulin signaling in hepatic cells. A, mouse primary hepatocytes were serum-starved overnight and amino acid-starved for 1 h and then stimulated with 100 nm insulin for 10 min, with or without pretreatment by 2×AA for 1 h. Cell lysates were subjected to Western blot analyses for phospho-Akt (Ser473) (pSer473-Akt) and total Akt. Three independent experiments were quantified to yield the ratio between phospho- and total Akt as described under “Experimental Procedures.” Representative blots are shown. *, p < 0.05, compared with insulin treatment alone by one-sample t test. B, primary hepatocytes were serum-starved overnight and amino acid-starved for 1 h and then stimulated with 100 nm insulin for 3 h in the presence of d-[14C]glucose with or without 2×AA followed by glycogen synthesis assays. Relative glycogen synthesis rates are shown as the average of four independent experiments with error bars representing S.D. The p value of the paired t test is shown above the graph.
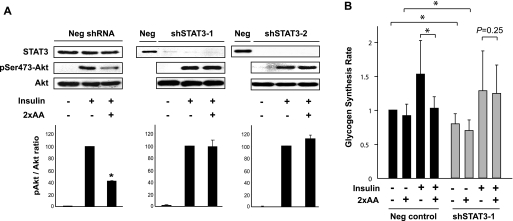
STAT3 was known to be involved in IL-6 induced insulin resistance (17, 37), but its connection to amino acids had never been reported. To examine the involvement of STAT3 in the modulation of insulin signaling by excess amino acids, we knocked down STAT3 in HepG2 cells. Two independent shRNAs, for the purpose of excluding off-target effects, were delivered to the cells via lentiviral infection. Each shRNA resulted in drastic reduction of STAT protein, with a scrambled sequence in the hairpin as negative control (Fig. 2A, STAT3 blots). The Scramble virus-infected cells responded to insulin and 2×AA as expected. In both cases where STAT3 was knocked down, insulin-stimulated phosphorylation of Akt became completely resistant to excess amino acids (Fig. 2A). Thus, depletion of STAT3 abolished the negative effect of amino acids on insulin signaling.
FIGURE 2.
Knockdown of STAT3 ameliorates amino acid suppression of insulin signaling. A, HepG2 cells infected with lentiviruses expressing two independent shRNAs against human STAT3 (shSTAT3-1 and -2) or a negative control hairpin (Neg) were selected with puromycin for 3 days followed by serum starvation overnight and amino acid starvation for 1 h. The cells were then stimulated with 100 nm insulin for 10 min, with or without pretreatment by 2×AA for 1 h followed by Western blot analyses. Three independent experiments were quantified as described in the Fig. 1 legend. Representative blots are shown. *, p < 0.05 compared with insulin treatment alone by one-sample t test. B, HepG2 cells were infected with lentiviruses and puromycin-selected as described above and then serum-starved overnight and amino acid-starved for 1 h followed by stimulation with 100 nm insulin for 3 h in the presence of d-[14C]glucose with or without 2×AA. Glycogen synthesis assays were performed in three independent experiments and quantified as described in Fig. 1. Average results are shown with error bars representing S.D. Paired t tests were performed as indicated in the graph. *, p < 0.05.
We also examined the effect of STAT3 knockdown on glycogen synthesis rate. A modest, but statistically significant, decrease was observed in both basal and insulin-stimulated glycogen synthesis when STAT3 was knocked down (Fig. 2B). This is consistent with a reported positive role of STAT3 in glycogen synthesis via suppressing glycogen synthase kinase-3β expression (38). More important, however, in STAT3 knockdown cells 2×AA no longer inhibited insulin-stimulated glycogen synthesis, indicating that depletion of STAT3 protected insulin sensitivity from inhibition by excess amino acids. Leucine, a branched-chain amino acid, at a concentration 10 times of that in DMEM, exerted an effect similar to that of 2×AA on insulin-stimulated glycogen synthesis and was also rendered ineffective by STAT3 knockdown (data not shown). Taken together, our observations suggest that STAT3 is an indispensable mediator of the effect of amino acids on insulin signaling and insulin action in liver cells. The dual roles of STAT3 in both suppressing and promoting insulin actions will be discussed later.
Ser727 Phosphorylation Is Critical for STAT3 Modulation of Insulin Signaling in Response to Excess Amino Acids
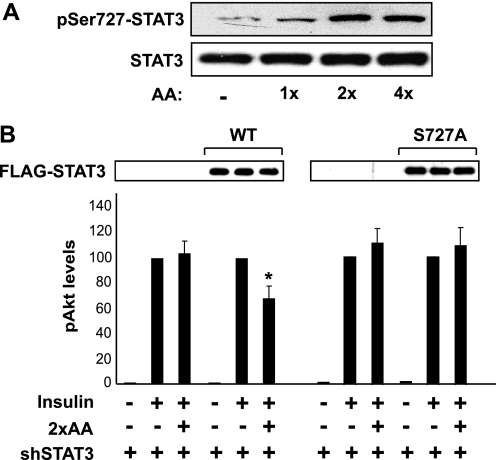
The phosphorylation of Tyr705 leads to dimerization and activation of STAT3, and Ser727 phosphorylation is believed to confer maximum activity of STAT3. To probe into the mechanism by which STAT3 mediates the effect of amino acids, we examined those two phosphorylation sites. As shown in Fig. 3A, amino acids at 2-fold or 4-fold of normal concentrations (2×AA or 4×AA, respectively) markedly stimulated Ser727 phosphorylation in HepG2 cells. A similar observation was also made in mouse primary hepatocytes stimulated with 2×AA (see Fig. 5A). Meanwhile, Tyr705 phosphorylation was not detected under any of the conditions above (data not shown).
FIGURE 3.
Ser727 phosphorylation is essential for STAT3-mediated amino acids inhibition of insulin signaling. A, HepG2 cells were serum-starved overnight and amino acid-starved for 1 h followed by stimulation for 30 min with various concentrations of amino acids (AA) as indicated. The cell lysates were analyzed by Western blotting. B, HepG2 cells were infected with the lentivirus expressing shSTAT3-1 (see Fig. 2), puromycin-selected for 2 days, and then transfected with wild-type (WT) or S727A STAT3 cDNA for 1 day. The cells were then serum-starved overnight and amino acid-starved for 1 h followed by stimulation with 100 nm insulin for 10 min with or without 1-h pretreatment by 2×AA. The cell lysates were analyzed by Western blotting. Three independent experiments were quantified to yield the ratio between Ser473(P)-Akt and total Akt. Average results are shown with error bars representing S.D. Recombinant STAT3 is shown by anti-FLAG Western blotting. *, p < 0.05 compared with insulin treatment alone by one-sample t test.
FIGURE 5.
STAT3 Ser727 phosphorylation is dependent on mTOR. A, mouse primary hepatocytes were serum-starved overnight and amino acid-starved for 1 h and then stimulated with 2×AA with or without 100 nm rapamycin (Rap) added 30 min prior to 2×AA followed by Western blot analysis. B, HepG2 cells were infected by viruses expressing an mTOR shRNA. After puromycin selection for 3 days, serum starvation overnight, and amino acid starvation for 1 h, the cells were stimulated with 2×AA for 1 h. The cell lysates were subjected to Western blot analysis. Three independent experiments were quantified to yield the ratio between Ser727(P)-STAT3 and total STAT3; the average results with S.D. are indicated below the blots.
To assess the functional role of STAT3 Ser727 phosphorylation in the modulation of insulin signaling, we utilized a protein replacement strategy, in which recombinant STAT3 proteins were expressed in cells with endogenous STAT3 knocked down. Knockdown occurred selectively to the endogenous protein and not the recombinant protein because the shRNA was designed to target the human mRNA whereas the recombinant protein was encoded by the mouse cDNA. STAT3 knockdown eliminated the inhibitory effect of 2×AA on insulin signaling (Akt phosphorylation) as shown earlier, and expression of the wild-type recombinant STAT3 fully restored the effect of 2×AA (Fig. 3B, left). Interestingly, the S727A mutation impaired the ability of recombinant STAT3 to restore the effect of 2×AA (Fig. 3B, right). These data suggest that Ser727 is essential for the function of STAT3 in mediating the amino acid effect on insulin signaling.
Overexpression of STAT3 Inhibits Insulin Signaling in a Ser727-dependent Manner
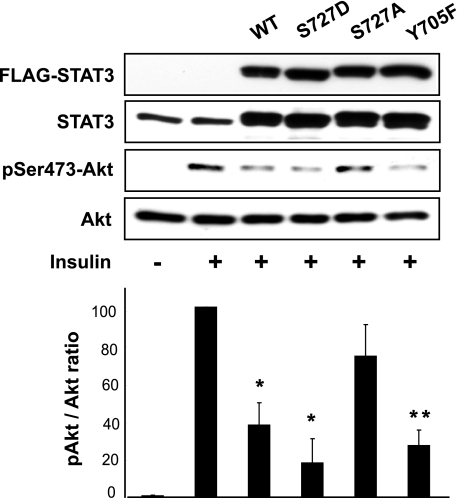
We went on to ask whether active STAT3 alone would be sufficient to suppress insulin signaling in the absence of excess amino acids or any other signal. As shown in Fig. 4, overexpression of STAT3, either wild type or S727D, in HepG2 cells dampened insulin-induced Akt phosphorylation. On the other hand, overexpression of the S727A mutant did not have a significant effect on insulin signaling. Remarkably, overexpression of Y705F-STAT3 also suppressed insulin activation of Akt, indicating that Tyr705 phosphorylation is dispensable for the negative effect of STAT3 on insulin signaling. Taken together, these observations support a central role that STAT3 plays to modulate insulin signaling negatively, and they reveal a Ser727-dependent and Tyr705-independent mechanism of STAT3 activation.
FIGURE 4.
Overexpression of STAT3 inhibits insulin signaling. HepG2 cells were transfected with plasmids expressing STAT3 (wild-type (WT), S727A, S727D, and Y705F) for 1 day, serum-starved overnight, and then stimulated with 100 nm insulin for 10 min. Cell lysates were analyzed by Western blotting. Three independent experiments were quantified to yield the ratio between Ser473(P)-Akt and total Akt. Average results are shown with error bars representing S.D. Representative blots are shown. *, p < 0.05; **, p < 0.01 compared with insulin treatment alone by one-sample t test.
mTOR Phosphorylates STAT3 on Ser727 in Response to Excess Amino Acids
We next asked what might be the kinase responsible for amino acid-stimulated Ser727 phosphorylation of STAT3. mTOR appeared to be a top candidate because it was known to mediate amino acid signals and it had been reported to phosphorylate Ser727-STAT3 under certain conditions, including IL-6-stimulated hepatocytes (17). Indeed, the mTOR-specific inhibitor rapamycin abolished 2×AA-stimulated Ser727 phosphorylation in mouse primary hepatocytes (Fig. 5A). Consistent with mTOR being responsible for STAT3 phosphorylation, the catalytic activity of mTOR, as reflected by its autophosphorylation at Ser2481 (39), was stimulated by 2×AA (data not shown). A previously reported shRNA (17, 35) was used to knock down mTOR, which led to decreased Ser727 phosphorylation (Fig. 5B), confirming the requirement of mTOR for this phosphorylation. Therefore, mTOR is likely the kinase for Ser727-STAT3 in response to excess amino acids in liver cells. Interestingly, neither Raptor knockdown nor Rictor knockdown affected Ser727 phosphorylation (data not shown), implying a biochemical nature of mTOR distinct from the well characterized mTORC1 and mTORC2 complexes in the regulation of STAT3.
To confirm the involvement of mTOR in amino acid inhibition of insulin signaling, we examined the effect of rapamycin. Indeed, rapamycin treatment fully rescued insulin-stimulated Akt phosphorylation in mouse primary hepatocytes from the inhibition by 2×AA (Fig. 6A). Furthermore, glycogen synthesis was also recovered from amino acid inhibition upon rapamycin treatment (Fig. 6B) from the inhibition by 2×AA. These observations are consistent with a functional role for rapamycin-sensitive mTOR in amino acid suppression of insulin signaling in liver cells.
FIGURE 6.
Rapamycin (Rap) ameliorates amino acid suppression of insulin signaling. A, mouse primary hepatocytes were serum-starved overnight and amino acid-starved for 1 h and then stimulated with 100 nm insulin for 10 min with or without pretreatment by 2×AA for 1 h. When applicable, 100 nm rapamycin was added 30 min before 2×AA addition. Cell lysates were subjected to Western analyses. Three independent experiments were quantified to yield the ratio between Ser473(P)-Akt and total Akt. Average results are shown with error bars representing S.D. *, p < 0.05 compared with insulin treatment alone by one-sample t test. B, primary hepatocytes were serum-starved overnight and amino acid-starved for 1 h and then stimulated with 100 nm insulin for 3 h in the presence of d-[14C]glucose with or without 2×AA followed by glycogen synthesis assays. When applicable, 100 nm rapamycin was added 30 min before the 2×AA addition. Relative glycogen synthesis rates are shown as the average of four independent experiments with error bars representing S.D. p values of paired t-tests are shown above the graph.
Excess Amino Acids Activate STAT3 Transcriptional Activity
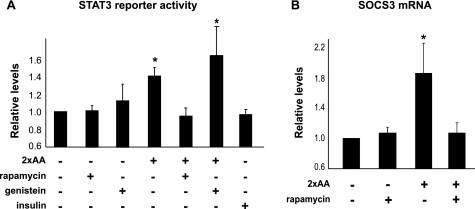
Collectively, the observations described above revealed a novel role of STAT3 in mediating amino acids signals through a mechanism that was dependent on Ser727 phosphorylation and independent of Tyr705 phosphorylation. To investigate whether this noncanonical function was associated with the transcriptional activity of STAT3, we examined STAT3 activity utilizing a luciferase reporter for STAT (13) together with recombinant STAT3 expression. As shown in Fig. 7A, 2×AA modestly, but nevertheless significantly, stimulated the reporter activity, and rapamycin treatment blocked this activation. Although STAT3 can be activated by some growth factors through receptor tyrosine kinases, insulin did not activate STAT3 reporter in HepG2 cells (Fig. 7A, far right bar). Furthermore, 2×AA-stimulated STAT3 reporter activation was completely insensitive to the pan-tyrosine kinase inhibitor genistein (Fig. 7A), indicating that tyrosine phosphorylation was not involved in the activation of STAT3 in response to amino acids. This is consistent with our observation that Tyr705 phosphorylation is dispensable for STAT3 function in mediating amino acid inhibition of insulin signaling.
FIGURE 7.
STAT3 is activated by amino acids in a rapamycin-sensitive and tyrosine phosphorylation-independent manner. A, HepG2 cells were co-transfected with the 3×Ly6E luciferase reporter and STAT3 cDNA, serum-starved overnight and amino acid-starved for 1 h, and then stimulated by 2×AA or 100 nm insulin for 3 h. When applicable, 100 nm rapamycin or 10 μm genistein was added 30 min prior to amino acid treatment. Cell lysates were subjected to luciferase assays (A) or extraction of RNA and quantitative RT-PCR for SOCS3 mRNA (B). Relative luciferase activities and relative levels of SOCS3 are shown as the average results of three independent experiments with error bars representing S.D. *, p < 0.05 compared with control (no stimulation) by one-sample t test.
One of the transcriptional targets of STAT3 is socs3, which is known to exert negative effects on insulin signaling through several distinct mechanisms (22). We found that socs3 expression was indeed up-regulated by 2×AA and, furthermore, inhibited by rapamycin (Fig. 7B). This raises the possibility that STAT3 may transduce amino acid signals through SOCS3 to impair insulin signaling, although it cannot be ruled out that STAT3 has a yet-to-be-identified effector responsible for its function in suppressing insulin signaling.
DISCUSSION
High-protein diets are associated with the development of insulin resistance, the mechanisms of which are of important relevance to public health and medicine. Our study reported here reveals an unexpected role of STAT3 in mediating amino acid suppression of insulin signaling, through a noncanonical mechanism that is dependent on Ser727 phosphorylation and independent of tyrosine phosphorylation. Commonly known as a signal transducer for cytokines and growth factors, STAT3 now joins a small group of signaling molecules known to respond to amino acid signals.
The essential role of STAT3 in mediating amino acid effect on insulin signaling may not be limited to liver cells because we have also observed that STAT3 knockdown restores insulin sensitivity to muscle cells and adipocytes exposed to excess amino acids (data not shown). This indispensable function of STAT3 in transducing amino acid signals came as a surprise because serine phosphorylation of IRS by the nutrient-sensing mTORC1 signaling, mostly through S6 kinase 1, had been widely speculated as a major mechanism behind amino acids-induced insulin resistance. Recently, a new IRS site (Ser1101) phosphorylation by S6 kinase 1 has been proposed to mediate amino acid-induced insulin resistance in insulin target cells (34). It is conceivable that both IRS serine phosphorylation and STAT3 activation contribute to mTOR-mediated suppression of insulin signaling, and the relative contribution of each pathway is dependent on the cell type and physiological/pathological conditions. Although IRS serine phosphorylation has been examined extensively, a potential role of STAT3 in modulating insulin signaling warrants future investigation under a variety of conditions.
Previously, we have reported that IL-6 suppression of insulin signaling is mediated by mTOR phosphorylation of STAT3 at Ser727 (17). mTOR has also been known as a kinase for STAT3 Ser727 in neuronal cells (15, 16). In all those cases, a canonical cytokine-Janus kinase-STAT3 signaling pathway has been shown, or speculated, to contribute to the activation of STAT3 through tyrosine phosphorylation in addition to serine phosphorylation. It is generally believed that serine phosphorylation of STAT3 modulates its maximum activity, perhaps by affecting the recruitment of co-factors (14, 40), whereas Tyr705 phosphorylation is required for the activation. However, recent studies have suggested that STAT3 can be activated through Ser727 phosphorylation in the absence of Tyr705 phosphorylation, involving, for instance, Notch signaling in neuronal stem cells (41) or constitutive activation of STAT3 in macrophages (42). Most recently, Ser727-phosphorylated and Tyr705-dephosphorylated STAT3 is shown to promote prostate tumorigenesis (43). Our observations reported here strongly suggest that amino acids activate STAT3 through this noncanonical mechanism. Notably, amino acids activate a reporter for STAT3 transcriptional activity only to a modest degree perhaps because of the lack of key tyrosine phosphorylation. It remains to be determined whether this low activity alone, which leads to a modest increase of socs3 levels, is sufficient to reach a threshold to impact insulin signaling. It cannot be ruled out that another factor(s) is needed to bridge STAT3 and insulin signaling in response to amino acid signals.
In the liver and hepatocytes a negative role of STAT3 in modulating insulin signaling is established, based on previous reports (17, 23) as well as our findings here. Paradoxically, mice with liver-specific stat3 knockout display insulin resistance associated with increased expression of gluconeogenic genes (44), suggesting a positive role of STAT3 in insulin signaling. It has been further shown that this insulin-sensitizing function of STAT3 is dependent on hepatic expression of IL-6, which is elevated in response to insulin action in the brain (45). Most recently, STAT3 is reported to suppress the expression of glycogen synthase kinase-3β (38), a negative regulator of glycogen synthesis downstream of insulin signaling. Hence, STAT3 plays dual roles in insulin signaling and action. Cellular contexts and environmental cues are likely contributing factors in determining the specific function of STAT3. Of particular relevance, circulating IL-6 (especially that derived from adipose tissues) at chronically elevated concentrations is known to induce insulin resistance in the liver (23, 37); yet, as mentioned above, hepatic expression of IL-6 in response to insulin action in the brain sensitizes hepatic insulin actions (45). Interestingly, STAT3 is central to both of these IL-6 signaling events (17, 23, 37, 45). Therefore, we propose that during a normal insulin response, STAT3 primarily plays a positive role, whereas activation of STAT3 under pathological conditions (such as excess amino acids, overexpression of STAT3, or chronically elevated circulating IL-6) impairs insulin signaling. Our observations that knockdown of STAT3 slightly dampens normal insulin response (Fig. 2B) whereas overexpression of STAT3 also inhibits insulin signaling (Fig. 4) are consistent with such dual roles of STAT3. In vivo studies are still needed to validate the negative function of STAT3 upon aberrant activation. What molecular mechanisms are involved in ensuring the activation of a specific STAT3 function also presents an intriguing question for future investigations.
Acknowledgment
We thank Ike Joewono for technical assistance.
This work was supported by NIAMS/National Institutes of Health Grant AR48914 and by the American Diabetes Association (J. C.).
- STAT
- signal transducers and activators of transcription
- DMEM
- Dulbecco's modified Eagle's medium
- IL
- interleukin
- mTOR
- mammalian target of rapamycin
- 2×AA
- 2-fold increase in amino acid concentrations
- SOCS
- suppressor of cytokine signaling
- IR
- insulin receptor
- IRS
- insulin receptor substrate
- shRNA
- small hairpin RNA.
REFERENCES
- 1.Must A., Spadano J., Coakley E. H., Field A. E., Colditz G., Dietz W. H. (1999) JAMA 282, 1523–1529 [DOI] [PubMed] [Google Scholar]
- 2.Um S. H., D'Alessio D., Thomas G. (2006) Cell Metab. 3, 393–402 [DOI] [PubMed] [Google Scholar]
- 3.Linn T., Santosa B., Grönemeyer D., Aygen S., Scholz N., Busch M., Bretzel R. G. (2000) Diabetologia 43, 1257–1265 [DOI] [PubMed] [Google Scholar]
- 4.Schulze M. B., Manson J. E., Willett W. C., Hu F. B. (2003) Diabetologia 46, 1465–1473 [DOI] [PubMed] [Google Scholar]
- 5.Adibi S. A. (1968) J. Appl. Physiol. 25, 52–57 [DOI] [PubMed] [Google Scholar]
- 6.Felig P., Marliss E., Cahill G. F., Jr. (1969) N. Engl. J. Med. 281, 811–816 [DOI] [PubMed] [Google Scholar]
- 7.Felig P., Marliss E., Cahill G. F., Jr. (1970) N. Engl. J. Med. 282, 166. [DOI] [PubMed] [Google Scholar]
- 8.Felig P., Wahren J., Hendler R., Brundin T. (1974) J. Clin. Invest. 53, 582–590 [DOI] [PMC free article] [PubMed] [Google Scholar]
- 9.Krebs M., Krssak M., Bernroider E., Anderwald C., Brehm A., Meyerspeer M., Nowotny P., Roth E., Waldhäusl W., Roden M. (2002) Diabetes 51, 599–605 [DOI] [PubMed] [Google Scholar]
- 10.Newgard C. B., An J., Bain J. R., Muehlbauer M. J., Stevens R. D., Lien L. F., Haqq A. M., Shah S. H., Arlotto M., Slentz C. A., Rochon J., Gallup D., Ilkayeva O., Wenner B. R., Yancy W. S., Jr., Eisenson H., Musante G., Surwit R. S., Millington D. S., Butler M. D., Svetkey L. P. (2009) Cell Metab. 9, 311–326 [DOI] [PMC free article] [PubMed] [Google Scholar]
- 11.Tremblay F., Lavigne C., Jacques H., Marette A. (2007) Annu. Rev. Nutr. 27, 293–310 [DOI] [PubMed] [Google Scholar]
- 12.Calò V., Migliavacca M., Bazan V., Macaluso M., Buscemi M., Gebbia N., Russo A. (2003) J. Cell. Physiol. 197, 157–168 [DOI] [PubMed] [Google Scholar]
- 13.Wen Z., Zhong Z., Darnell J. E., Jr. (1995) Cell 82, 241–250 [DOI] [PubMed] [Google Scholar]
- 14.Decker T., Kovarik P. (2000) Oncogene 19, 2628–2637 [DOI] [PubMed] [Google Scholar]
- 15.Rajan P., Panchision D. M., Newell L. F., McKay R. D. (2003) J. Cell Biol. 161, 911–921 [DOI] [PMC free article] [PubMed] [Google Scholar]
- 16.Yokogami K., Wakisaka S., Avruch J., Reeves S. A. (2000) Curr. Biol. 10, 47–50 [DOI] [PubMed] [Google Scholar]
- 17.Kim J. H., Kim J. E., Liu H. Y., Cao W., Chen J. (2008) J. Biol. Chem. 283, 708–715 [DOI] [PubMed] [Google Scholar]
- 18.Krebs D. L., Hilton D. J. (2000) J. Cell Sci. 113, 2813–2819 [DOI] [PubMed] [Google Scholar]
- 19.Krebs D. L., Hilton D. J. (2003) Sci STKE 2003, PE6. [DOI] [PubMed] [Google Scholar]
- 20.Ueki K., Kondo T., Kahn C. R. (2004) Mol. Cell. Biol. 24, 5434–5446 [DOI] [PMC free article] [PubMed] [Google Scholar]
- 21.Torisu T., Sato N., Yoshiga D., Kobayashi T., Yoshioka T., Mori H., Iida M., Yoshimura A. (2007) Genes Cells 12, 143–154 [DOI] [PubMed] [Google Scholar]
- 22.Howard J. K., Flier J. S. (2006) Trends Endocrinol. Metab. 17, 365–371 [DOI] [PubMed] [Google Scholar]
- 23.Klover P. J., Zimmers T. A., Koniaris L. G., Mooney R. A. (2003) Diabetes 52, 2784–2789 [DOI] [PubMed] [Google Scholar]
- 24.Senn J. J., Klover P. J., Nowak I. A., Zimmers T. A., Koniaris L. G., Furlanetto R. W., Mooney R. A. (2003) J. Biol. Chem. 278, 13740–13746 [DOI] [PubMed] [Google Scholar]
- 25.Sarbassov D. D., Ali S. M., Sabatini D. M. (2005) Curr. Opin. Cell Biol. 17, 596–603 [DOI] [PubMed] [Google Scholar]
- 26.Hay N., Sonenberg N. (2004) Genes Dev. 18, 1926–1945 [DOI] [PubMed] [Google Scholar]
- 27.Baum J. I., O'Connor J. C., Seyler J. E., Anthony T. G., Freund G. G., Layman D. K. (2005) Am. J. Physiol. Endocrinol Metab. 288, E86–E91 [DOI] [PubMed] [Google Scholar]
- 28.Tremblay F., Krebs M., Dombrowski L., Brehm A., Bernroider E., Roth E., Nowotny P., Waldhäusl W., Marette A., Roden M. (2005) Diabetes 54, 2674–2684 [DOI] [PubMed] [Google Scholar]
- 29.Iiboshi Y., Papst P. J., Kawasome H., Hosoi H., Abraham R. T., Houghton P. J., Terada N. (1999) J. Biol. Chem. 274, 1092–1099 [DOI] [PubMed] [Google Scholar]
- 30.Hara K., Yonezawa K., Weng Q. P., Kozlowski M. T., Belham C., Avruch J. (1998) J. Biol. Chem. 273, 14484–14494 [DOI] [PubMed] [Google Scholar]
- 31.Takano A., Usui I., Haruta T., Kawahara J., Uno T., Iwata M., Kobayashi M. (2001) Mol. Cell. Biol. 21, 5050–5062 [DOI] [PMC free article] [PubMed] [Google Scholar]
- 32.Tremblay F., Marette A. (2001) J. Biol. Chem. 276, 38052–38060 [DOI] [PubMed] [Google Scholar]
- 33.Patti M. E., Brambilla E., Luzi L., Landaker E. J., Kahn C. R. (1998) J. Clin. Invest. 101, 1519–1529 [DOI] [PMC free article] [PubMed] [Google Scholar]
- 34.Tremblay F., Brûlé S., Um S. H., Li Y., Masuda K., Roden M., Sun X. J., Krebs M., Polakiewicz R. D., Thomas G., Marette A. (2007) Proc. Natl. Acad. Sci. U.S.A. 104, 14056–14061 [DOI] [PMC free article] [PubMed] [Google Scholar]
- 35.Sarbassov D. D., Guertin D. A., Ali S. M., Sabatini D. M. (2005) Science 307, 1098–1101 [DOI] [PubMed] [Google Scholar]
- 36.Senn J. J., Klover P. J., Nowak I. A., Mooney R. A. (2002) Diabetes 51, 3391–3399 [DOI] [PubMed] [Google Scholar]
- 37.Klover P. J., Clementi A. H., Mooney R. A. (2005) Endocrinology 146, 3417–3427 [DOI] [PubMed] [Google Scholar]
- 38.Moh A., Zhang W., Yu S., Wang J., Xu X., Li J., Fu X. Y. (2008) Diabetes 57, 1227–1235 [DOI] [PubMed] [Google Scholar]
- 39.Peterson R. T., Beal P. A., Comb M. J., Schreiber S. L. (2000) J. Biol. Chem. 275, 7416–7423 [DOI] [PubMed] [Google Scholar]
- 40.Schuringa J. J., Schepers H., Vellenga E., Kruijer W. (2001) FEBS Lett. 495, 71–76 [DOI] [PubMed] [Google Scholar]
- 41.Androutsellis-Theotokis A., Leker R. R., Soldner F., Hoeppner D. J., Ravin R., Poser S. W., Rueger M. A., Bae S. K., Kittappa R., McKay R. D. (2006) Nature 442, 823–826 [DOI] [PubMed] [Google Scholar]
- 42.Liu H., Ma Y., Cole S. M., Zander C., Chen K. H., Karras J., Pope R. M. (2003) Blood 102, 344–352 [DOI] [PubMed] [Google Scholar]
- 43.Qin H. R., Kim H. J., Kim J. Y., Hurt E. M., Klarmann G. J., Kawasaki B. T., Duhagon Serrat M. A., Farrar W. L. (2008) Cancer Res. 68, 7736–7741 [DOI] [PMC free article] [PubMed] [Google Scholar]
- 44.Inoue H., Ogawa W., Ozaki M., Haga S., Matsumoto M., Furukawa K., Hashimoto N., Kido Y., Mori T., Sakaue H., Teshigawara K., Jin S., Iguchi H., Hiramatsu R., LeRoith D., Takeda K., Akira S., Kasuga M. (2004) Nat. Med. 10, 168–174 [DOI] [PubMed] [Google Scholar]
- 45.Inoue H., Ogawa W., Asakawa A., Okamoto Y., Nishizawa A., Matsumoto M., Teshigawara K., Matsuki Y., Watanabe E., Hiramatsu R., Notohara K., Katayose K., Okamura H., Kahn C. R., Noda T., Takeda K., Akira S., Inui A., Kasuga M. (2006) Cell Metab. 3, 267–275 [DOI] [PubMed] [Google Scholar]


