

Abstract
The wheat germ eukaryotic translation initiation factor (eIF) 4F binds tightly to the mRNA internal ribosome entry site (IRES) of tobacco etch virus (TEV) to promote translation initiation. When eIF4F is limiting, TEV is preferentially translated compared with host cell mRNA. To gain insight into the dynamic process of protein synthesis initiation and the mechanism of binding, the kinetics of eIF4F binding to TEV IRES were examined. The association rate constant (kon) and dissociation rate constant (koff) for eIF4F binding to IRES were 59 ± 2.1 μm−1 s−1 and 12.9 ± 0.3 s−1, respectively, comparable with the rates for capped RNA. Binding of eIF4E or eIF4F to the cap of mRNA is the rate-limiting step for initiation of cap-dependent protein synthesis. The concentration dependence of the reactions suggested a simple one-step association mechanism. However, the association rate was reduced more than 10-fold when KCl concentration was increased from 50 to 300 mm, whereas the dissociation rate constant was increased 2-fold. The addition of eIF4B and poly(A)-binding protein enhanced the association rate of eIF4F ∼3-fold. These results suggest a mechanism where eIF4F initially binds electrostatically, followed by a conformational change to further stabilize binding. Poly(A)-binding protein and eIF4B mainly affect the eIF4F/TEV association rate. These results demonstrate the first direct kinetic measurements of translation initiation factor binding to an IRES.
Introduction
Although structural, biochemical, and genetic studies have provided much insight into cap-dependent mRNA translation and protein-RNA interactions, little is currently known about the mechanism of cap-independent translation, a mechanism employed by many viruses. Protein-RNA complexes formed during either cap-dependent or cap-independent translation are dynamic, and the kinetics of binding and release influence many processes, such as competition for binding sites and the sequential assembly of the initiation complex. Therefore to obtain a better biological understanding of protein synthesis initiation, complex formation must be studied not only as an equilibrium reaction but also as a dynamic process.
During translation initiation, the eukaryotic initiation factor (eIF)2 4E, the small subunit of eIF4F, binds to the cap structure (m7GpppN, where N represents any nucleotide) present in at the 5′ terminus of most eukaryotic mRNAs. eIF4G, the large subunit of eIF4F, recruits additional initiation factors including eIF4A, which unwinds secondary structure within the 5′-leader sequence to allow 40 S ribosomal scanning; poly(A)-binding protein (PABP), which stabilizes the eIF4F complex; and eIF3, which promotes 40 S ribosomal subunit binding. After the 40 S subunit binds and scans to the initiation codons, it assembles with the 60 S subunit to form the 80 S ribosome and carry out translation of the coding region.
Virtually all eukaryotic mRNAs are capped, and most are also polyadenylated. These two sites are critical for the recruitment of the protein synthesis machinery (1). However, a number of viral mRNA are naturally uncapped and have evolved different strategies for preferential translation of their mRNAs, often using internal ribosome entry sites (IRES). Tobacco etch virus (TEV), a member of the picornavirus super group of positive strand RNA viruses, is polyadenylated and naturally lacks a 5′-cap but contains an IRES in the 143-nucleotide 5′-leader sequence. This leader sequence is sufficient to ensure efficient cap-independent translation of the viral RNA (2–4).
Recent studies (5) suggest that the IRES structures, required for internal initiation in the picornaviruses and some cellular mRNA, are high affinity sites for eIF4F binding. Animal picornaviruses, such as encephalomyocarditis virus and poliovirus, lack a 5′-cap and instead have evolved a long and structured 5′-leader that promotes internal ribosome entry of the 40 S ribosomal subunit (6, 7). In the case of encephalomyocarditis virus, the IRES binds directly to eIF4G and facilitates binding of the 40 S ribosomal subunit through interaction with eIF3 (8). Similarly, it has been shown that eIF4G strongly binds to an IRES of the TEV RNA (9) and facilitates binding of the 40 S subunit through interaction with other initiation factors (8, 10). Thus, the IRES is functionally equivalent to the cap and provides an alternate start site to allow ribosome access to the mRNA.
The rate-limiting step in the initiation of translation of eukaryotic mRNA is the recognition of cap structure by eIF4E, the small subunit of eIF4F (11). eIF4G, the larger subunit of eIF4F, interacts with the PABP and in turn recruits other initiation factors, such as eIF4A, eIF4B, and eIF3 to the 5′-end of the mRNA, to generate the cap-binding complex. The cap-associated proteins have a high affinity for PABP in the absence of poly(A) in the wheat germ system (12) but require poly(A) in yeast (13). Binding of eIF4F, eIF4B, and eIF4A are believed to catalyze the efficient unwinding of secondary structure in the 5′-untranslated region of RNA (14). In combination with PABP, these factors promote the functional circularization of mRNA, which is necessary for efficient translation (15–19). Cap binding to eIF4E has been extensively studied by a variety of techniques, e.g. x-ray crystallography (20–22), NMR (23), fluorescence equilibrium (21, 24), and stopped flow kinetic measurements (25–29).
Stopped flow kinetics for the interaction of wheat eIFiso4E (an isoform of eIF4E found in plants) with mRNA cap analogs has been studied previously (25, 28). Further studies showed that the addition of eIF4B and PABP increased the binding rates of eIFiso4E or eIFiso4F with m7G cap. Kinetic analysis for the interaction of the human eIF4E, eIF4E·eIF4G complex (29, 30), and murine eIF4E (27) to cap analog have also been investigated. These studies suggested that cap binding to human eIF4E follows a one-step binding mechanism, and murine eIF4E follows a two-step binding mechanism. However, both human and murine showed almost the same association rate constant. Slepenkov et al. (29) showed that the association rate constant of eIF4E and cap analogs decreased with an increase in ionic strength, whereas the dissociation rate was unchanged. Equilibrium studies (21, 31, 32) suggested that eIF4E binds to cap analogs in a tight complex. The addition of PABP increased the binding affinity of eIF4F with cap 40-fold (33) in terms of equilibrium stability. PABP and eIF4B also increased the equilibrium binding affinity to the IRES but only 4-fold as compared with eIF4F alone (34).
In contrast to eukaryotic mRNAs, which are translated by a cap-dependent mechanism, tobacco etch virus mRNAs are translated by a cap-independent mechanism utilizing an internal ribosome entry site (35, 36). Earlier studies (9, 34) have shown that under conditions where eIF4F is limiting or TEV mRNA is in excess, TEV mRNA has a translational advantage conferred by eIF4G. Quantitative equilibrium binding studies (9, 37) have shown that eIF4F binding to TEV IRES is moderately stronger than binding to cap analog. We therefore wondered whether the kinetics of the process could yield further insight into the mechanism of IRES translation, both in terms of forming an initiation complex and the nature of the biologically relevant protein-RNA interactions. Katsamba et al. (38) have shown the importance of binding kinetics in mutagenesis of the neuronal protein HuD. Removal of one of the three RRM domains did not change the overall equilibrium binding affinity with its target RNA. However, this deletion increased the association-dissociation rates and rendered HuD nonfunctional.
The kinetic rates for eIFs binding to IRES are unknown. In this study, we show that the rate of binding of eIF4F to TEV IRES follows a single bimolecular step, likely an electrostatic interaction; however, the ionic strength dependence suggests a further conformational step to attain full complex stability. The effects of eIF4B and PABP were to increase the association rate and showed little effect on the dissociation rate. A deletion mutant of eIF4B that did not interact with eIF4F was not effective in stimulating eIF4F binding, suggesting that eIF4B protein interactions are important. However, the same mutant that interacts with PABP stimulated eIF4F·PABP binding to RNA almost as effectively as full-length eIF4B, further evidence that protein-protein interactions are important. A mutant of PABP (PABP200–651) that did not interact with either eIF4B or eIF4F but bound RNA did not enhance binding of the proteins. Taken together these results suggest a model where eIF4F/eIF4B/PABP bind to TEV RNA through electrostatic attractions, probably enhanced by protein-protein interactions, followed by additional conformational changes.
EXPERIMENTAL PROCEDURES
Materials
Fluorescein (FI) covalently attached to the 5′-end of pseudoknot (FIPK1) RNA was synthesized by Gene Link, Inc. (Hawthorne, NY). The PK1 domain (5′-CAAAACAAACGAAUCUCAAGCAAUCAAGCAUUCUACUUCUAUUGCAGCAA-3′) was used for RNA binding studies as described previously (5). Partially crushed wheat germ was purchased from Bob's Red Mill, Natural Foods, Inc. (Milwaukie, OR) and was stored at −20 °C until use. Sephadex G-25 was purchased from GE Healthcare. DEAE-cellulose was purchased from Whatman International Ltd. (Maidstone, UK). m7GTP-Sepharose-4B was purchased from Amersham Biosciences. The HiTrap SP, HiTrap Mono Q column, and PreScission protease were purchased from Amersham Biosciences. His bind nickel-resin was purchased from Novagen Co. Ltd. The concentration of FIPK1 RNA was determined spectrophotometrically by measuring the absorbance at 260 nm and using the absorbance of 40 μg/ml RNA as 1. The concentrations of protein were determined by a Bradford assay with bovine serum albumin as standard (39) using a Bio-Rad protein assay reagent.
Purification of eIF4F
Wheat germ eIF4F was isolated from the 0–40% ammonium sulfate fraction of the 120 mm KCl post-ribosomal supernatant as described previously (40). The 0–40% ammonium sulfate fraction was applied to a DEAE-cellulose column. The aliquots of the active fractions containing eIF4F were pooled and dialyzed before loading on to a HiTrap SP column. eIF4F elutes in 250 mm KCl. The active fractions were pooled and dialyzed. To further increase the purity of eIF4F, the dialyzed sample was applied to 2 ml of m7GTP-Sepharose-4B column, and the eIF4F was eluted with 100 mm GTP. The purified fractions were pooled and concentrated in a Centricon-10 microconcentrator (Amicon Co.). The purity of eIF4F was confirmed by running 7.5% SDS-polyacrylamide gel electrophoresis with Coomassie Brilliant Blue staining.
Expression and Purification of eIF4B and PABP
Expression vectors pET3d-eIF4B340–527 and pET19b-PABP200–651 were kindly provided by Daniel Gallie (University of California, Riverside, CA). Full-length and truncated eIF4B were expressed in Escherichia coli containing the constructed pET3d vector in BL21 (DE3) pLysS as described elsewhere (41, 42). Full-length and truncated PABP were expressed in E. coli containing the constructed pET19b vector in BL21 (DE3) pLysS as described previously (43). The cells were cultured in LB medium containing 100 μg/ml ampicillin and 34 μg/ml chloramphenicol at 37 °C. When the optical density at 600 nm reached 0.5, expression was induced for 5 h with 0.1g/liter isopropyl-1-thio-β-d-galactopyranoside, after which the cells were harvested by centrifugation. Subsequent steps were performed at 4 °C. The cell pellets were resuspended into binding buffer (20 mm Tris-HCl, pH 7.9, 0.5 m NaCl, and 5 mm imidazole) containing 0.5 ml of aprotinin, 1.0 mm phenylmethylsulfonyl fluoride, and 100 μg/ml soybean trypsin inhibitor, disrupted by sonication, after which the lysate was centrifuged. The supernatant was applied to a 5-ml His-Tag nickel bind column equilibrated with binding buffer. The column was washed with binding buffer, and the bound protein was eluted with elution buffer (20 mm Tris-HCl, pH 7.9, 0.5 m NaCl, and 200 mm imidazole). The protein was dialyzed against buffer (20 mm Tris-HCl, pH 7.6, 150 mm NaCl, and 5% glycerol). The purity of the eIF4B and PABP was confirmed by 10% SDS-PAGE with Coomassie Brilliant Blue staining.
In Vitro Transcription of Capped RNA
Capped RNA was synthesized as described previously (44, 45). Deoxyoligonucleotides incorporating both the desired template and the complement of the T7 RNA polymerase primer sequence were synthesized by Primm Biotech Inc. (Cambridge, MA). Linear synthetic DNA primers with the sequence 5′-GAATTCGGGGTGAAAAGGTGGTCCAGTGAAGGACCACCATGGTATGGATCC-3′ were used to generate capped RNA. The oligonucleotide 1–51 sequence was positioned next to the T7 promoter of pGEM9 vector. The restriction enzyme SalI was used for cleavage to yield linear DNA with the oligonucleotide 1–51 sequence. The linearized DNA was treated with proteinase K (100 μg/ml) and 0.5% SDS in 50 mm Tris-HCl (pH 7.5), 5 mm CaCl2 for 30 min at 37 °C. DNA was further purified by extraction with phenol:chloroform:isoamylalcohol (25:24:1) at pH 8.0 followed by ethanol precipitation. Purity was checked in a 1% agarose gel, and the concentration was quantified spectrophotometrically and brought to 0.5 mg/ml. In vitro transcription of DNA to produce capped RNA oligonucleotide was carried out using Promega RiboMaxTM large scale RNA T7 production system. Under these conditions more than 90% of the mRNA was capped as confirmed by 1% agarose gel electrophoresis. The concentration of RNA was quantified by measuring the optical density at 260 nm using the absorbance at 260 nm of 40 μg/ml RNA as 1.
Stopped Flow Anisotropy Measurements
Stopped flow anisotropy measurements were performed on an OLIS RSM 1000 stopped flow system with a 1-ms dead time. The excitation wavelength for fluorescein-labeled pseudoknot RNA (FIPK1 RNA) was 490 nm. The time-dependent change in fluorescein anisotropy was monitored at 520 nm. The temperature of the flow cell and solution reservoir was maintained at 25 °C using a temperature-controlled circulating water bath. Protein (eIF) binding induced an increase in FIPK1 RNA anisotropy. After rapid mixing of 0.1 μm (final concentration, 0.05 μm) FIPK1 RNA with varying concentrations (final concentration, 0.1–1 μm) of proteins, the time course of the anisotropy change was recorded by computer data acquisition. All of the measurements were carried out in titration buffer consisting of 20 mm Tris-HCl, pH 7.6, 2.0 mm MgCl2, and 1.0 mm dithiothreitol containing either 50, 100, 150, or 300 mm KCl. In each experiment, 1000 pairs of data were recorded, and sets of data from five to seven shots were averaged to improve the signal-to-noise ratio. Each averaged set of stopped flow anisotropy data were then fitted to nonlinear analytical equations using Global analysis software provided by OLIS. The anisotropy is defined as follows,
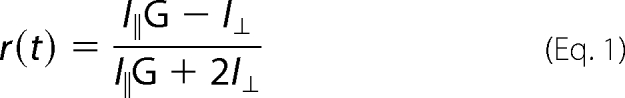 |
where I‖ and I⊥ are the polarized fluorescence emission parallel and perpendicular to the excitation beam, respectively. An instrument polarization bias (G factor = 0.9) was measured using horizontally polarized excitation. Data from the anisotropy experiments were fitted to single- and double-exponential functions. Fitted curves correspond to the following single-exponential equation,
where rt is the observed anisotropy at any time, t; rf is the final value of anisotropy; Δr is the amplitude; and kobs is the observed first order rate constant. The double-exponential equation is as follows,
where Δr1 and Δr2 are the amplitudes for the first and second components of the reaction with observed rate constants kobs1 and kobs2, respectively. The residuals were measured by the differences between the calculated fit and the experimental data.
For measurements of protein-protein interactions, complex formation was studied by monitoring changes in intrinsic protein fluorescence. The molar ratio of eIF4F (1 μm) to PABP and mutated PABP (10 μm) or full-length and truncated eIF4B (10 μm) in the binding reaction was 1:10, whereas for the ternary complex, the ratio of eIF4F·4B·PABP was 1:10:30, and the samples were incubated for 15 min to ensure protein complex formation. Equilibrium dissociation constants for the interaction of eIF4F·eIF4B, eIF4F·PABP, and eIF4F·4B·PABP were 62, 43, and 32 nm, respectively. Kd values (12) for the protein-protein interactions were used to calculate concentrations so that more than 90% of the eIF4F was in the complex (eIF4F·eIF4B, eIF4F·PABP, and eIF4F·4B·PABP) at 100 nm, the lowest protein mixing concentration.
Stopped Flow Fluorescence Measurements
As described elsewhere (28, 46), capped oligonucleotide binding induced a decrease in initiation factor fluorescence. eIF4F was excited at 295 nm, and the fluorescence (voltage) was measured after passing a 324-nm cut-on filter. A reference photomultiplier was used to monitor fluctuations in the lamp intensity. The temperature of the flow cell and solution reservoir was maintained at 25 °C using a temperature controlled circulating water bath. The experiments were performed in titration buffer containing 150 mm KCl after rapid mixing of 0.1 μm (final concentration) eIF4F with 0.1, 0.5, 1, and 2 μm (final concentration) of m7GpppG capped RNA (51 nucleotides). Fluorescence measurements from five to seven shots were averaged to optimize the signal-to-noise ratio. Each averaged set of stopped flow data were then fitted to nonlinear analytical equations using Global analysis software provided by OLIS. The data were evaluated by fitting to the single- and double-exponential functions as described previously (44, 47).
RESULTS
Interactions of eIF4F with Full-length eIF4B and Mutant eIF4B340–527
To determine the interaction of full-length eIF4B and mutant eIF4B340–527 with eIF4F, a pull-down assay was performed, and eluted fractions from m7-GTP-Sepharose column (supplemental Fig. S1A) were analyzed. eIF4B bound eIF4F was eluted with GTP, and full-length eIF4B, eIF4G, and eIF4E (subunit of eIF4F) were detected (lane 3), whereas only eIF4E and eIF4G were observed with mutant eIF4B340–527 fraction (lane 5). No detection of full-length eIF4B was observed in the wash fraction (lane 6), whereas mutant eIF4B340–527 was detected in the wash fractions (lane 4). These results indicate that mutant eIF4B340–527 does not bind with eIF4F. However, full-length eIF4B binds to eIF4F as described previously (42). Steady state fluorescence titration experiments (supplemental Fig. S1B) further confirm the results of pull-down assays. Fluorescence data showed essentially no interaction of mutant eIF4B340–527 with eIF4F. Previously (43), it has been shown that full-length PABP binds with eIF4F, whereas no binding was observed with mutant PABP200–651.
Kinetics of eIF4F Binding to TEV Are Best Fit by a Single Bimolecular Step
To distinguish between a single, bimolecular binding step and a more complex mechanism such as a fast binding followed by a conformational change, detailed data fitting and the concentration dependence of the reaction were determined. Both a single binding step and more complex mechanisms have been reported for eIF cap binding (29, 48). Stopped flow data were fitted by nonlinear regression analysis to a single- and double-exponential function as described under “Experimental Procedures” (Fig. 1A). Treatment of the data using a double-exponential function did not improve the fit (Fig. 1B). The residuals representing the deviation between the calculated and experimental data indicate that the single-exponential function fits the points over the entire time course of the measurements. For the following one-step reaction mechanism,
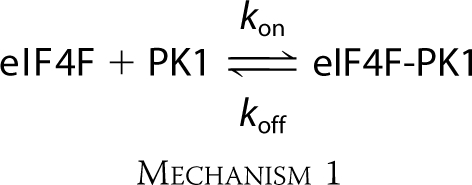 |
where kon and koff are the rates of association and dissociation, respectively, for the interactions of eIF4F and PK1 RNA, the observed rate constant (kobs) is predicted to be a linear function of eIF4F concentration.
The observed rate constant increased linearly with an increase in eIF4F concentration (Fig. 2, A and E). The plot shown in Fig. 2 was used to obtain values of kon and koff from the slope and the y intercept, respectively. The data are shown in Table 1.
FIGURE 1.

FIPK1 RNA binding to eIF4F, eIF4F·4B, and eIF4F·4B·PABP is best fit by a single exponential. FI-labeled PK1 RNA at 50 nm (final concentration) was rapidly mixed with 1000 nm eIFs (final concentration) in titration buffer at 150 mm KCl and 25 °C. The data were fit (solid line) to single-exponential function (A) and double-exponential function (B). A double exponential did not improve the fitting. A single exponential function is consistent with a single reaction step. Residuals for the corresponding fits are shown in the lower panels. Excitation and emission wavelengths were 490 and 520 nm, respectively.
FIGURE 2.

Initiation factor binding to PK1 RNA is linearly dependent on concentration. A–D, FIPK1 RNA at 50 nm (final concentration) was rapidly mixed with varying concentrations (final concentrations, 0.1, 0.2, 0.5, and 1 μm) of eIF4F (A), eIF4F·4B (B), eIF4F·PABP (C), and eIF4F·4B·PABP (D). The solid line represents the fitted curve for a single-exponential function. E, the observed rate constant for the anisotropy change is plotted as a function of increasing concentrations of eIF4F (○), eIF4F·4B (●), eIF4F·PABP (△), and eIF4F·4B·PABP (▲). The linear concentration dependence suggests a simple second order reaction. Extrapolation (see text) gives kon (Table 1). The data points in the plot of kobs versus [eIFs] were obtained from three independent experiments, and the average value of the experimental data is reported.
TABLE 1.
Effects of 4B340–527 and PABP200–651 mutants on the kinetic parameters of eIF4F binding with FIPK1 RNA at 150 mm KCl concentration
| Complex | kon | koff | Kd |
|---|---|---|---|
| μm−1s−1 | s−1 | nm | |
| eIF4F | 59 ± 2.1 | 12.9 ± 0.3 | 218 |
| eIF4F·4B340–527 | 56.2 ± 3.3 | 12.3 ± 0.6 | 219 |
| eIF4F·PABP200–651 | 66 ± 3.5 | 13.7 ± 0.8 | 207 |
| eIF4F·4B | 94.1 ± 4.3 | 10.2 ± 0.7 | 108 |
| eIF4F·4B·PABP200–651 | 104 ± 7.6 | 10.6 ± 0.4 | 102 |
| eIF4F·PABP | 85.1 ± 3.5 | 10.6 ± 0.6 | 124 |
| eIF4F·PABP·4B340–527 | 128 ± 6.9 | 10.2 ± 0.5 | 80 |
| eIF4F·4B·PABP | 160 ± 9 | 7.7 ± 0.7 | 48 |
eIF4B and PABP Increase the Binding of eIF4F to TEV RNA
Both eIF4B and PABP are necessary for efficient translation of TEV RNA (49) and have been shown to increase the equilibrium affinity of eIF4F for TEV RNA (34). To further understand the kinetics of initiation complex formation, the effects of eIF4B and PABP on eIF4F binding to TEV RNA were determined. The addition of eIF4B and PABP together increases the rate constant ∼3-fold as compared with eIF4F binding to PK1 RNA alone. However, the addition of eIF4B alone to eIF4F-PK1 binding increased the rate constant ∼2-fold as compared with eIF4F (Fig. 1A). These data were also best fit by a single exponential function (Fig. 1A). The concentration dependences for the protein complexes were also determined as for eIF4F alone. The observed rate constant obtained from the stopped flow data shown in Fig. 2 (B and C) was used for the determination of the kon and koff values as described for eIF4F binding. The observed rate constant increased linearly with increases in eIF4F·4B (Fig. 2E) and eIF4F·PABP concentration (Fig. 2E and Table 1). The kon of eIF4F·4B is ∼2-fold higher than the kon of the eIF4F alone. Further, the binding reaction of PK1 RNA was also performed with all three initiation factors, eIF4F·4B·PABP, as shown in Fig. 2D. The kon of eIF4F·4B·PABP is ∼3-fold higher than the kon of the eIF4F alone binding to PK1 RNA (Table 1). These results reveal a 3-fold and less than 2-fold difference in the kon and koff values, respectively, of eIF4F binding to PK1 RNA after the addition of eIF4B and PABP. The Kd values, calculated using the equation, Kd = koff/kon, showed a 4.6-fold greater affinity for eIF4F·4B·PABP (calculated Kd = 48.1 nm) compared with eIF4F alone (calculated Kd = 218 nm) with PK1 RNA. These results are consistent with the PK1 RNA binding to eIF4F, eIF4F·4B, eIF4F·PABP, and eIF4F·4B·PABP experiments in the fluorescence steady state that demonstrated an approximately 4-fold increase in the binding affinity of eIF4F·4B·PABP as compared with eIF4F alone to PK1 RNA (9, 34). Kd values calculated from the kinetic constants agree well with the Kd value obtained by steady state equilibrium method. The addition of PABP and eIF4B to eIF4F both increases the rate of PK1 association and decreases the rate of dissociation with a much larger effect on the association rate. eIF4B or PABP alone did not show any change in fluorescence anisotropy (data not shown), indicating that under these conditions they did not bind TEV in the absence of eIF4F.
Deletion Mutant eIF4B340–527, Which Does Not Bind eIF4F, Is Unable to Enhance eIF4F Binding to TEV RNA
Even though eIF4B alone did not bind to TEV RNA under our experimental conditions, the protein has two RNA-binding domains (42). To test whether the addition of eIF4B affects the kinetic rate of eIF4F binding to PK1 RNA through contacts with eIF4F or through eIF4B binding to PK1 RNA, an eIF4B fragment, eIF4B340–527, which does not bind eIF4F (pull down experiment supplement data), was used. The observed rate constant increased linearly with an increase in eIF4F·4B340–527 concentration (Fig. 3). Within the experimental error, the kon and koff values of eIF4F·4B340–527 were the same as for eIF4F binding to PK1 RNA (Table 1). A significant increase in the association rate of eIF4F·PABP binding to PK1 RNA in the presence of eIF4B340–527 was observed (Table 1). eIF4B340–527 enhanced eIF4F·PABP binding 1.5-fold compared with 2-fold for wild type eIF4B. These results indicate that protein-protein interactions between PABP, eIF4B, and eIF4F enhance the association rate for TEV binding.
FIGURE 3.

Effects of eIF4B340–527 and PABP200–651 mutants on eIF4F binding to FIPK1 RNA. A–D, FIPK1 RNA at 50 nm (final concentration) was rapidly mixed with 200 nm eIFs (final concentration) in titration buffer at 150 mm KCl and 25 °C. A, eIF4F-PK1 and eIF4F·4B340–527-PK1; B, eIF4F·PABP-PK1 and eIF4F·PABP·4B340–527-PK1; C, eIF4F-PK1 and eIF4F·PABP200–651-PK1; D, eIF4F·4B-PK1 and eIF4F·4B·PABP200–651-PK1. A reaction of eIF4B340–527 and PABP200–651 mutant protein alone (no eIF4F) (1 μm) with FIPK1 RNA is shown (A and C, bottom traces). The solid line represents the fitted curve for a single-exponential function. E, the observed rate constant for the anisotropy change is plotted as a function of increasing concentrations of eIF4F·4B340–527 (○), and eIF4F·PABP·4B340–527 (●), eIF4F·PABP200–651 (△), and eIF4F·4B·PABP200–651 (▲). Extrapolation gives the kon value. The data points in the plot of kobs versus [eIFs] were obtained from three independent experiments, and the average value of the experimental data is reported.
A PABP Deletion Mutant, PABP200–651, That Does Not Interact with eIF4F Only Slightly Increases Binding of eIF4F or eIF4F· eIF4B to TEV RNA
The binding reaction of eIF4F and eIF4F·4B with PK1 RNA in the presence of PABP200–651 mutant was also performed. The observed rate constant increased linearly with an increase in eIF4F·PABP200–651 and eIF4F·4B·PABP200–651 concentration with PK1 RNA (Fig. 3E and Table 1). The kon and koff values of eIF4F·PABP200–651 were nearly the same as for eIF4F binding to PK1 RNA (Table 1). These results suggest that mutant PABP200–651 was not as effective as wild type PABP in enhancing the association rate of eIF4F binding to PK1 RNA. The eIF4B340–527 had no effect on eIF4F binding. However, the binding of eIF4F·PABP was increased almost as much as when full-length eIF4B was present. These results suggest the eIF4B·PABP interaction contributes to the association rate. As expected, there was no increase in anisotropy of FIPK1 RNA with eIF4B340–527 and PABP200–651 fragment alone (Fig. 3, A and C, bottom trace). These data indicate that eIF4F binds to PK1 RNA, and the association rate increases mainly through the interaction of eIF4B and PABP binding to eIF4F.
Increasing KCl Concentration Reduces Association Rates
If the roles of charged residues are to promote electrostatic interactions with RNA phosphate backbone, it would be expected that increasing the ionic strength would lead to a loss of binding affinity. The effect of KCl concentration on the binding kinetics of initiation factors with PK1 RNA is shown in Fig. 4. The plots of kobs for PK1 binding versus eIF4F, eIF4F·eIF4B, eIF4F·PABP, and eIF4F·4B·PABP concentrations were again linear. The data show an approximately 5–10-fold decrease in kon and an approximately 2-fold increase in koff with an increase in ionic strength from 50 to 300 mm KCl (Table 2). The Kd values were calculated from these kinetic constants (Table 2). The Kd values at 150 mm KCl are very much in agreement to those obtained by equilibrium methods (9, 34). For instance, at 150 mm KCl, the kinetic approach yielded Kd = 218 nm for eIF4F (Table 2), whereas the equilibrium approach yielded 203 ± 14 nm in our previous studies (34). At 150 mm KCl, the Kd value for eIF4F·4B·PABP binding to PK1 RNA calculated from the kinetic measurements (Kd = 48.1 nm) agreed well with the Kd value obtained by steady state equilibrium method (Kd = 51 ± 2.5 nm) (34). The decrease in association rate (∼10-fold) as KCl was increased strongly suggests that the initial interaction of the protein complexes with the RNA target is based on electrostatic interactions. The fact that the dissociation rate is much less affected further indicates a second, conformational change step is involved in formation of the protein-RNA complex (see “Discussion”). Although ionic strength could influence the RNA conformation, such changes would be expected to affect both the association and dissociation rates.
FIGURE 4.

Increasing KCl concentration affects kon. kobs obtained in experiments similar to those shown in Fig. 1 at the indicated KCl concentrations, 50 mm (○), 100 mm (●), 150 mm (△), and 300 mm (▲) is plotted for eIF4F (A), eIF4F·PABP (B), eIF4F·4B (C), and eIF4F·4B·PABP (D) with PK1 RNA. The data were fit with Equation 4. The kinetic rate constants at different ionic strengths are shown in Table 2. The experimental conditions were the same as described for Fig. 2 except at different ionic strength. The decrease in kon with increased ionic strength indicates that electrostatic interactions are involved in the binding reaction.
TABLE 2.
Kinetic parameters for the binding of FIPK1 RNA with eIF4F, eIF4F·4B, eIF4F·PABP, and eIF4F·4B·PABP complexes
|
kon |
koff |
Kd |
||||||||||
|---|---|---|---|---|---|---|---|---|---|---|---|---|
| eIF4F | 4F·4B | 4F·PABP | 4F·4B·PABP | eIF4F | 4F·4B | 4F·PABP | 4F·4B·PABP | 4F | 4F·4B | 4F·PABP | 4F·4B·PABP | |
| μm−1s−1 | s−1 | nm | ||||||||||
| 50 mm KCl | 150 ± 8 | 172 ± 13 | 147 ± 7 | 299 ± 21 | 8.7 ± 0.4 | 7.5 ± 0.2 | 8.1 ± 0.3 | 7.1 ± 0.4 | 58 | 44 | 55 | 24 |
| 100 mm KCl | 77.4 ± 4 | 107.4 ± 9 | 95.7 ± 5 | 241 ± 15 | 9.6 ± 0.3 | 8.8 ± 0.2 | 10.1 ± 0.4 | 7.5 ± 0.3 | 124 | 82 | 105 | 31 |
| 150 mm KCl | 59 ± 2.1 | 94.1 ± 4.3 | 85.1 ± 3.5 | 160 ± 9 | 12.9 ± 0.3 | 10.2 ± 0.7 | 10.6 ± 0.6 | 7.7 ± 0.6 | 218 | 108 | 124 | 48 |
| 300 mm KCl | 13.8 ± 0.8 | 32.8 ± 3 | 27 ± 2 | 69.2 ± 6 | 16.9 ± 0.7 | 13.4 ± 0.9 | 14.9 ± 0.7 | 12.5 ± 0.6 | 1220 | 408 | 552 | 181 |
Kinetics of eIF4F Binding Are Similar for Capped Oligonucleotide and TEV RNA
One strategy a virus could employ to preferentially translate its own RNA is to have much more rapid binding of eIFs to the target RNA compared with host cell-capped RNA. We therefore compared the binding of a capped oligonucleotide to the binding of TEV RNA. A 51-nucleotide m7GpppG-capped RNA was synthesized to determine the binding of eIF4F. As shown for IRES RNA, the kobs increased with an increase in m7G-capped RNA concentration (Fig. 5). The kinetic data were best fit with a single-exponential function as described for IRES binding. m7G-capped RNA concentration-dependent kobs values were used for determination of kon and koff as described above (Fig. 5B). The linear plot indicated that the binding of capped RNA also is consistent with a one-step kinetic mechanism as was found for IRES and eIF4F. The kon and koff values were obtained from the slope and intercept, respectively, and are 45 ± 3.3 μm−1 s−1 and 12.4 ± 0.5 s−1. The capped RNA shows a slightly lower kon value and a nearly identical koff value as compared with the IRES binding to eIF4F. Although these data show that TEV RNA does not possess a large kinetic advantage, at equal TEV and host cell mRNA concentrations, the eIF4F·4B·PABP complex will partition to the TEV RNA, and the faster association rates will allow a greater opportunity for ribosome binding.
FIGURE 5.

eIF4F binds capped oligonucleotide with an association rate similar to TEV IRES binding. A, eIF4F at 100 nm (final concentration) was rapidly mixed with varying concentrations (final concentrations, 0.1, 0.5, 1, and 2 μm) of m7G-capped RNA. The resulting time course of fluorescence change fits to a single-exponential function. Residuals for the fits are shown in the lower panels. B, the observed rate constant of fluorescence change (measured in volts) is plotted as a function of increasing m7G-capped RNA concentration and provides a kon = 45 ± 3.3 μm−1 s−1. See “Experimental Procedures” for details.
DISCUSSION
In this study, experiments were undertaken to characterize for the first time the kinetics of IRES-eIF interactions. It has been shown (5) that TEV 5′-leader functionally substitutes for a 5′-cap and initiates cap-independent translation through the use of an IRES, a highly structured RNA leader sequence.
Equilibrium studies have shown that the TEV IRES strongly interacts with eIF4G, the large subunit of eIF4F (9). The addition of PABP further increased the binding affinity of IRES for eIF4F (34). To determine whether these additional factors enhanced the stability of the complex by increasing kon, decreasing koff, or both, the kinetics of these interactions were measured. The ternary complex eIF4F·4B·PABP binds PK1 RNA with a faster rate than eIF4F, eIF4F·4B, or eIF4F·PABP, but the effect was somewhat less than for cap binding to eIFiso4F. Our previous study showed that the rate constant of m7G cap association with eIFiso4F was enhanced ∼5-fold in the presence of PABP and eIF4B (28). Additionally, the eIF4F-PK1 RNA complex shows an approximately 2-fold slower rate of dissociation from the IRES in the presence of eIF4B and PABP. These data suggest that the combination of eIF4B and PABP with eIF4F produces a complex that has both rapid binding properties and a lower rate of dissociation. Experiments with the eIF4B and PABP deletion mutants eIF4B340–527 and PABP200–651 demonstrate the importance of protein-protein interactions. The eIF4B interaction with the eIF4F·PABP complex enhances binding. One explanation for this is that eIF4B promotes a conformational change that increases the electrostatic capture area of the protein complex.
To further understand the mechanism of these interactions and, in particular, the role of electrostatic interactions, the ionic strength dependence was determined. It is known that eIF4E-cap analog interactions decrease with ionic strength, and Slepenkov et al. (29) showed this effect was due primarily to a decrease in kon. However, for capped oligonucleotide, the dissociation from human eIF4E increased ∼10-fold at high salt concentrations compared with the cap analog. Additional salt bridges between eIF4F and the oligonucleotide were proposed to stabilize the structure. Our data show little effect on koff, suggesting that the main effect of high salt concentration is shielding of charge to reduce ionic interactions and thus reduce kon. The reduction of kon at high salt concentrations was more pronounced in the presence of eIF4B and PABP, suggesting either direct interaction with RNA or a conformational change in eIF4F to promote a larger contact area. The relatively small change in koff with increased ionic strength further suggests that binding involves a second, probably conformational step in the reaction. This mechanism has been shown for neurol protein HuD and U1A protein (38) where a “lure and lock” model was proposed. In this model, the initial binding is largely electrostatic, characterized by protein lysine residues interacting with the RNA phosphate groups. A second step of the reaction involves nearby residues that form hydrogen bonds and/or hydrophobic interactions. This model is consistent with the data presented here. A further advantage of a large protein complex binding to the IRES is that such a complex provides a large capture area for electrostatic interactions. Specificity could then be conferred by additional proteins and/or conformational changes.
We used capped RNA to compare the binding kinetics for eIF4F to TEV RNA. If the binding rate for TEV RNA is much greater than for capped RNA, eIF4F will be preferentially bound to the TEV RNA. This binding would confer a translational advantage to TEV, particularly under conditions of limiting eIF4F. Gallie (49) has shown that in vitro, when eIF4F is limiting, TEV is preferentially translated. Under their experimental conditions where eIF4F is limiting, the level of translation from a TEV-luc-A50 construct was 90-fold greater than a control mRNA. The kinetic data reported here for association rates, which are very similar for capped and TEV oligonucleotides, would only partition approximately half of the eIF4F to TEV if concentrations of TEV and control RNA were equal. At the early stages of infection, it is likely that the viral RNA concentrations would be much lower than host cell mRNA. However, our previous equilibrium data showed eIF4F bound TEV RNA 15–20-fold more tightly than capped oligonucleotide. The dissociation rates from TEV must therefore be significantly slower than from capped oligonucleotides, effectively sequestering the eIF4F. Our earlier data (28) showed that the effects of PABP and eIF4B on cap binding were largely to decrease the dissociation rate. In contrast, these data show that the effects on TEV binding are to increase the association rates. The modulation of binding rates and dissociation by PABP and eIF4B suggest that the most productive IRES RNA recruitment would occur subsequent to the protein complex formation. This would suggest a pathway where subsequent to viral RNA entering the cell, the protein complex binds to the IRES RNA. Earlier studies (44) with VPg protein have shown that VPg can compete with cap for eIF4F binding. The data presented here are consistent with a mechanism where VPg displaces the protein complex from capped RNA and frees the complex to bind to IRES RNA. However, there may be additional reasons why TEV is able to initially compete with host cell mRNA at low concentrations both in vivo and in vitro. Poliovirus employs a strategy where eIF4G is targeted for cleavage following infection (50, 51), but eIF4G cleavage is not essential to mediate all IRES function. No cleavage of eIF4G by hepatitis A virus has been observed, and indeed the intact eIF4G is required for hepatitis A virus translation (52). The strategy employed by TEV has not been determined. Additional initiation factors may also increase the initial rate of binding. In particular, it has not been determined whether helicase reactions play a role in eIF4F binding and/or ribosome binding. The TEV IRES contains a secondary structure, but the extent to which this structure is unwound or modified prior to ribosome binding is unknown. Further, although PABP stimulates binding to the IRES, it may be necessary to also have a poly(A) tail on the RNA to fully activate translation. Other regions of the RNA may also interact either directly or through secondary structure with the eIF complex. Further, it is possible that recruitment of eIF4F to the TEV IRES is enhanced by other trans-acting factor(s) such as the ITAF45 (the IRES trans-acting factor 45) protein for foot-and-mouth disease virus (53). Identification of those proteins that bind to the TEV IRES and the dynamics of RNA structural motifs will be necessary to determine which translational strategy this member of the picornavirus supergroup has adopted.
Acknowledgments
We thank Dr. Daniel R. Gallie (University of California, Riverside, CA) for the eIF4B and PABP mutant and TEV constructs and Dr. John L. Trujillo for critical reading of the manuscript.
This work was supported, in whole or in part, by National Institutes of Health Research Center in Minority Institution Award RR-03037. This work was also supported by National Science Foundation Grant MCB 0814051 (to D. J. G.).

The on-line version of this article (available at http://www.jbc.org) contains supplemental text and Fig. S1.
- eIF
- eukaryotic initiation factor
- IRES
- internal ribosomal entry site
- TEV
- tobacco etch virus
- PK
- pseudoknot
- m7G
- 7-methylguanosine
- PABP
- poly(A)-binding protein
- FI
- fluorescein.
REFERENCES
- 1.Gallie D. R. (2002) Plant. Mol. Biol. 50, 949–970 [DOI] [PubMed] [Google Scholar]
- 2.Carrington J. C., Freed D. D. (1990) J. Virol. 64, 1590–1597 [DOI] [PMC free article] [PubMed] [Google Scholar]
- 3.Gallie D. R., Browning K. S. (2001) J. Biol. Chem. 276, 36951–36960 [DOI] [PubMed] [Google Scholar]
- 4.Gallie D. R., Tanguay R. L., Leathers V. (1995) Gene 165, 233–238 [DOI] [PubMed] [Google Scholar]
- 5.Zeenko V., Gallie D. R. (2005) J. Biol. Chem. 280, 26813–26824 [DOI] [PubMed] [Google Scholar]
- 6.Pettersson R. F., Flanegan J. B., Rose J. K., Baltimore D. (1977) Nature 268, 270–272 [DOI] [PubMed] [Google Scholar]
- 7.Dougherty W. G., Carrington J. C. (1988) Annu. Rev. Phytopathol. 26, 123–143 [Google Scholar]
- 8.Pestova T. V., Shatsky I. N., Hellen C. U. (1996) Mol. Cell. Biol. 16, 6870–6878 [DOI] [PMC free article] [PubMed] [Google Scholar]
- 9.Ray S., Yumak H., Domashevskiy A., Khan M. A., Gallie D. R., Goss D. J. (2006) J. Biol. Chem. 281, 35826–35834 [DOI] [PubMed] [Google Scholar]
- 10.Pestova T. V., Hellen C. U., Shatsky I. N. (1996) Mol. Cell. Biol. 16, 6859–6869 [DOI] [PMC free article] [PubMed] [Google Scholar]
- 11.Sonenberg N. (1996) in Translational Control (Hershey J. W. B., Mathews M. B., Sonenberg N. eds) pp. 245–269, Cold Spring Laboratory Press, Cold Spring Harbor, NY [Google Scholar]
- 12.Le H., Tanguay R. L., Balasta M. L., Wei C. C., Browning K. S., Metz A. M., Goss D. J., Gallie D. R. (1997) J. Biol. Chem. 272, 16247–16255 [DOI] [PubMed] [Google Scholar]
- 13.Tarun S. Z., Jr., Sachs A. B. (1996) EMBO J. 15, 7168–7177 [PMC free article] [PubMed] [Google Scholar]
- 14.Merrick W. C. (1992) Microbiol. Rev. 56, 291–315 [DOI] [PMC free article] [PubMed] [Google Scholar]
- 15.Gingras A. C., Raught B., Sonenberg N. (1999) Annu. Rev. Biochem. 68, 913–963 [DOI] [PubMed] [Google Scholar]
- 16.Hershey J. W. B., Merrick W. C. (2000) in Translational Control of Gene Expression (Sonenberg N., Hershey J. W. B., Merrick W. C. eds) pp. 33–88, Cold Spring Harbor Laboratory Press, Cold Spring Harbor, NY [Google Scholar]
- 17.Morley S. J. (2001) in Signaling Pathway for Translation (Rhoads R. E. ed) pp. 1–37, Springer-Verlag, Berlin [Google Scholar]
- 18.Gallie D. R. (1998) Gene 216, 1–11 [DOI] [PubMed] [Google Scholar]
- 19.Wells S. E., Hillner P. E., Vale R. D., Sachs A. B. (1998) Mol. Cell 2, 135–140 [DOI] [PubMed] [Google Scholar]
- 20.Marcotrigiano J., Gingras A. C., Sonenberg N., Burley S. K. (1997) Cell 89, 951–961 [DOI] [PubMed] [Google Scholar]
- 21.Niedzwiecka A., Marcotrigiano J., Stepinski J., Jankowska-Anyszka M., Wyslouch-Cieszynska A., Dadlez M., Gingras A. C., Mak P., Darzynkiewicz E., Sonenberg N., Burley S. K., Stolarski R. (2002) J. Mol. Biol. 319, 615–635 [DOI] [PubMed] [Google Scholar]
- 22.Tomoo K., Shen X., Okabe K., Nozoe Y., Fukuhara S., Morino S., Sasaki M., Taniguchi T., Miyagawa H., Kitamura K., Miura K., Ishida T. (2003) J. Mol. Biol. 328, 365–383 [DOI] [PubMed] [Google Scholar]
- 23.Matsuo H., Li H., McGuire A. M., Fletcher C. M., Gingras A. C., Sonenberg N., Wagner G. (1997) Nature Struct. Biol. 4, 717–724 [DOI] [PubMed] [Google Scholar]
- 24.Carberry S. E., Rhoads R. E., Goss D. J. (1989) Biochemistry 28, 8078–8083 [DOI] [PubMed] [Google Scholar]
- 25.Sha M., Wang Y., Xiang T., van Heerden A., Browning K. S., Goss D. J. (1995) J. Biol. Chem. 270, 29904–29909 [DOI] [PubMed] [Google Scholar]
- 26.Blachut-Okrasinska E., Bojarska E., Niedźwiecka A., Chlebicka L., Darzynkiewicz E., Stolarski R., St piński J., Antosiewicz J. M. (2000) Eur. Biophys. J. 29, 487–498 [DOI] [PubMed] [Google Scholar]
- 27.Dlugosz M., Blachut-Okrasińska E., Bojarska E., Darzynkiewicz E., Antosiewicz J. M. (2003) Eur. Biophys. J. 31, 608–616 [DOI] [PubMed] [Google Scholar]
- 28.Khan M. A., Goss D. J. (2005) Biochemistry 44, 4510–4516 [DOI] [PubMed] [Google Scholar]
- 29.Slepenkov S. V., Darzynkiewicz E., Rhoads R. E. (2006) J. Biol. Chem. 281, 14927–14938 [DOI] [PubMed] [Google Scholar]
- 30.Slepenkov S. V., Korneeva N. L., Rhoads R. E. (2008) J. Biol. Chem. 283, 25227–25237 [DOI] [PMC free article] [PubMed] [Google Scholar]
- 31.Minich W. B., Balasta M. L., Goss D. J., Rhoads R. E. (1994) Proc. Natl. Acad. Sci. U.S.A. 91, 7668–7672 [DOI] [PMC free article] [PubMed] [Google Scholar]
- 32.Khan M. A., Goss D. J. (2004) Biochemistry 43, 9092–9097 [DOI] [PubMed] [Google Scholar]
- 33.Wei C. C., Balasta M. L., Ren J., Goss D. J. (1998) Biochemistry 37, 1910–1916 [DOI] [PubMed] [Google Scholar]
- 34.Khan M. A., Yumak H., Gallie D. R., Goss D. J. (2008) Biochim. Biophys. Acta 1779, 622–627 [DOI] [PubMed] [Google Scholar]
- 35.Jang S. K., Kräusslich H. G., Nicklin M. J., Duke G. M., Palmenberg A. C., Wimmer E. (1988) J. Virology 62, 2636–2643 [DOI] [PMC free article] [PubMed] [Google Scholar]
- 36.Pelletier J., Sonenberg N. (1988) Nature 334, 320–325 [DOI] [PubMed] [Google Scholar]
- 37.Carberry S. E., Goss D. J. (1991) Biochemistry 30, 4542–4545 [DOI] [PubMed] [Google Scholar]
- 38.Katsamba P. S., Myszka D. G., Laird-Offringa I. A. (2001) J. Biol. Chem. 276, 21476–21481 [DOI] [PubMed] [Google Scholar]
- 39.Bradford M. M. (1976) Anal. Biochem. 72, 248–254 [DOI] [PubMed] [Google Scholar]
- 40.Lax S. R., Lauer S. J., Browning K. S., Ravel J. M. (1986) Methods Enzymol. 118, 109–128 [DOI] [PubMed] [Google Scholar]
- 41.van Heerden A., Browning K. S. (1994) J. Biol. Chem. 269, 17454–17457 [PubMed] [Google Scholar]
- 42.Cheng S., Gallie D. R. (2006) J. Biol. Chem. 281, 24351–24364 [DOI] [PubMed] [Google Scholar]
- 43.Cheng S., Gallie D. R. (2007) J. Biol. Chem. 282, 25247–25258 [DOI] [PubMed] [Google Scholar]
- 44.Khan M. A., Miyoshi H., Gallie D. R., Goss D. J. (2008) J. Biol. Chem. 283, 1340–1349 [DOI] [PubMed] [Google Scholar]
- 45.Yisraeli J. K., Melton D. A. (1989) Methods Enzymol. 180, 42–50 [DOI] [PubMed] [Google Scholar]
- 46.Carberry S. E., Darzynkiewicz E., Goss D. J. (1991) Biochemistry 30, 1624–1627 [DOI] [PubMed] [Google Scholar]
- 47.Khan M. A., Miyoshi H., Ray S., Natsuaki T., Suehiro N., Goss D. J. (2006) J. Biol. Chem. 281, 28002–28010 [DOI] [PubMed] [Google Scholar]
- 48.Blachut-Okrasińska E., Bojarska E., Stepiński J., Antosiewicz J. M. (2007) Biophys. Chem. 129, 289–297 [DOI] [PubMed] [Google Scholar]
- 49.Gallie D. R. (2001) J. Virol. 75, 12141–12152 [DOI] [PMC free article] [PubMed] [Google Scholar]
- 50.Gradi A., Svitkin Y. V., Imataka H., Sonenberg N. (1998) Proc. Natl. Acad. Sci. U.S.A. 95, 11089–11094 [DOI] [PMC free article] [PubMed] [Google Scholar]
- 51.Svitkin Y. V., Gradi A., Imataka H., Morino S., Sonenberg N. (1999) J. Virol. 73, 3467–3472 [DOI] [PMC free article] [PubMed] [Google Scholar]
- 52.Borman A. M., Kean K. M. (1997) Virology 237, 129–136 [DOI] [PubMed] [Google Scholar]
- 53.Pilipenko E. V., Pestova T. V., Kolupaeva V. G., Khitrina E. V., Poperechnaya A. N., Agol V. I., Hellen C. U. (2000) Genes Dev. 14, 2028–2045 [PMC free article] [PubMed] [Google Scholar]