Abstract
We present a 250ns simulation of the wild-type, biotin-liganded streptavidin tetramer in the solution phase and compare the trajectory to two previously published simulations of the protein in its crystal lattice. By performing both types of simulations, we are able to interpret the protein’s behavior in solution in the context of its X-ray structure. We find that the rate of conformational sampling is increased in solution over the lattice environment, although the relevant conformational space in solution is also much larger, as indicated by overall fluctuations in the positions of backbone atoms. We also compare the distributions of χ1 angles sampled by side chains exposed to solvent in the lattice and in the solution phase, obtaining overall good agreement between the distributions obtained in our most rigorous lattice simulation and the crystallographic χ1 angles. We observe changes in the χ1 distributions in the solution phase, and note an apparent progression of the distributions as the environment changes from a tightly packed lattice filled with crystallization media to a bath of pure water. Finally, we examine the interaction of biotin and streptavidin in each simulation, uncovering a possible alternate conformation of the biotin carboxylate tail. We also note that a hydrogen bond observed to break transiently in previous solution phase simulations is predominantly broken in this much longer solution phase trajectory; in the lattice simulations, the lattice environment appears to help maintain the hydrogen bond, but more sampling will be needed to confirm whether the simulation model truly gives good agreement with the X-ray data in the lattice simulations. We expect that pairing solution phase biomolecular simulations with crystal lattice simulations will help to validate simulation models and improve the interpretation of experimentally determined structures.
Keywords: protein simulation, molecular dynamics, atomic fluctuations, rotamer, surface residue, lattice
1 Introduction
It is a common practice for computational chemists to perform a simulation of a solvated protein or other biomolecule beginning from the coordinates of an X-ray structure. The simulations are routinely performed in atomic detail, with explicit representation of all solvent molecules, counterions, and important ligand molecules. In contrast, simulations of proteins in the crystal lattices that produced the original X-ray data are rare, and so the vast majority of protein simulations are not directly comparable to the structural data from which they originate. This discrepancy has impeded efforts to validate molecular force fields for use in simulations of biomolecules, where the structures are too complicated for validation with simple thermodynamic parameters [1] [2], spectral analysis of secondary structures [3], or detailed quantum mechanical calculations [4].
However, simulations that recreate biomolecular crystal lattices [5] [6] are more comparable to the highly detailed structural information and thermal motions of individual atoms from X-ray diffraction experiments. Several factors, such as the inability to simulate cryogenic temperatures of some diffraction studies and uncertainty as to the exact concentrations of crystallization solution additives in the crystal interstices still make the comparison inexact, but performing such simulations in tandem with the more typical solution-phase simulations can reinforce observations of the fully solvated protein if the lattice simulations give strong agreement with the available structural data. Differences between the two simulations can also indicate motions unique to the fully solvated protein that open up drug binding sites [7] [8] or, if the biochemical role of the protein is known and incompatible with the available crystal structure [9], suggest a mechanism for the protein’s function.
Here, we present a 250ns, all-atom molecular simulation of the biotin-liganded streptavidin tetramer in solution. This simulation uses similar parameters and protocols to a previous study [6] of a pair of 250ns crystal lattice simulations on the same protein-ligand complex. In one of these simulations, we made an effort to reproduce the experimental crystallization solution (including 1.4M ammonium sulfate) and glycerol cryoprotectant; in the other, we simply filled the crystal lattice voids with water. Although modeling the crystallization conditions resulted in much better agreement with the X-ray structure and atomic fluctuations, the lattice simulation performed with pure water can serve as a valuable theoretical tool. Because that simulation lies midway between the present solution-phase simulation where the tetramer is immersed in water and the crystal structure where several tetramers are packed together with glycerol and salts, certain differences between the crystal lattice simulations and the solution-phase simulation may be attributable to crystal packing constraints or differences in the solvent conditions.
By comparing simulations in both phases, we can quantify the mobility that certain regions of the protein gain in solution as opposed to the crystal environment. The simulations also suggest that one feature of biotin ligation, intercalation of a water molecule into one of the biotin:streptavidin hydrogen bonds, changes in solution yet maintains agreement with the X-ray structure in the lattice environment. This study demonstrates a way to perform protein simulations with a better foundation for discriminating artifacts of the model from processes that warrant further experimental study. More studies along this line offer a new critical assessment of the utility of molecular simulations as the field continues to grow.
2 Methods
2.1 Structure preparation and molecular dynamics simulations
Coordinates for the initial state of the protein came from the 1.4Å resolution biotin-liganded streptavidin structure 1MK5 [10] in the Protein Data Bank. Several residues at the N- and C-termini of each of the streptavidin monomers were unobserved in this crystal, but were reconstructed by alignment with other streptavidin structures in a previous study to simulate the crystal unit cell in all-atom detail [6]. To have our solution-phase simulation correspond to the previous crystal lattice simulations, we extracted one of the tetramers from the starting structure for the crystal lattice simulations. The tetramer contained 508 amino acid residues in four identical polypeptide chains, and one biotin residue was bound to each polypeptide chain. More than 400 crystallographic water molecules (or symmetry-related copies of such water molecules) were also included. In the simulations of the crystal unit cell, the tetramer’s eight histidine residues were fully protonated to match the crystallization conditions (pH 4.5). However, to match the solution pH of 7 used in dissociation kinetics studies [11], we added protons only to the Nɛ1 atoms of histidines in the solution phase simulation to represent a neutral solution pH. At pH 4.5, the streptavidin monomer has no net charge; eight sodium counterions were added to neutralize the overall charge on the tetramer in solution. Roughly 11,500 water molecules were added to complete the solution phase system in a truncated octahedral box.
As in the crystal lattice simulations, the protein component of the system was modeled by the AMBER ff99 force field [12] [13] with modifications by Simmerling and co-workers [14] (hereafter the “AMBER ff99SB” force field). The SPC/E water model [15] and the sodium model from Åqvist [16] were used to parameterize the solvent, and biotin parameters were taken from previous work by Israilev and co-workers [17]. Force calculations were performed with periodic boundary conditions, a 9.0Å cutoff on real space interactions, a homogeneity assumption to approximate the contributions of long-range Lennard-Jones forces to the virial tensor, and smooth particle-mesh Ewald electrostatics [18]. The SHAKE algorithm [19] was used to constrain the lengths of all bonds to hydrogen atoms and the SETTLE algorithm [20] was used to constrain the internal geometry of all rigid SPC/E water molecules.
System equilibration was handled in roughly the same manner as equilibration for the crystal simulations. Positions of added hydrogens, solvent particles, and reconstructed protein residues were first relaxed by 2000 steps of steepest-descent energy minimization while crystallographically resolved protein atoms were held in place by 1000 kcal/mol-Å2 position restraints. The protein component of the system was then energy minimized while solvent particle positions were tightly restrained to their new positions, and finally all components of the system were energy-minimized with no restraints. Restrained dynamics of the system were conducted for a total of 450ps, beginning with a 0.5fs time step in the constant volume, constant temperature ensemble and 16.0 kcal/mol-Å2 restraints on all crystallographically observed protein atoms. The restraints were gradually reduced to 1.0 kcal/mol-Å2 over the first 150ps before switching to the constant pressure ensemble, increasing the time step to 1.5fs, and reducing the restraints to 0.0625 kcal/mol-Å2 over the next 300ps. Production dynamics were propagated in the constant pressure ensemble with a pressure of 1 bar and a 1.5fs time step for 250ns with no position restraints. The choice of a 1.5fs time step, with SHAKE constraining bonds to hydrogen atoms, was made as a compromise between the 2fs/SHAKE scheme that is common today and the 1fs/SHAKE scheme that was used in the past. We are analyzing various schemes involving different Lennard Jones and electrostatic real space cutoffs, electrostatic reciprocal space parameters, and time steps to devise optimal schemes that balance the various approximations for accurate, long-timescale equilibrium simulations.
All energy minimization and dynamics were performed with the PMEMD module of AMBER 9 [22]. The AMBER molecular dynamics modules offer a Berendsen barostat; in the case of the triclinic cell used for the internal representation of the truncated octahedron, only isotropic position rescaling is allowed in AMBER (as well as most other MD packages). Throughout all dynamics, a Langevin thermostat [21] with collision frequency 3ps−1 was used to maintain the system temperature at 298K. To avoid artifacts arising from reuse of particular sequences of random numbers [23], the random number generator seed was incremented with every restart of the dynamics.
3 Results
As stated in the introduction, two simulations of the 1MK5 crystal lattice are available for comparison [6]: the first contains a complete model of the crystallization conditions, including cryoprotectant and crystallization salts (the “cryo-solvated lattice”) and the second contains only water in the voids between lattice proteins (the “water-solvated lattice”). Here, the water-solvated lattice simulation serves as a theoretical tool to help us understand whether differences between the cryo-solvated lattice and the tetramer in solution (surrounded by pure water with a few sodium counterions) are due to the removal of lattice contacts or instead arise because of the radically different solvent conditions.
For the lattice simulations, residues present in the actual crystal but unobserved at the N and C termini of each chain in the 1MK5 structure were reconstructed by alignment with other structures of streptavidin. However, only the residues observed in the 1MK5 structure, residues 14–134 in the first monomer and residues 16–135 in the second monomer, were considered for analyses of the lattice simulations. That convention is maintained in this study. The numbering and atom naming conventions used in this text follow those used in the 1MK5 structure.
3.1 Analysis of trajectory stability and sampling
The biologically active form of streptavidin is a dimer of dimers (see Figure 2 of the Supporting Information); in the 1MK5 crystal structure, this arrangement is reflected by the fact that the crystal asymmetric unit is a biotin-liganded streptavidin dimer. The tetramer displays D2 symmetry, but in the 1MK5 crystal, only one of the molecular dyads superposes with a crystallographic symmetry operator. In the crystal, lattice contacts enforce some subtle asymmetries between the tightly coupled monomers of the streptavidin dimer, but because these contacts are absent in solution we would expect to recover the symmetry between all four monomers and obtain similar conformational spaces for all four monomers if dynamics are propagated long enough. It is therefore useful to monitor the stability of individual monomers, dimers, and the tetramer as a whole; we chose the metric of root-mean-squared deviation (RMSD) for coordinates of residues observed in the 1MK5 structure with the crystallographic coordinates as the reference.
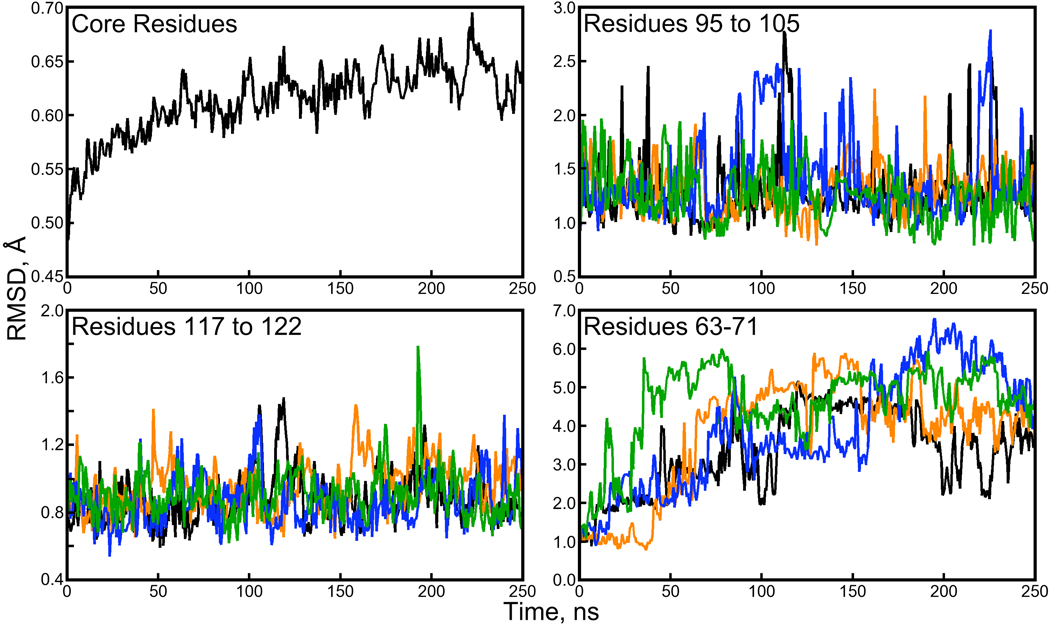
Figure 2. Backbone RMSD for subdomains of the streptavidin proteins.
A plot of the average backbone RMSD for “core residues” (a total of 67 within each monomer, illustrated in Figure 1 of the Supporting Information) shows much lower backbone RMSD than the monomers or tetramer as a whole. It is the loop regions of the protein, particularly residues 63 to 71, that depart the most from their crystallographic conformations. Plots of loop backbone RMSDs were generated by aligning the core residues of each snapshot with the 1MK5 structure and then computing RMSD for the subset of residues listed in each panel. The color scheme for three of the panels follows Figure 1.
Figure 1 displays measurements of RMSD over the course of the simulation; backbone RMSD of the tetramer in solution converged after 75ns, whereas in the cryo- or water- solvated lattice simulations the backbone RMSD converged after 100 to 150ns. The biotin-liganded streptavidin tetramer was stable throughout the 250ns of production dynamics, although the backbone RMSDs observed for the tetramer and its component dimers in solution were roughly 20% and 30% greater than those observed in the water-solvated crystal lattice, and 70% greater than the backbone RMSDs observed in the cryo-solvated crystal lattice.
Figure 1. Backbone RMSDs of the individual monomers and the tetramer.
Backbone RMSDs for the four individual streptavidin monomers are shown in the left panel. Overall, the tetramer RMSD shown in the right panel is only slightly greater than the average monomer RMSD. Figure 2 shows that the monomer RMSD is driven primarily by one highly flexible loop.
Examination of the backbone RMSDs for individual monomers reveals sudden, reversible changes, suggesting that the monomers are making excursions in their individual conformational spaces as they fluctuate about some average structure. In our studies of the lattice simulations, we noted that the β-barrel cores of the proteins remain extremely stable throughout the simulations, and that three loop regions exhibiting the highest B-factors in the 1MK5 structure drive the overall backbone RMSD (see Figure 1 and Figure 3 of the Supporting Information for illustrations of these structures). Figure 2 shows that this is also true in the solution-phase; the fluctuations seen in the backbone RMSD plots of individual monomers reflect loop movements, particularly those of the loop containing residues 63 to 71. The β-barrel cores of each monomer, and even the relative positions of two β-barrel cores in each of the dimers, remain very close to their crystallographic conformations.
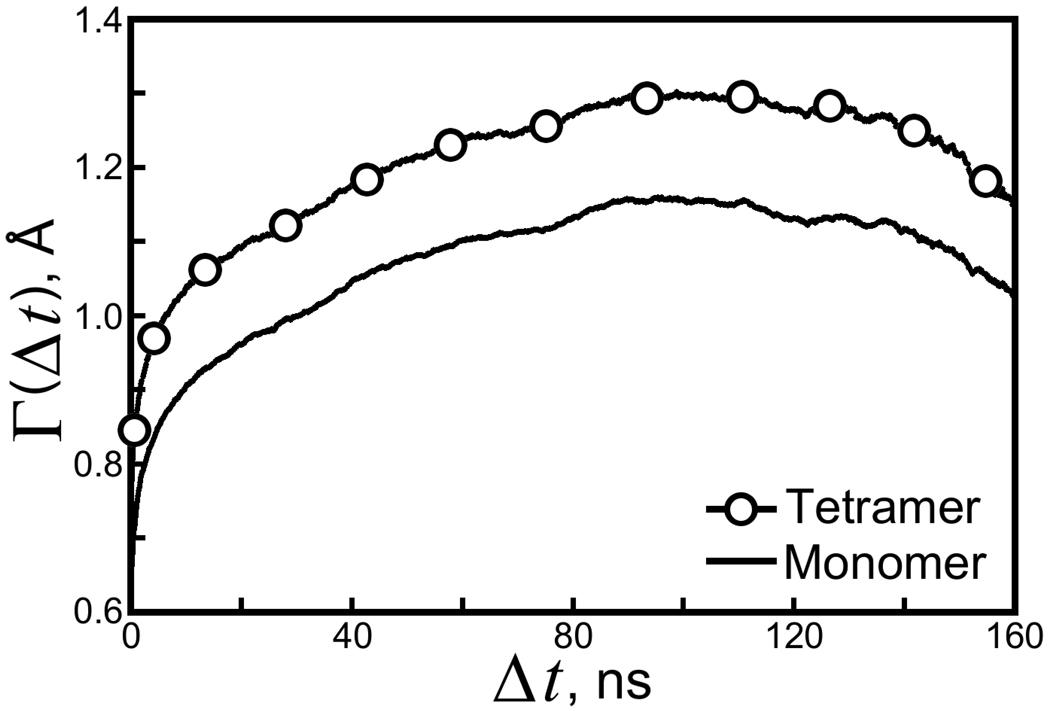
Figure 3. Average backbone RMSD accumulated in a given length of time.
The quantity Γ(Δt), defined in Equation 1, is plotted for individual streptavidin monomers (all four monomers are treated as equivalent groups) and the tetramer as a whole. Convergent values of Γ give measurements of the width of the protein’s conformational space in solution as well as the rate of sampling.
In solution, the tetramer backbone RMSD appears to converge more rapidly than it does in our crystal simulations. We therefore drew on a method for quantifying the rate of divergence, called Γ in our previous study. Most generally, Γ (Δt) represents an “average running RMSD,” obtained by computing the RMSD of a group of atoms relative to their conformation at some time Δt in the past, and can be defined as:
| (1) |
In Equation 1, k runs over each of the K equivalent groups of atoms and j runs over the N atoms within each group. (Note that the RMSD of the kth group of atoms is only taken relative to other conformations of the kth group, not some other equivalent group, as Γ measures the expected divergence of a group of atoms from its own conformation after some time Δt.) The limits of integration ti and tf represent the initial and final time points for integration to get an average value of the RMSD accumulated in some time Δt. Γ is plotted for the backbone conformations of streptavidin monomers in Figure 3. We set ti to 75ns, the time at which the monomer backbone RMSD appeared to converge, and set tf to 250ns. We computed Γ for values of Δt up to tf − ti − 25ns, because statistics for Γ worsen at values of Δt approaching tf − ti (note that Γ(tf − ti) is determined by the RMSD between only two snapshots). As was done in our crystal lattice simulations, the trajectory was abridged to make the calculation of Γ tractable; snapshots were selected every 150ps for analysis.
In the solution phase, Γ for the monomers reached a maximum of 1.2Å in roughly 100ns, offering estimates of both the system correlation time and the width of the conformational space in solution (see Figure 3). Similar results were obtained for Γ of the tetramer backbone. The decrease in Γ after 100ns shows that the estimate is not fully converged; if the dynamics were propagated for an extremely long time Γ would increase monotonically, asymptotic to a maximum value. Nonetheless, 100ns appears to be a reasonable estimate of the time needed for the backbone RMSD of the solvated protein to move from one region of its conformational space to another. In contrast, measurements of Γ for the dimer backbones in our crystal lattice simulations did not converge within 200ns.
We had expected that a simulated crystal lattice would require less relaxation and therefore present an easier sampling problem than proteins extracted from crystal structures and simulated in solution, where the conformational space is potentially much larger. The RMSD results in Figure 1 and our previous study confirm that the simulated streptavidin structure remains closer to its X-ray structure if the lattice is reproduced. Combining these results with measurements of Γ suggests that the conformational space of the protein differs significantly in the crystal and solution environments (note that Γ for the streptavidin monomers reaches a maximum value of less than 1.2Å whereas the average monomer RMSD relative to the 1MK5 structure reaches a maximum of 1.7Å—once equilibrium is reached in solution, the streptavidin monomers are unlikely to sample their crystallographic conformations). The measurements of Γ also indicate that the correlation times are shorter in solution than in the crystal environment, implying that sampling in the lattice phase may not be improved as much as the advantages of a smaller relevant conformational space and multiple symmetry-related copies of the system would initially suggest.
3.2 Atomic fluctuations in the solution phase
In our previous studies of the streptavidin crystal, we were able to obtain very good agreement between the isotropic B-factors from the 1MK5 structure and our simulations, even reproducing the correct asymmetry between fluctuations in the Trp120 regions of each streptavidin monomer within the crystal asymmetric unit (ASU). In order to recover the right level of fluctuations in the most stable regions of the protein, it was necessary to align the eight ASUs using only the symmetry operations of the 1MK5 crystal’s I222 space group rather than making optimal alignments of all ASUs to some average structure. The inclusion of this “lattice disorder,” the non-ideality of the crystal lattice that also contributes to experimental temperature factors, raised the fluctuations of all atoms in the ASU.
There are two major issues to settle before comparing atomic fluctuations from the lattice and solution phase simulations. The first is that atomic fluctuations in the solution phase have no contributions from lattice disorder because there is no lattice; indeed, fluctuations from earlier solution phase simulations have been reported to be smaller than those observed in X-ray structures [24]. The streptavidin lattice simulations present another complication: in the lattice simulations and the crystal structure, the ASU is a dimer and therefore we can expect two distinct groups of monomers, exposed to different packing constraints, to exhibit different atomic fluctuations. In the solution phase, however, all monomers are exposed to the same environment and so we can define only one group of monomers. The second issue pertains to the limited amount of sampling that can be accomplished in a simulation, even with modern computers; this sampling limitation may also lower the calculated fluctuations. The fact that the 250ns lattice simulations contained four streptavidin tetramers means that, if the lattice tetramers were able to move independently within their equilibrium conformational spaces, as much as four times the sampling was accomplished in each of the 250ns lattice simulations as in the present 250ns simulation in the solution phase.
In short, a comparison between the atomic fluctuations in the solution phase and the lattice simulations depends on the method of aligning the snapshots and accounting for the overall amount of sampling in each case. We chose to recompute atomic fluctuations for the cryo-solvated crystal lattice simulation by making optimal alignments of its eight ASUs, providing information for each of the two distinct monomers in that simulation. We computed atomic fluctuations for the solution phase simulation by making optimal alignments of each of its four streptavidin monomers. The first 75ns of each simulation was discarded for this analysis. We therefore had eight 175ns trajectory segments relating to each of the two distinct monomers in the cryo-solvated lattice simulation, and four 175ns trajectory segments relating to streptavidin monomers in the solution phase simulation. Atomic fluctuations from any two trajectory segments were comparable in terms of sampling, so we compared the mean and standard deviations of the atomic fluctuations from four or eight trajectory segments in the solution phase and lattice simulations, respectively, as shown in Figure 4.
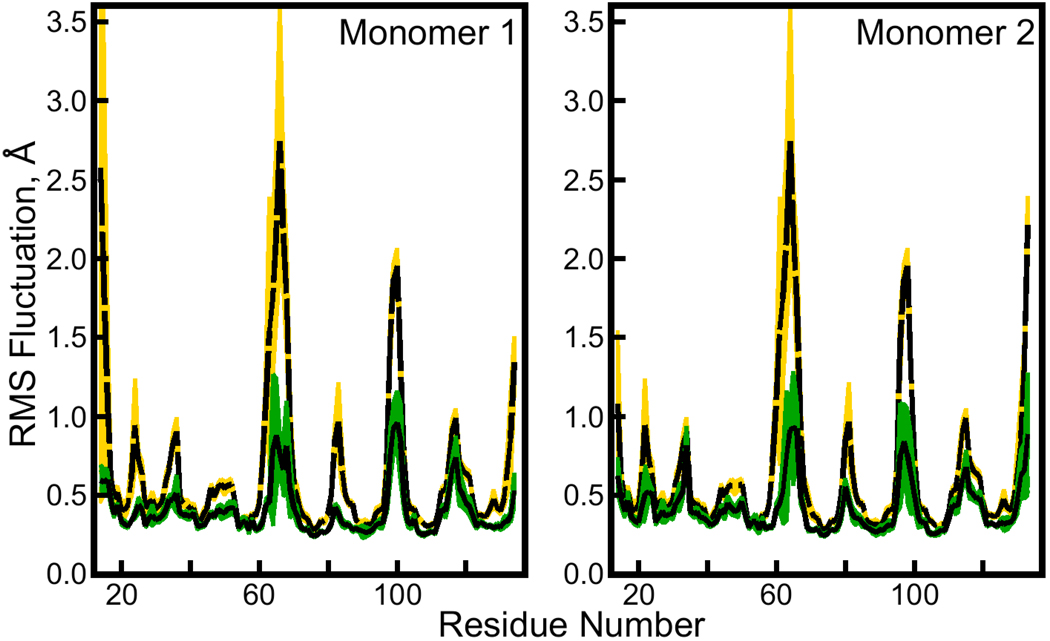
Figure 4. Atomic root mean squared (RMS) fluctuations for backbone Cα atoms in the solution-phase and cryo-solvated lattice simulations.
Atomic RMS fluctuations were computed by first making optimal alignments based on the positions of backbone atoms. The solution phase simulation contained four independent, symmetry-related streptavidin monomers, whereas the lattice simulation contained eight independent, symmetry-related asymmetric units (ASUs), each of them a streptavidin dimer. The black lines surrounded by green and the dashed black line surrounded by yellow show average atomic RMS fluctuations from the eight ASUs in the lattice simulation and four monomers in the solution phase simulation, respectively. The green and yellow regions themselves represent standard deviations in the atomic fluctuations computed for the ASUs or monomers. Fluctuations for each of the two monomers (“Monomer 1” and “Monomer 2”) in the lattice simulation ASU are plotted separately; the fluctuations of all monomers from the solution-phase simulation are given in both parts of the figure.
As the degree of sampling in either solution-phase or crystal lattice simulations increases, the fluctuations of a single ASU, or any individual subunit of the biomolecule, should approach those of all its symmetry-related neighbors. In this respect, Figure 4 shows that the fluctuations of loop regions were not converged for individual ASUs of the lattice simulations nor for individual monomers of the solution-phase simulations. By the measurements of Γ in Section 3.1, the 100 ns relaxation time of this system did not quite elapse twice over the 175 ns length of trajectory used to analyze the atomic fluctuations. Microseconds of equilibrium simulation may be required to achieve convergent atomic fluctuations, in either the lattice or solution phase. Nonetheless, the availability of four individual monomers in the solution-phase simulation provides a much better chance to observe new conformations of solvated streptavidin’s loop regions that are not sampled in the protein’s crystal form, even if the relative populations of such states cannot be quantified.
The results in Figure 4 clearly show that certain loop regions of the protein became more flexible in solution than they were in the crystal lattice. The most significant increases occurred in residues 63 to 71 and in residues 95 to 105, two of the solvent-exposed loop regions identified in the lattice simulations. In contrast, fluctuations in residues 117 to 122, a third loop region exposed to the solvent in the crystal lattice, increased very little when the protein was simulated in solution.
In the 1MK5 crystal, the tips of loops formed by residues 63 to 71 of the first monomer contact one another, and the loop tips would in fact clash if both adopted the observed conformation at the same time (the observed conformation has only 50% occupancy—other distinct conformations were not observed, but apparently accommodate the conformation that is observed). There are no obvious hydrophobic interactions to stabilize the interaction of the tips, and there are no hydrogen bonding interactions evident between them. In the second monomer, this loop is even more exposed to solvent and the tips do not form crystal contacts with any symmetry-related neighbors. Similarly, the tips of loops formed by residues 95 to 105 in the second monomer come very close to one another, in this case with 100% occupancy for the observed conformation and without any clashes, although there is again no obvious interaction to stabilize the contact.
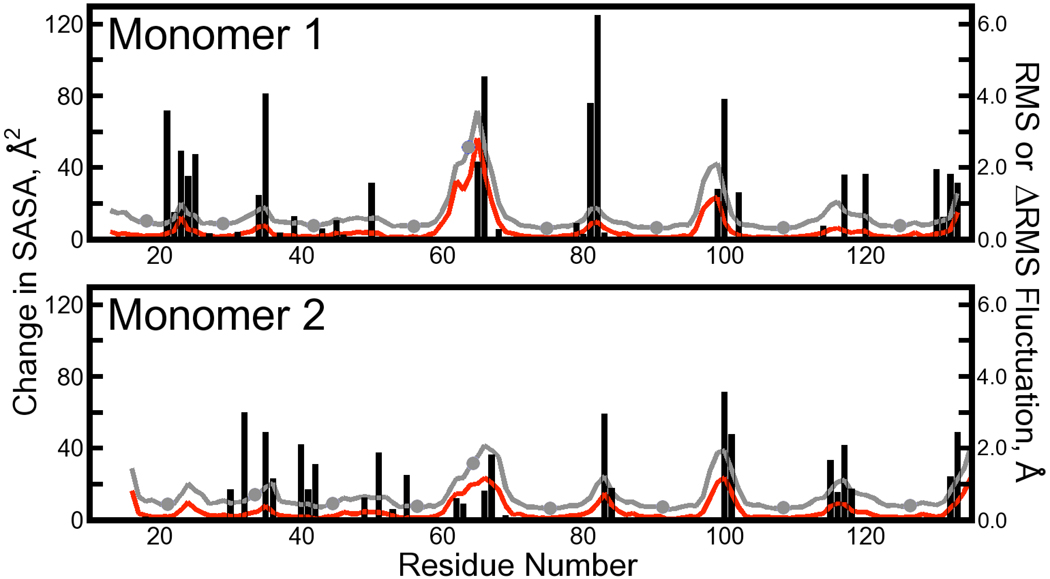
The increases in flexibility of one loop region, residues 80 to 88, are likely related to the removal of crystal contacts. Tyr83 gains 120Å2 and 60Å2 of solvent-accessible surface area (SASA) in the first and second monomers, respectively, when the tetramer is taken from the crystal lattice into solution (see Figure 5). In the cryo-solvated lattice simulation, the fluctuations of Cα atoms in residues 80 to 88 show good agreement with those in the 1MK5 structure, particularly in the first monomer; fluctuations of this loop increase significantly when the protein is simulated in solution. The hydroxyl group of Tyr83 in the first monomer also appears to bond to Thr42 on the second monomer of a symmetry-related dimer; in this manner the Tyr83 side chain forms a very strong crystallographic contact that may dampen the motions of the residues 80 to 88 loop in crystallized streptavidin.
Figure 5. Juxtaposition of changes in atomic fluctuations with increases in residue solvent-accessible surface area (SASA).
Atomic fluctuations, plotted as gray lines with filled circles, were computed for backbone Cα atoms from the solution phase trajectory data as in Figure 4. Differences in the magnitudes of these fluctuations and those collected from the cryo-solvated lattice simulation are plotted as red lines. Changes in SASA resulting from taking the streptavidin tetramer out of the lattice and into solution are superimposed as black bars.
Figure 5 clearly shows that regions of the protein with the highest fluctuations correspond to regions that gain some amount of SASA when the tetramer is taken into solution. However, the overall correlation between increases in fluctuations and increases in SASA upon removal of crystal lattice contacts is not strong. The relationship between these two quantities is indirect because it is typically the solvent exposure of charged or aromatic side chains such as Glu101, Arg103, or Tyr83 that produces large increases in SASA; increasing mobility of side chains does not necessarily change the backbone dynamics. In the next section, we examine χ1 angles for amino acids that gain significant surface area to provide additional insights on dynamics at the streptavidin surface.
3.3 Changes in χ1 distributions in the lattice and solution-phase simulations
With backbone motions and fluctuations characterized, descriptions of side chain χ1 distributions are a natural choice for describing protein conformations in incrementally greater detail. As in previous analyses, side chain χ1 angles observed in our lattice simulations can be compared directly to the available X-ray data, although as will be explained it is not always simple to determine whether there are meaningful differences between the crystal lattice and solution phase simulations. We chose to focus on seven of the streptavidin monomer’s side chains in particular, all of which are exposed to solvent in the solution phase but some of which are involved in crystal contacts in the lattice. Other side chains either had no defined χ1 rotamers (Ala and Gly), could not be expected to undergo significant conformational shifts on the timescale of our simulations (Pro), or had very little solvent exposure in either the crystal or solution phases. As before, we discarded the first 75ns of all three simulations for this analysis.
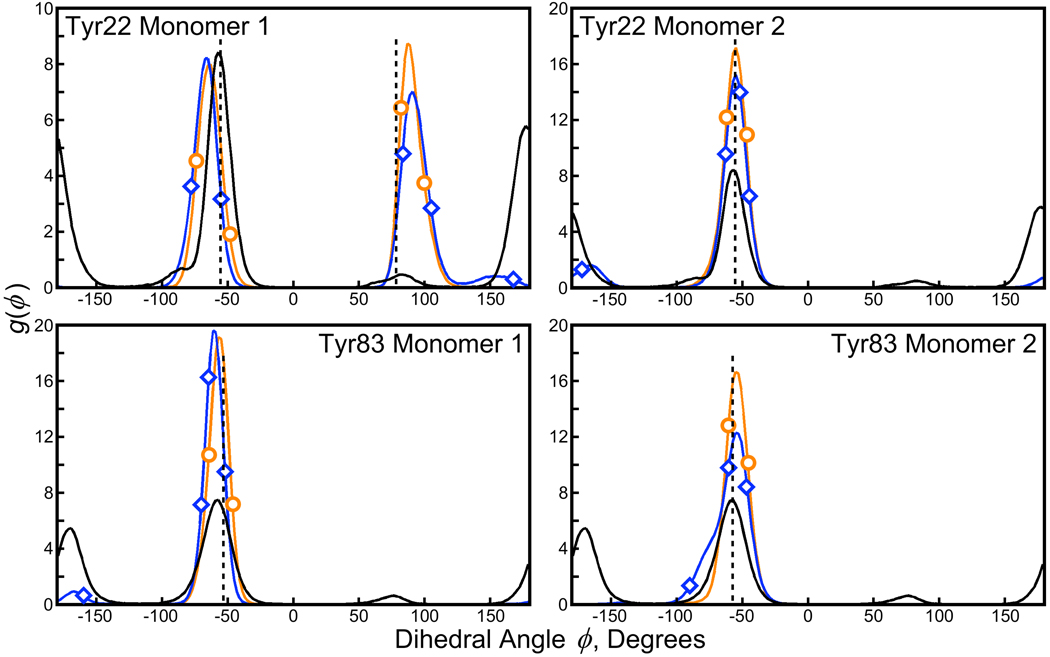
In the cyro-solvated lattice simulation, the χ1 distributions for side chains of Tyr22 and Tyr83 showed excellent agreement with the X-ray data (see Figure 6). In the water-solvated lattice simulation, alternate rotamers become sparsely populated, and when the tetramer is taken into solution these alternate rotamers become significantly populated. Another residue that shows similar behavior is Asp67, sitting at the tip of the most flexible loop discussed in Section 3.2. However, as noted earlier, the observed state of this residue has only 50% occupancy in the experimental structure and so it is not given further consideration.
Figure 6. χ1 distributions for tyrosine residues making lattice contacts in the 1MK5 structure.
Experimental values of χ1 are given by the black dashed vertical lines in each panel; distributions of χ1 observed in the cryo-solvated and water-solvated lattice simulations are given by the orange line marked with circles and the blue line marked with diamonds, respectively; distributions from the solution-phase simulation are given by the solid black line. Distributions from each lattice represent averages over eight symmetry-related monomers, and each of two monomers in the asymmetric unit are distinguished on the right and left halves of the figure. Distributions in the solution phase represent averages over all four monomers of each simulation (note that the y-axis scale for the top left panel differs from the other three panels). New conformational states of each tyrosine are found in solution; similar states begin to become populated in the lattice phase if the crystallization conditions are approximated with pure water. Figure 7 shows results for seven streptavidin crystals isomorphous with 1MK5, but we observed no diversity among the crystallographic χ1 values for these tyrosine residues.
The Trp120 side chain populates only the crystallographic χ1 rotamer in all of the simulations; we never observe it to break its contact with biotin bound to an adjacent subunit.
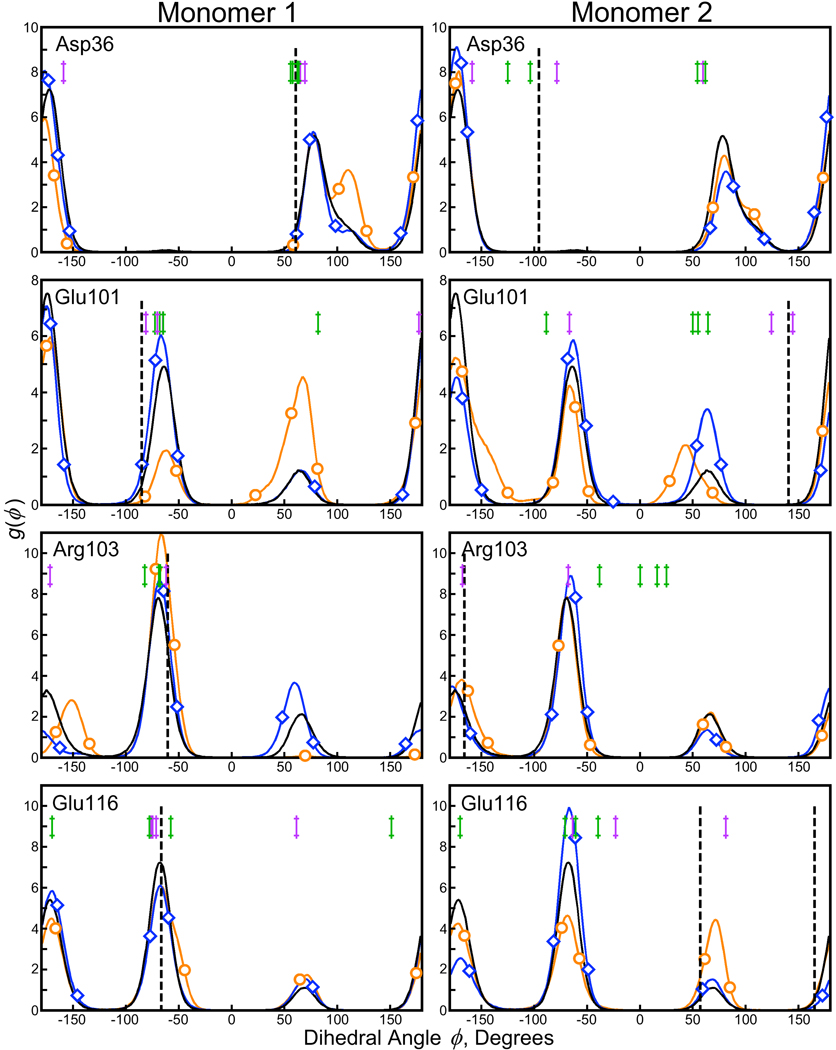
Several side chains departed from their crystallographic conformations even in the cryo-solvated lattice: Asp36, Glu101, Arg103, and Glu116. Figure 7 shows χ1 distributions for these residues. Our results may not be in agreement with the 1MK5 crystal structure, but χ1 angles for these side chains found in isomorphous streptavidin crystals (superimposed against the distributions in Figure 7) are highly variable. Surprisingly, the variability persists even in structures 1MK5, 1LUQ, 1DF8 [25], and 2F01 [26]: all of these crystals were grown in 1.4–1.6M ammonium sulfate solutions with sodium chloride or sodium acetate, and X-ray diffraction was performed at cryogenic temperature. When four room-temperature streptavidin crystals (1LCV [27], 1SRI [28], 1PTS [29], and 1SLG [30]) are brought into consideration, the diversity in these dihedral angles grows even further. Disagreement between the simulation and the original X-ray data in the conformations of these residues does not mean that the simulation model contains errors; rather, it underscores the variability of the crystallographic experiments and the challenge of correlating detailed simulation data with X-ray results.
Figure 7. χ1 distributions for selected residues making lattice contacts in the 1MK5 structure.
Experimental value(s) for each dihedral angle as well as distributions obtained from solution phase and crystal lattice simulations are plotted according to the color scheme of Figure 6. Residues presented in this plot diverged from the results in the 1MK5 structure, but isomorphous crystals grown and analyzed under similar conditions (1DF8, 1LUQ, and 2F01) showed some diversity in the same dihedral angles (denoted by purple marks in each panel). When X-ray data was collected at room temperature, the diversity increased even further (structures 1LCV, 1PTS, 1SLG, and 1SRI; green marks in each panel). The differences between simulation and experiment are not necessarily errors; additional simulations with longer trajectories may help provide more certainty in the populations of each χ1 angle.
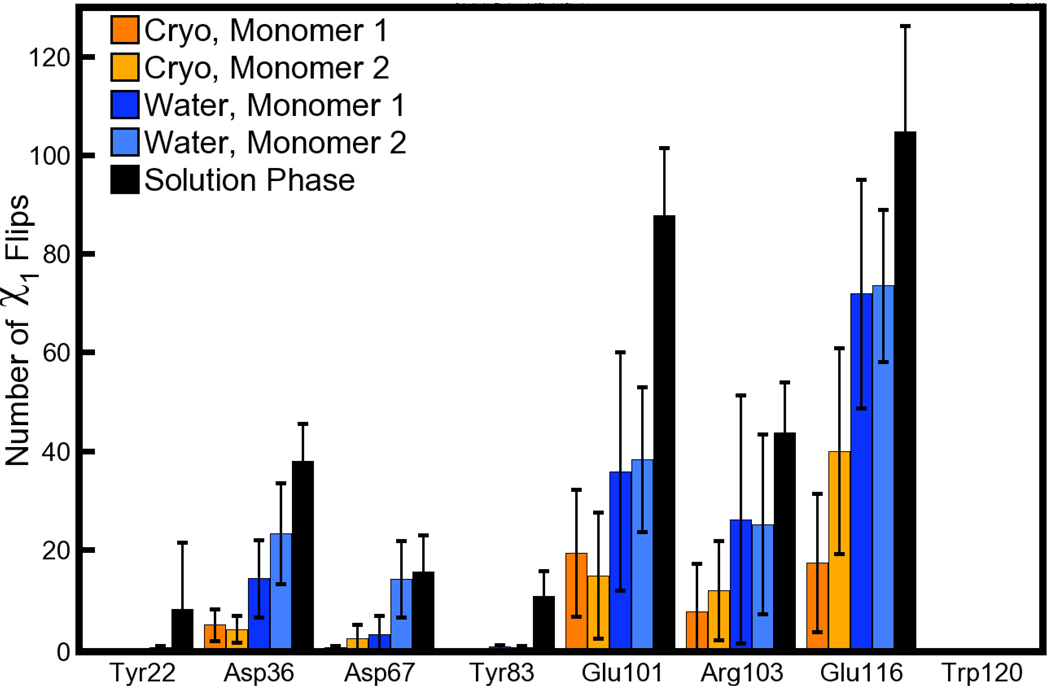
The relative sizes of populations in Figure 6 and Figure 7 are not in fact very certain; the plots appear smooth because each side chain is making infrequent jumps between different χ1 states and then sampling each basin thoroughly before making another jump. We therefore quantified the number of jumps between different states by first taking block averages of each χ1 angle over 75ps intervals to smooth the data, and then looking for changes of more than 60° between consecutive blocks. As shown in Figure 8, the number of jumps for several of the side chains was low for Tyrosine and Aspartate residues, and also decreased as the simulations made closer approximations of the 1MK5 crystallization conditions. For example, the alternate populations of Tyr22 seen in the water-solvated lattice (see Figure 6) stem from single flips in only one of eight ASUs. If a system has only two states, twenty flips will sample each state a total of only 10 times, whereas a typical standard in free energy calculations is to observe all distinct states of a system at least 40 times [31]. Therefore, even in the solution phase the conformations of some of the surface side chains are not well sampled.
Figure 8. Counts for χ1 flips in side chains making lattice contacts in the 1MK5 structure.
Flips are defined by a change of at least 60° in the average χ1 angle for two consecutive 75ps intervals. As in Figure 7, the number of flips is computed for each of two monomers and averaged over eight ASUs for each lattice simulation, but averaged over all four monomers of the solution-phase simulation. Error bars are derived from the standard deviation of the number of flips in the four or eight monomers for each case. In the legend, “Cryo” and “Water” refer to the cryo- and water-solvated lattices, respectively.
Observations that certain side chains visit different conformations in solution and in the crystal environment, and that their populations begin to make this shift in an intermediate environment, may tell an elegant story about solvent effects in protein surface chemistry. All streptavidin crystal structures that we considered showed similar conformations for Tyrosines 22 and 83, which the cryo-solvated lattice simulation reproduced correctly. In all cases where the cryo-solvated lattice simulation did not reproduce the particular side chain conformation present in the 1MK5 X-ray structure, the other streptavidin X-ray structures showed a diversity of side chain conformations. The difficulty of sampling some of these side chain conformations, even with 250ns trajectories and multiple symmetry-related subunits in each simulation, underscores the challenge of correlating detailed structural information from simulations with crystallographic data. However, additional pairs of crystal lattice and solution phase simulations on other systems, encompassing each amino acid side chain in a variety of crystal contacts and solvent-exposed environments, could provide valuable insights on the mobility of protein surface residues in solution.
3.4 Interaction of biotin and streptavidin
Simulations of proteins in solution have proven useful for identifying alternate conformations, not observed in the crystal environment, which can be be targets for drug design [7] [8]. It is also worthwhile to ask whether protein:ligand interactions that are observed in crystallographic studies change when the protein:ligand complex is released into solution. The Trp120 residue has already been noted to maintain its role in biotin ligation as seen in the 1MK5 structure. In this section, we examine the position of the biotin itself in the binding pocket and the behavior of a hydrogen bond connecting biotin to streptavidin.
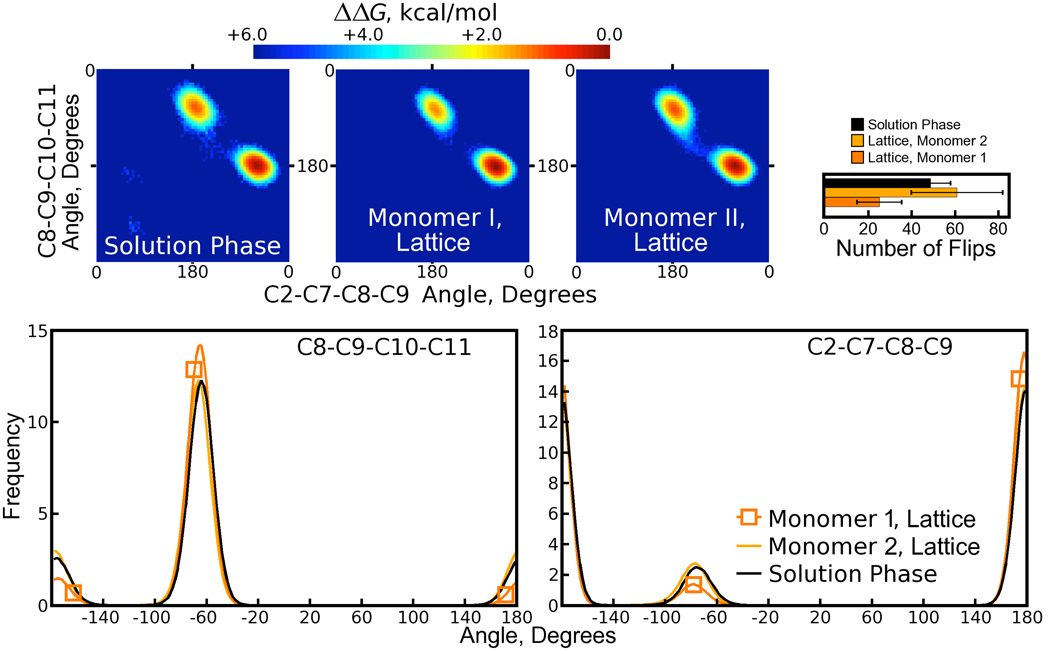
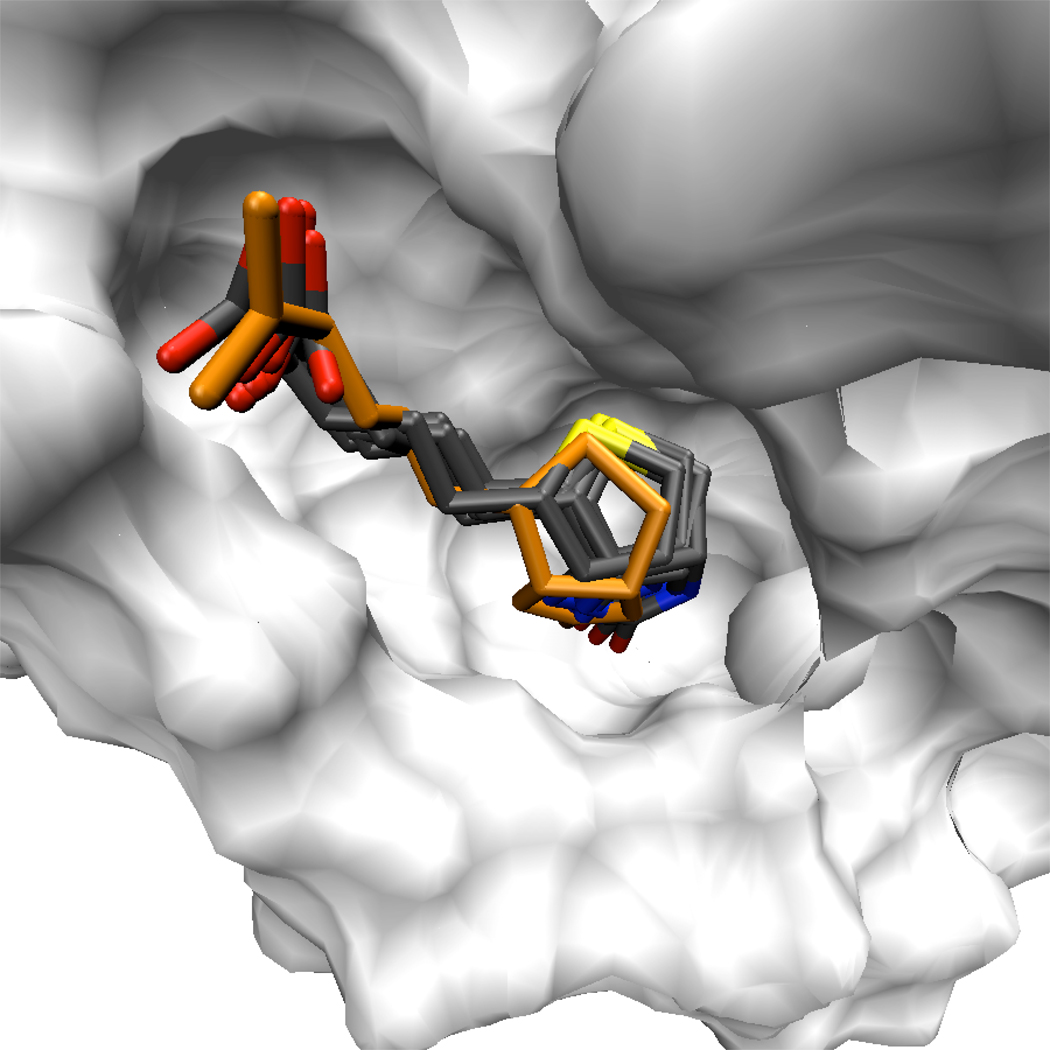
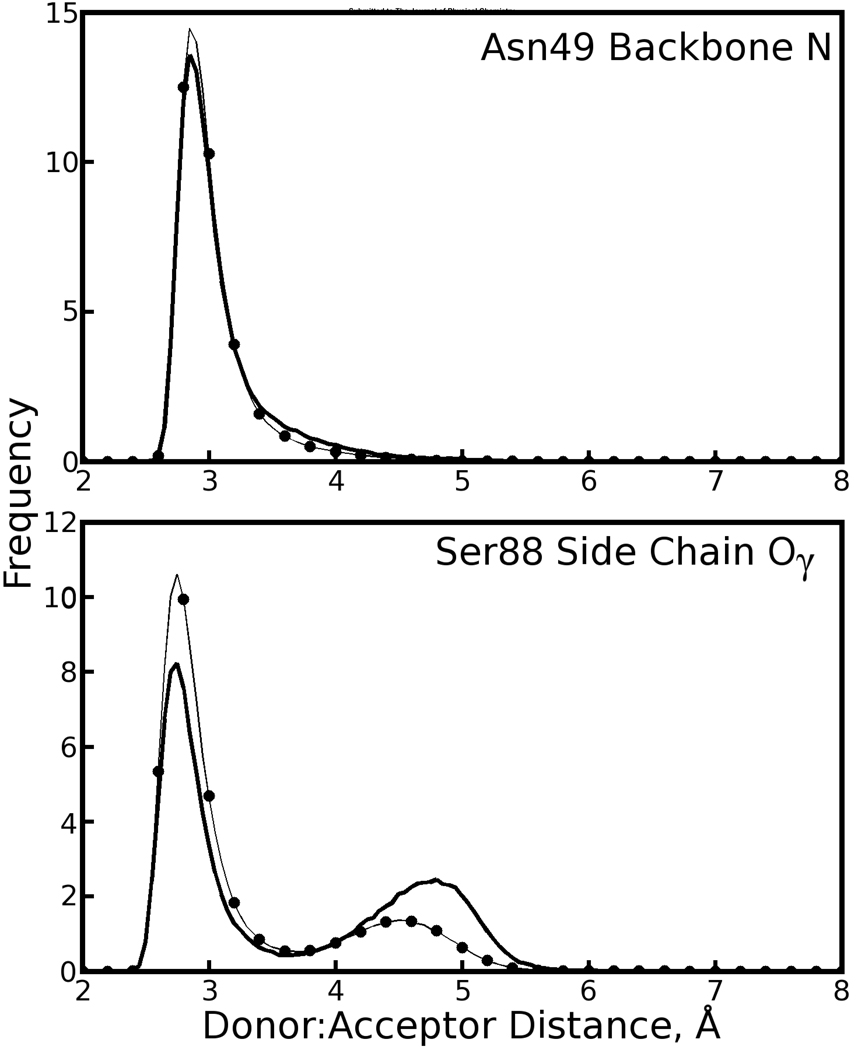
Analysis of the dihedral angles in the biotin “tail” (which we define as carbons C7, C8, C9, C10, and the carboxylate group) revealed two distinct conformations. While the major populations were close to the state of biotin observed in crystallography, minor populations of the C2-C7-C8-C9 and C8-C9-C10-C11 dihedral angles were observed in both the crystal and solution phase simulations, as shown in Figure 9. The minor populations of both dihedral angles were correlated, defining two conformational substates for the biotin tail. Alignment of many biotin conformations shows that, for either dihedral conformation, the plane of the carboxylate group remains in roughly the same orientation relative to the streptavidin core (see Figure 10). This probably results from favorable hydrogen bonding interactions between the tail and streptavidin residues 49 and 88, which are maintained in both environments for either conformation of the tail (see Table 1 and Figure 12).
Figure 9. An alternate conformation for the biotin carboxylate tail.
In both lattice and solution phase simulations, the biotin carboxylate tail is observed predominantly in its crystallographic conformation, but also in an alternate conformation defined by differences in two dihedral angles. Experimental values of the C2-C7-C8-C9, C7-C8-C9-C10, and C8-C9-C10-C11 angles are 180°, 180°, and −65°, respectively. (A schematic of the biotin molecule is provided in Figure 4 of the Supporting Information.) Free energy surfaces detailing the energetic differences and transition paths between two distinct states for the biotin tail are provided in the upper half of the figure. (Because the tail made frequent transitions between the two states, we were able to estimate the free energy surfaces directly from the logarithm of the probability of finding the tail in any given conformation.) A plot of the number of flips in each simulation, similar to those of Figure 8, is shown in the upper right corner; here, a “flip” is defined in the same manner as in Figure 8, but because there are only two populated states each flip can be interpreted as a transition between the two states. Distributions of the two dihedral angles from the crystal and solution phases are given in the lower half of the figure. The “Lattice” simulation refers to the cryo-solvated lattice simulation; results from the water-solvated lattice simulation are similar but not shown.
Figure 10. The minor conformation of the biotin tail fills a similar volume as the major conformation.
While the alternate, minor conformation of the biotin tail involves simultaneous changes in two dihedral angles, it occupies much the same volume as the conformation observed in X-ray structures. Furthermore, the carboxylate group on the biotin tail sits in a similar orientation for both conformations of the tail, maintaining hydrogen bonds to Ser88 Oγ and Asn49 N. Eight conformations of the biotin are shown in licorice, superimposed against the white surface representing a streptavidin monomer. One of the biotins, highlighted in orange, exhibits the minor tail conformation. The streptavidin core backbone atoms were aligned to superimpose the various biotin conformations.
Table 1.
Hydrogen bonding between biotin and streptavidin in three simulations. To improve statistics and simplify the table, we did not consider the two monomers of the crystallographic asymmetric units separately; error estimates come from standard deviations for 16 monomers in each of the lattice simulations and four monomers in the solution phase simulation.
| Hydrogen Bond | Percent Occupancy | Percent Water Intercalation | |||||
|---|---|---|---|---|---|---|---|
| Donora | Acceptorb | Cryoc | Water d | Solution e | Cryo | Water | Solution |
| Biotin N1 | Asp128 Oδ1 / Oδ2 | 75 ± 30 | 84 ± 25 | 21 ± 24 | 3 ± 7 | 2 ± 10 | 48 ± 24 |
| Asn49 N | Biotin O11 / O12 | 67 ± 17 | 84 ± 4 | 73 ± 7 | NA | NA | NA |
| Ser88 OG | Biotin O11 / O12 | 65 ± 14 | 79 ± 6 | 65 ± 7 | NA | NA | NA |
The proton donor in the hydrogen bond
The proton acceptor in the hydrogen bond
The cryo-solvated lattice simulation
The water-solvated lattice simulation
The solution phase simulation
Figure 12. Maintenance of hydrogen bonds between the biotin carboxylate tail and two streptavidin residues for each conformation of the tail.
The proton acceptor in each of the above plots is one of the oxygens in the carboxylate tail; the donor is specified in the top right corner of each plot. Distributions of donor:acceptor distances when the tail is in its major and minor conformations are plotted as dotted and solid black lines, respectively. These plots refer to the second monomer of asymmetric units in the cryo-solvated lattice simulation, where the minor biotin tail conformation is most prevalent. The basic result, consistent across all simulations, is that the conformation of the tail does not significantly affect the maintenance of these hydrogen bonds; the apparent differences in hydrogen bonding to Ser88 are not statistically significant for this length of simulation due to limited sampling of the tail’s minor conformation.
There is no direct evidence in the 1MK5 crystal structure for an alternate conformation of the biotin tail, and other wild-type biotin-liganded streptavidin structures 1DF8, 1SWE, and 1SWD [32] show the same conformations for biotin as 1MK5. However, given the result shown in Figure 10, that both conformations of the tail occupy similar volumes of space, the alternate conformation may be present but undetected in the X-ray experiments.
The minor population of the biotin tail shown in Figure 9 has an occupancy of 10% and 20% in the first and second monomers of the ASU, respectively, which may not be detectable as a distinct state in the X-ray data. In our previous studies of the crystal simulations, we noted an asymmetry among the backbone fluctuations in the two monomers of the ASU, such that the loop bearing the Trp120 residue (which contacts the tail of biotin bound to an adjacent subunit) is larger in the second monomer than the first. However, the Trp120 of the second monomer contacts biotin bound to the first monomer in a symmetry-related ASU, so the larger backbone fluctuations in this region do not support the existence of any alternate conformations that may be more prevalent for biotin bound to the second monomer. As shown in Figure 9, the biotin tail assumes the minor conformation between 15 and 30 times per monomer, depending on the crystal or solution phase environment. Because the minor conformation is sampled frequently, there may be a statistically significant difference between its overall occupancy in the first and second monomers of the ASU in the cryo-solvated lattice simulation. However, the occupancy is small in any case: our simulations are not adequate to determine any specific crystal packing effects that may favor the minor biotin tail conformation in one monomer over the other. We will instead focus on whether the minor conformation is realistic or an artifact of the simulation model.
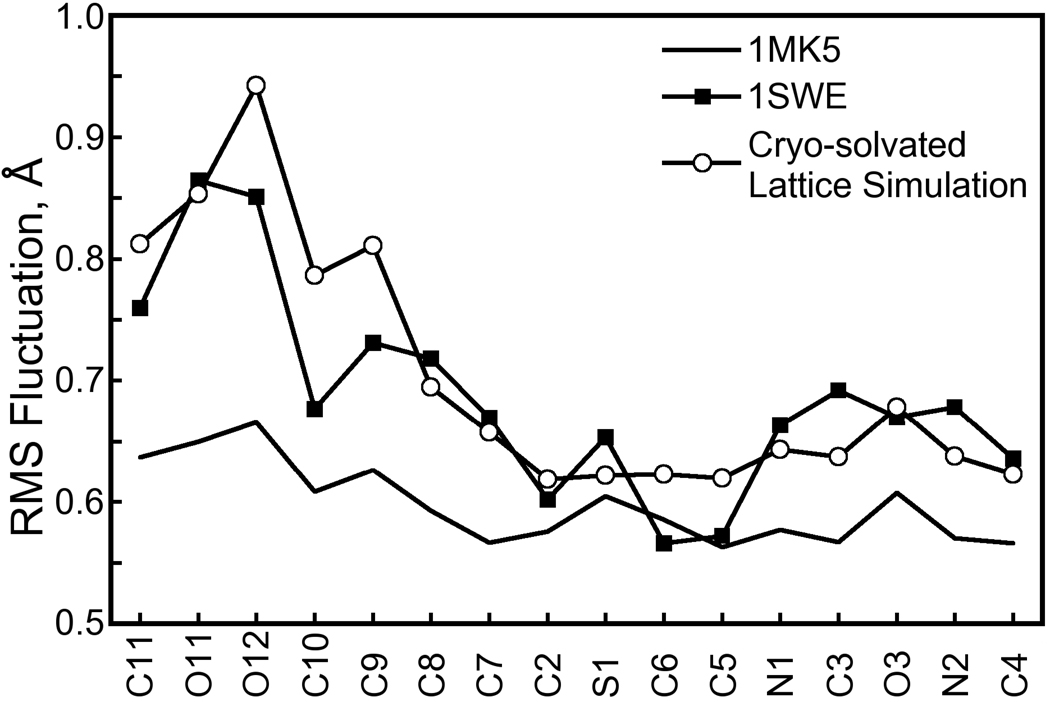
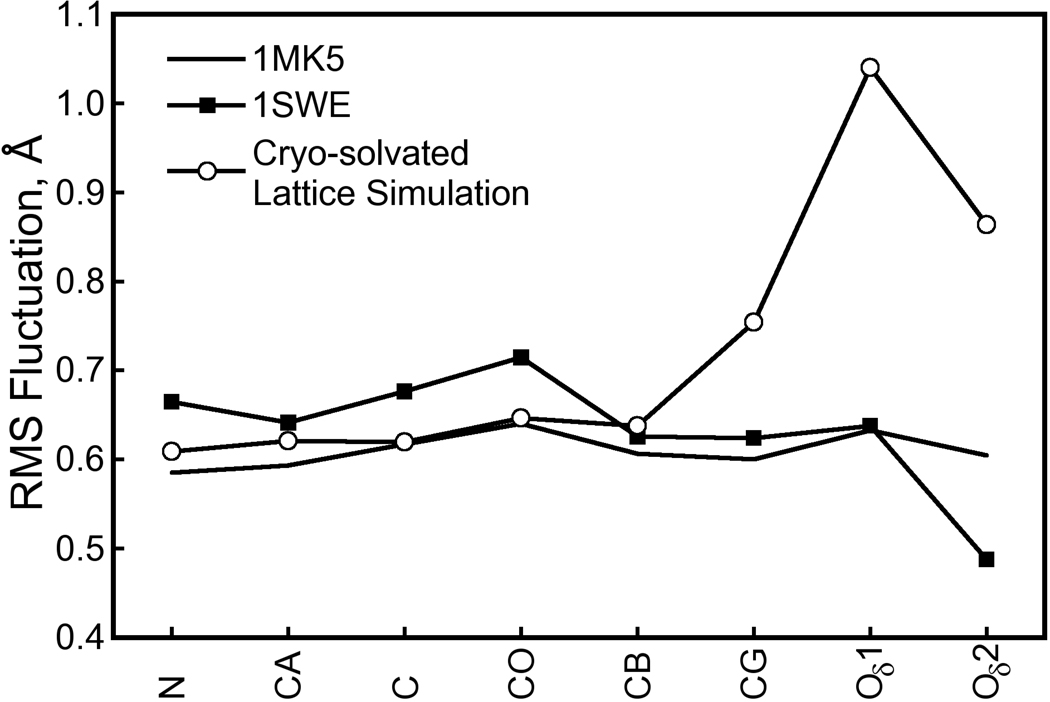
One possible explanation for the alternative biotin tail conformation is that cryogenic conditions favor the major population [33]. Although the 1MK5 crystal was flash-frozen before X-ray diffraction studies, the cryo-solvated lattice simulation was performed at 293K, the temperature at which the crystal was grown, due to our inability to simulate the flash-freezing process and cryogenic temperatures with the AMBER ff99 force field. X-ray diffraction studies were performed at room temperature for one crystal structure of wild-type biotin-liganded streptavidin, 1SWE [32]. This structure belongs to the P21 space group and its asymmetric unit is a streptavidin tetramer, but comparison of biotin isotropic B-factors between 1SWE and 1MK5 (I222 space group with a streptavidin dimer asymmetric unit) is reasonable because the biotin binding site is not perturbed by lattice contacts in either case. In the 1SWE structure, the rms fluctuations of atoms in the biotin tail are elevated; atomic rms fluctuations for biotin heavy atoms obtained from our cryo-solvated lattice simulation are higher than those of the 1MK5 crystal structure but match very well with those of the 1SWE crystal structure, as shown in Figure 11. The alternate biotin tail conformation may therefore be accessible at room temperatures.
Figure 11. Atomic RMS fluctuations for biotin heavy atoms in crystal structures and the cryo-solvated lattice simulation.
The alternate, minor conformation of the biotin tail presented in Figure 9 is not observable in the 1MK5 crystal structure, but cryogenic conditions may favor the major conformation. We therefore compared the RMS fluctuations of biotin heavy atoms to those observed in the 1MK5 and 1SWE crystal structures. (X-ray data for 1MK5 and 1SWE were collected at 100K and room temperature, respectively.) Because we are comparing to crystallographic data, RMS fluctuations were computed for the cryo-solvated lattice simulation by aligning the eight ASUs according to the symmetry operations of the I222 space group, not optimal quaternion alignments as were done for Figure 4. (We did, however, account for the fact that biotin atoms O11 and O12 are interchangeable.) An atom’s RMS fluctuation F is related to its isotropic B-factor B by . Each line shows the average RMS fluctuations for biotin in all distinct monomers of either crystal structure or the simulation. While our room-temperature simulation shows significantly more flexibility in the biotin tail than the 1MK5 crystal structure upon which it is based, the fluctuations are much more in line with those of the room-temperature crystal structure 1SWE. Therefore, the alternate tail conformation which contributes to the elevated RMS fluctuations in the room-temperature simulation fits well with room temperature crystallographic data.
While individual crystal structures may show slight differences between the conformations of surface side chains or the mobility of the biotin tail, all crystal structures of wild-type, biotin-liganded streptavidin give a convergent result in that at least six hydrogen bonds contribute to the high-affinity interaction. Of these hydrogen bonds, we observed the Ser27 Oγ: biotin O3 and the Tyr43 Oλ: biotin O3 bonds to remain stable throughout all the simulations, judging a hydrogen bond to be “broken” if its length exceeded 3.2Å or if the donor-hydrogen-acceptor angle was less than 120°. By this criterion, the Ser45 Oγ: biotin N2 hydrogen bond appears to be “broken” in the cryo-solvated lattice and solution phase simulations, but it is merely stretched to ∼ 3.3Å in these cases (data not shown). As mentioned before, hydrogen bonds between streptavidin Asn49 and Ser88 and the biotin carboxylate tail are maintained in both environments, but not as completely as the three bonds to the ureido head group.
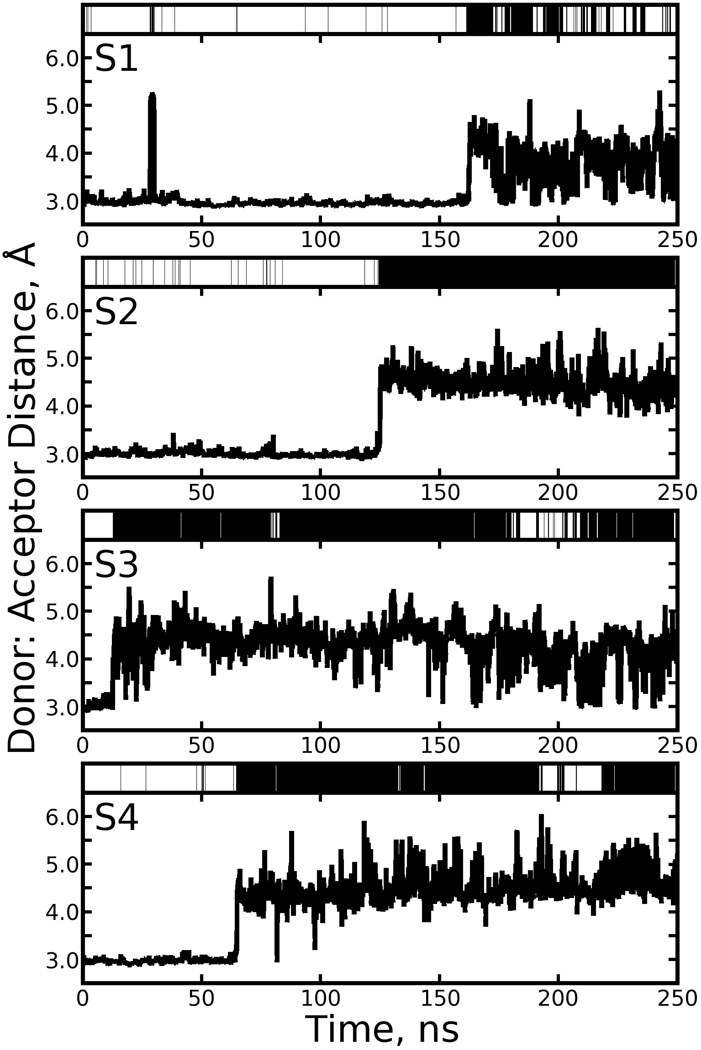
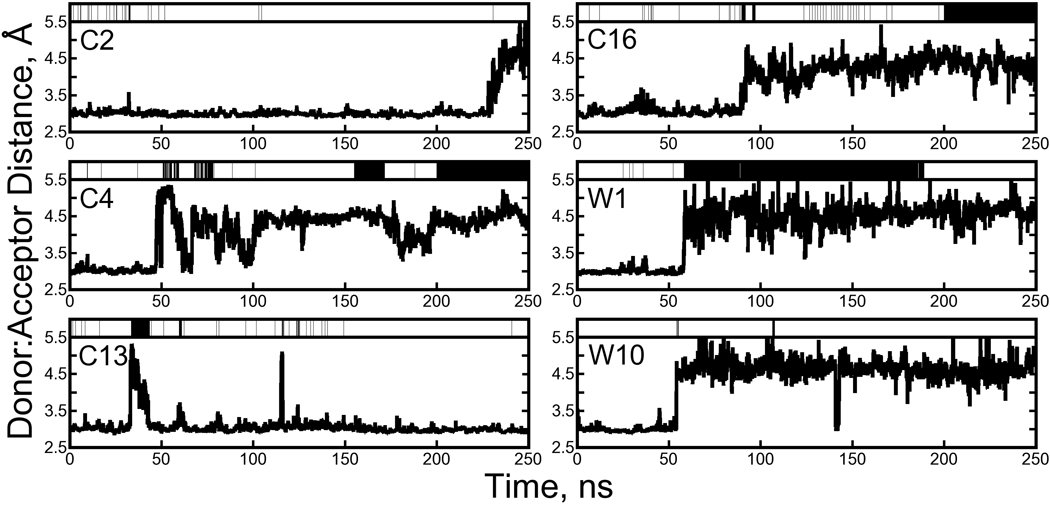
A previous study [11] with 15ns of equilibrium, solution-phase trajectory data on the streptavidin tetramer noted transient cleavage and reformation of the hydrogen bond between biotin N1 and one of the Asp128 Oδ atoms. At the same time, these earlier simulations showed water molecules entering the binding site from a nearby channel running along the tetrameric “weak” interface. We also observed high concentrations of water to reside in this channel in our crystal simulations [6]. Intercalation of a water molecule was detected by the formation of a hydrogen bond, according to the same criteria, between the biotin N1 atom and any solvent water molecule. In our 250ns solution-phase simulation, the broken hydrogen bond state was dominant, as shown in Table 1. Figure 13 displays the state of the Asp128 Oδ: biotin N1 hydrogen bond in each of the four subunits over the course of the simulation; cleavage of the hydrogen bond is strongly correlated with water intercalation.
Figure 13. Breaking of the Asp128:Biotin hydrogen bond observed in the solution-phase simulation, correlated with water intercalation.
The distance between the Biotin N1 and the nearest Oδ atom of Asp128 is shown for each streptavidin monomer (S1, S2, S3, and S4, as labeled in the top left corner of each panel). If a water molecule intercalates the hydrogen bond, the bar over the top of the plot is colored black; otherwise it is white.
No intercalating water molecule is observed in the 1MK5 crystal structure, or any other crystal structure of biotin-liganded wild-type streptavidin. However, our lattice simulations provide some reconciliation between the solution phase simulation results and experimental observations. As shown in Figure 14, the Asp128 Oδ: Biotin N1 hydrogen bond did break in 4 of the 16 streptavidin monomers in the cryo-solvated lattice, but on average (as shown in Table 1) the occupancy of the broken state was much lower, and the occupancy of an intercalated water molecule was very small (no other solvent components were observed to accept the biotin N1 proton). The water-solvated crystal lattice showed similar results.
Figure 14. Breaking of the Asp128:Biotin hydrogen bond observed in lattice simulations, correlated with water intercalation.
The format follows Figure 13, but only streptavidin monomers showing cleavage of the hydrogen bond are displayed. In the top left corner of each panel, C denotes the cryo-solvated lattice and W the water-solvated lattice. Monomers 1 and 2, 3 and 4, …, 15 and 16 make up asymmetric units 1, 2, …, 8.
Although both lattice simulations showed low levels of hydrogen bond breaking and water intercalation, it must be noted that in several cases the hydrogen bond remained broken at the end of the simulations and that, while the hydrogen bond broke and reformed transiently in one monomer of the cryo-solvated lattice, in other cases the broken state could persist on a timescale as long as our simulations. Further sampling may increase the predicted occupancy of the broken hydrogen bond state. Numerous water intercalation events were observed in the lattice simulations, some of only a few ns but others persisting for tens of ns. However, cleavage of the hydrogen bond was not a strong indicator of water intercalation as it was in the solution-phase simulation. This suggests that the crystal packing effects which are needed to maintain the backbone conformation observed in the 1MK5 structure also reduce the probability of water intercalation into the Asp128 Oδ: biotin N1 hydrogen bond, though their effect on the stability of the hydrogen bond itself is not certain.
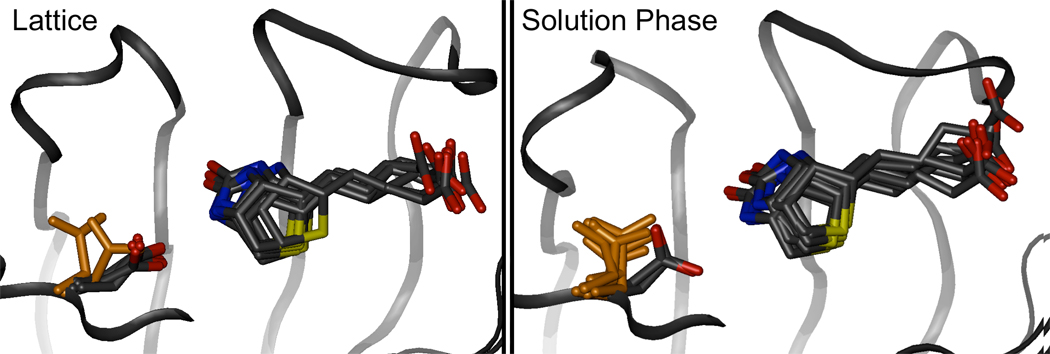
While the lattice simulations do offer agreement with experiment in that the observed levels of water intercalation would not be detected in X-ray diffraction studies, the higher occupancy of the broken hydrogen bond state does not agree with the 1MK5 X-ray diffraction data. Figure 15 shows several examples of the broken hydrogen bond state from the cryo-solvated lattice and from the solution-phase simulation. The mechanism for hydrogen bond cleavage is similar in both simulations, but in the 1MK5 diffraction data no electron density could be found to support such movement of the Asp128 side chain. Even in room-temperature 1SWE structure, the atomic fluctuations of the Asp128 side chain tend to be lower, on average, than the Asp128 backbone fluctuations, indicating that the side chain is tightly coupled to the biotin ureido head group (see Figure 16).
Figure 15. Motion of Asp128 as it breaks its hydrogen bond to biotin in the cryo-solvated lattice and solution phase simulations.
Eight conformations of the biotin binding site are superimposed on one another (positions of β-barrel core backbone atoms were used for alignment) in each frame. A backbone trace of the streptavidin protein is shown as a black ribbon, while the biotin ligand and Asp128 side chain are shown in licorice. If the the hydrogen bond between Asp128 Oδ and biotin N1 is broken, the Asp128 side chain is highlighted in orange. The motion of Asp128 during hydrogen bond cleavage is similar in both simulations.
Figure 16. Atomic RMS fluctuations for Asp128 heavy atoms in crystal structures and the cryo-solvated lattice simulation.
Fluctuations were computed for heavy atoms of the streptavidin Asp128 residue as described in Figure 11. The Asp128 residue is not in any of the streptavidin flexible loop regions and has low mobility at both cryogenic and room temperatures. However, in our cryo-solvated lattice simulation, we observe the Asp128 carboxylate group to move away from the biotin N1 atom, breaking the hydrogen bond between these groups and possibly allowing the intercalation of a water molecule (see Figure 14). Whereas our (room temperature) simulation is in good agreement with X-ray data collected at either temperature in terms of the Asp128 backbone fluctuations, the motion of the Asp128 side chain raises the observed atomic fluctuations well above those in either X-ray structure. This result, and others noted in the text, may indicate the need for a more sophisticated hydrogen bonding potential in molecular simulations.
Using three simulations, we have identified a possible diversity of conformations in biotin bound to streptavidin, as well as differences between biotin ligation in the streptavidin crystal lattice and in the solution phase that support previous studies’ [11] [34] proposed mechanism of disassociation in the streptavidin:biotin complex. However, our simulations are not of adequate length to sample some of these processes, so it is possible that the lattice simulations may produce results more like the solution phase simulations if the trajectories are lengthened. Each of the 250ns simulations in this study are more than an order of magnitude longer than the aggregate trajectory data used in the previous studies, but overall our conclusions are less certain. We have introduced much more stringent comparisons of the simulation model with experimental data, and the longer trajectories have allowed us to detect a rare event, cleavage of the Asp128 Oδ: Biotin N1 hydrogen bond, in the lattice simulations. Even our 250ns simulations are inadequate to determine the overall impact of this event on the structure of the biotin binding site. Together, the three simulations in this study have permitted a detailed analysis of biotin ligation that would not have been possible with solution phase simulations alone. The results demonstrate the challenges that must be overcome and offer examples of the benefits that can be gained by direct comparison of lengthy simulation trajectories with experimental data.
4 Discussion
4.1 How can simulations enhance crystallographic structure data regarding streptavidin-biotin and other protein-ligand interactions?
Simulations present a powerful complement to static structures of proteins and other biomolecules. Convergence of results from simulation with strong aspects of experimental data provides a foundation for using simulations to enhance experimental observations and study features of biomolecules that cannot be seen directly in experiments. Molecular simulations also offer exquisite control over the system of interest and low marginal costs for extending a trajectory or attempting new variations on a theme. We have therefore chosen to study the streptavidin:biotin complex through a series of simulations, ranging from the best available recreation of its crystal unit cell to a more common model of the complex in solution, to permit more detailed comparisons of the solution phase simulation with X-ray diffraction studies. Results from the cryo-solvated lattice simulation showed strong agreement with X-ray data in terms of descriptors such as backbone RMSD, isotropic fluctuations, and the overall structure of solvent molecules around proteins in the lattice. Analysis of side chain χ1 distributions and atomic fluctuations of the biotin ligand itself suggest that the simulations can also reproduce more detailed aspects of the experimental data. We also identified results from all three simulations that could not be directly confirmed or refuted by the available X-ray data, and one aspect of the simulations which was inconsistent with X-ray data. We believe that joint computational and structural studies in this style will advance the theoretical understanding of biomolecular function as well as the capabilities of structural biologists to interpret their results.
In our simulations, we consistently saw that the loop regions of streptavidin, essentially any residues not part of the β-barrel core, become more flexible in solution. Only one exception to this rule is evident in Figure 4: the biotin binding loop (residues 46 to 51). In crystallographic data, the backbone of this loop has low B-factors when biotin is bound (see, for example Figure 5 of our previous lattice simulation study [6]). The biotin binding loop is also distinguished in experiments: in the absence of biotin, the loop changes conformation from the “closed” state that clasps the ligand to an “open” state so mobile that it is often not observable in the electron density [32]. Overall, the agreement between atomic fluctuations obtained from our lattice simulations and those in the crystal structure was quite good; the most significant flaw we could identify was that certain loop regions showed too much mobility. The fact that the biotin binding loop exhibited low fluctuations in all of our simulations therefore suggests that this loop remains in its closed conformation whenever biotin is bound.
The biotin binding loop has been identified before [35] as a major factor in the affinity of streptavidin for biotin; deletion of the loop via circular mutation decreased the binding affinity by approximately 10 kcal/mol. It is therefore worthwhile to consider how less drastic mutations in this loop may affect the binding affinity. Computational studies of unliganded streptavidin (currently in progress) may be able to confirm an increase in loop flexibility in the absence of biotin. The transition state between the open and closed forms is another possible area of study, if mutations in this region can be found that influence binding kinetics.
Some of the fine details of interaction between biotin and streptavidin appear difficult to evaluate with either simulations or X-ray crystallography. The observation of an alternate conformation for the biotin tail in our simulations appears to be consistent with X-ray crystallographic B-factors (atomic fluctuations) collected at room temperature. However, the minor conformation of the tail has low enough occupancy (10 to 20%) that it would be difficult to refute its existence with any X-ray data; other studies [36] have invoked simulations specifically for the purpose of finding alternate ligand binding modes with such low occupancies that X-ray crystallography cannot detect them. The biotin tail is held in place by tryptophan residues Trp79 and Trp120 [37]; X-ray structures of mutant streptavidins Trp79→Phe and Trp120→Ala are available, and show the biotin tail in the same position as the wildtype structure. Simulations involving these mutant streptavidins could provide additional tests on the behavior of the biotin tail in simulations.
Numerous computational studies have focused on hydrogen bonding interactions in protein:ligand complexes [38] [39] because these interactions are highly relevant to chemistry in solution, simple to identify, and appear to be computationally tractable in terms of sampling. As shown in Figure 13, our 250ns solution phase simulation reveals that the occupancy of certain hydrogen bonds can be very difficult to measure due to rare events that may break or reform the bonds. Had the solution phase trajectory been only 50ns long, it might have been concluded that the Asp128 Oδ: Biotin N1 hydrogen bond was stable overall, with transient breaks of indeterminate length. Given the 250ns trajectory, however, the broken state is clearly dominant in solution. Similarly, extension of the lattice simulations may eventually find that the broken state of the hydrogen bond is preferred in the model crystal lattice as well.
Regardless of the accuracy of details of the simulation model, however, the notion that water molecules travel through a channel in the streptavidin tetramer’s dimer:dimer interface to fill the binding site “from the rear” as biotin dissociates is compelling because it accomplishes the hydration of the biotin binding site efficiently by drawing on the large amount of water already in the dimer:dimer interface that is observed crystallographically and maintained in our lattice simulations [6]. Furthermore, crystal structures of an Asp128→Ala streptavidin mutant show a water molecule filling the void where the Asp128 carboxylate group would otherwise fit [11]; the water apparently forms a hydrogen bond to biotin N1 much as we observe in these simulations. The present study suggests that intercalation of water into the Asp128 Oδ(1,2): biotin N1 hydrogen bond may not occur frequently and transiently under equilibrium conditions as previously thought. However, it may still be possible to use the current molecular model to investigate the flow of water through the dimer:dimer interface if mutations are introduced to block the channel.
It is appropriate to note that the AMBER ff99SB force field used in our simulations has no explicit treatment of hydrogen bonding effects; instead, it relies on the sum of coulomb interactions between point charges and Lennard-Jones interactions between the donor and acceptor atoms to approximate the potential energy surface. This simplification may be the root of the stretching we observed in the Ser45 Oγ: biotin N2 hydrogen bond—the sum of coulomb and Lennard Jones potentials permits flexibility in the relative positions of these atoms, whereas the true hydrogen bonding potential would constrain the donor:acceptor distance and orientation more tightly. Recent quantum chemical studies [40] [41] also corroborate site-directed mutagenesis studies [10] that there exists cooperativity in the formation of hydrogen bonds between biotin, Asp128, and Ser45, which the simplified molecular mechanics model would not capture. A cooperative hydrogen bonding model would be very difficult to parameterize, but a hydrogen bonding model such as that proposed by Kortemme and colleagues [42] may be useful for molecular simulations if the tabulated potentials can be smoothly intepolated. Such an approach would yield a model that is pairwise between groups of atoms, rather than simply a consequence of pairwise interactions between individual atoms, and incur minimal additional expense (particularly in parallel simulations) because the more expensive trigonometric computations would only involve atoms in very close proximity.
As we examined increasingly detailed aspects of biotin ligation, we simultaneously began to encounter limitations in the resolution of the X-ray data, inexact comparisons between the conditions used to collect the X-ray data and the conditions used to run the simulations, and limitations in the molecular force field. Progress on these fronts is intertwined for several reasons. First, crystallographic data refinement relies to a small degree on molecular force fields. Second, X-ray crystallographic studies typically benefit from use of cryogenic temperatures, which current molecular force fields are not able to simulate. Room-temperature crystallography offers an alternative, but typically at a slight cost in the resolution of the data, which shifts the burden of determining minute structural features further towards the molecular force field. Third, because biomolecular surfaces prefer to contact some species of solvent molecules over others (see our explanation and references in the original lattice simulations study [6]), it is very difficult to determine the exact chemical composition of a crystal lattice unit cell, except in rare cases where the crystallization medium is nearly pure water [43]. NMR studies present an alternative for collecting structural data at room temperature without the complications of extensive contacts between biomolecular surfaces and the perturbations they cause in the local solvent environment, but because NMR spectra cannot place as many constraints on the positions of atoms as electron density maps derived by X-ray diffraction, NMR studies are even more dependent on molecular force fields to interpret the results. The molecular force fields themselves can be improved by examining the thermodynamic properties of the pure states of small molecules [1] [2], but their ultimate transferability to biomolecular applications can only be guaranteed by reproduction of detailed structural results. It is therefore important to pursue biomolecular simulations with the closest possible approximations to experimental conditions as a bridge between the theoretical and experimental sides of structural biology.
4.2 Additional simulations: finer steps between theory and experiment
In this study we performed simulations of the biotin:streptavidin complex in its crystal environment and in aqueous solution (the “cryo-solvated lattice” and “solution phase” simulations). A third simulation of the crystal lattice with pure water filling the void volume between lattice proteins (the “water-solvated lattice” simulation) was also presented as a theoretical case midway between the two cases of greatest interest.
In Figure 6 and Figure 7, there are noticeable differences between the rotamers populated by Tyr22, Tyr83, Glu101, Arg103, and Glu116 in the cryo-solvated lattice and solution phase simulations. In the water-solvated lattice simulation, the χ1 distributions of these side chains appear to take on some of the features of the solution-phase distributions. As was noted in the Results, the overall abundance of each χ1 angle is not certain for some of these residues due to limited sampling, and it is not possible from these data to say whether changes in side chain conformations caused slight shifts in the lattice proteins that led to higher backbone RMSDs for the water-solvated lattice simulation than the cryo-solvated lattice simulation [6] or if shifts in the lattice proteins led to the changes in side chain conformations. However, with multiple independent streptavidin monomers in each simulation, residues such as Glu101, Arg103, and Glu116 could sample each of their χ1 rotamers between 50 and 100 times. The fact that the χ1 distributions in the water-solvated lattice often fell between distributions for the cryo-solvated lattice and the solution-phase simulation, or closer to distributions from the solution phase simulation, is also striking. Theoretical explanations for protein crystallization [44] [45] commonly cite solvent effects on the conformations of protein surface side chains; there are many questions to answer if such effects can be detected in simulations.
Another way to approach the problem of surface side chain mobility in different environments, particularly crystallization conditions and aqueous solution, is to design a simulation with a single copy of the protein solvated in a much larger amount of solvent approximating the crystallization conditions. Whereas the water-solvated lattice would be unlikely to exist in reality, a simulation of a streptavidin tetramer solvated by a large amount of the crystallization solution would reflect the conditions present during growth of the crystal. Unfortunately, we encountered some difficulties modeling ammonium sulfate in our previous study (specifically, the salt aggregated in simulations after a few ns, at concentrations well below the real saturation point). We are unable to pursue this type of simulation with the parameters used in this study, but we are aware of new parameters for ammonium sulfate derived from Kirkwood-Buff theory [46], compatible with our preferred SPC/E water model, that may make such a simulation possible.
If more than one set of crystallization conditions can be realistically simulated, simulations of biomolecules in both sets of crystallization conditions could be used to address other questions of why proteins crystallize. The streptavidin tetramer typically crystallizes in one of two space groups: P21 and I222. An ammonium sulfate precipitant appears to lead to crystals in the I222 space group, whereas crystals grown in solutions of polyols such as glycerol or MPD tend to belong to the P21 space group. Simulating crystal lattices with each set of conditions, then swapping the conditions and running additional simulations, may reveal information about the physics of protein crystallization.
Molecular simulations offer two powerful capabilities to structural biology. The first, to track the biomolecules in atomic detail, is well known. The second, to simulate biomolecules in a variety of carefully controlled conditions, is much less utilized. As simulations make closer reproductions of detailed structural data, it will become possible to design theoretical environments in silico to further enhance our understanding of molecular biophysics.
Supplementary Material
5 Acknowledgement
This research was supported by National Institutes of Health grant GM080214.
Footnotes
Supporting Information Available: maps of the streptavidin dimer and tetramer, a color coded chart of loop regions discussed in the text, and a map of the biotin ligand itself are provided. This information is available free of charge via the Internet at http://pubs.acs.org.
References
- 1.Wu Y, Tepper HL, Voth GA. Flexible simple point-charge water model with improved liquid-state properties. J. Chem. Phys. 2006;124:024503. doi: 10.1063/1.2136877. [Online] [DOI] [PubMed] [Google Scholar]
- 2.Chelli R, Procacci P, Cardini G, Cella Valle RG, Califano S. Glycerol condensed phases Part I. A molecular dynamics study. Phys. Chem. Chem. Phys. 1999;1:871–877. [Online] [Google Scholar]
- 3.Greenfield NJ. Using circular dichroism spectra to estimate protein secondary structure. Nat. Protoc. 2006;1:2876–2890. doi: 10.1038/nprot.2006.202. [Online] [DOI] [PMC free article] [PubMed] [Google Scholar]
- 4.Ma B, Lii J-H, Schaefer HF, III, Allinger NL. Systematic Comparison of Experimental, Quantum Mechanical, and Molecular Mechanical Bond Lengths for Organic Molecules. J. Phys. Chem. 1996;100:8763–8769. [Online] [Google Scholar]
- 5.Eastman P, Pelligrini M, Doniach S. Protein flexibility in solution and in crystals. J. Chem. Phys. 1999;110:10141–10152. [Online] [Google Scholar]
- 6.Cerutti DS, Le Trong I, Stenkamp RE, Lybrand TP. Simulations of a protein crystal: Explicit treatment of crystallization conditions links theory and experiment in the streptavidin-biotin complex. Biochemistry. 2008;47:12065–12077. doi: 10.1021/bi800894u. [Online] [DOI] [PMC free article] [PubMed] [Google Scholar]
- 7.Amaro RE, Minh DDL, Cheng LS, Lindstrom WM, Olson AJ, Lin JH, Li WW, McCammon JA. Remarkable loop flexibility in avian influenza N1 and its implications for antiviral drug design. J. Am. Chem. Soc. 2007;129:7764–7765. doi: 10.1021/ja0723535. [Online] [DOI] [PubMed] [Google Scholar]
- 8.Schames JR, Henchamn RH, Siegel JS, Sotriffer CA, Ni HH, McCammon JA. Discovery of a novel binding trench in HIV integrase. J. Med. Chem. 2004;47:1879–1881. doi: 10.1021/jm0341913. [Online] [DOI] [PubMed] [Google Scholar]
- 9.Garcin ED, Bruns CM, Lloyd SJ, Hosfield DJ, Tiso M, Gachhui R, Stuehr DJ, Tainer JA, Getzoff ED. Structural basis for isozyme-specific regulation of electron transfer in nitric oxide synthase. J. Biol. Chem. 2004;279:37918–37927. doi: 10.1074/jbc.M406204200. [Online] [DOI] [PubMed] [Google Scholar]
- 10.Hyre DE, Le Trong I, Merritt EA, Green NM, Stenkamp RE, Stayton PS. Wildtype core-streptavidin with biotin at 1.4Å. Protein Sci. 2006;15:459–467. doi: 10.1110/ps.051970306. [Online] [DOI] [PMC free article] [PubMed] [Google Scholar]
- 11.Freitag S, Chu V, Penzotti JE, Klumb LA, To R, Hyre D, Le Trong I, Lybrand TP, Stenkamp RE, Stayton PS. A structural snapshot of an intermediate on the streptavidin-biotin dissociation pathway. P. Natl. Acad. Sci. USA. 1999;96:8384–8389. doi: 10.1073/pnas.96.15.8384. [Online] [DOI] [PMC free article] [PubMed] [Google Scholar]
- 12.Cornell WD, Cieplak P, Bayly CI, Gould IR, Merz KM, Jr, Ferguson DM, Spellmeyer DC, Fox T, Caldwell JW, Kollman PA. A second-generation force field for the simulations of proteins, nucleic acids, and organic molecules. J. Am. Chem. Soc. 1995;117:5179–5197. [Online] [Google Scholar]
- 13.Wang J, Cieplak P, Kollman PA. How well does a restrained electrostatic potential (RESP) model perform in calculating conformational energies of organic and biological molecules? J. Comput. Chem. 2000;21:1049–1074. [Online] [Google Scholar]
- 14.Hornak V, Abel R, Okur A, Strockbine B, Roitberg A, Simmerling C. Comparison of multiple Amber force fields and development of improved protein backbone parameters. Proteins. 2006;65:712–725. doi: 10.1002/prot.21123. [Online] [DOI] [PMC free article] [PubMed] [Google Scholar]
- 15.Berendsen HJC, Grigera JR, Straatsma TP. The missing term in effective pair potentials. J. Phys. Chem. 1987;91:6269–6271. [Online] [Google Scholar]
- 16.Åqvist J. Ion-water interaction potentials derived from free energy perturbation simulations. J. Chem. Phys. 1990;94:8021–8024. [Online] [Google Scholar]
- 17.Israilev S, Stepaniants S, Balsera M, Oono Y, Schulten K. Molecular dynamics study of the unbinding of the avidin-biotin complex. Biophys. J. 1997;72:1568–1581. doi: 10.1016/S0006-3495(97)78804-0. [Online] [DOI] [PMC free article] [PubMed] [Google Scholar]
- 18.Essmann U, Perera L, Berkowitz ML, Darden T, Lee H, Pedersen LH. A smooth particle mesh Ewald method. J. Chem. Phys. 1995;103:8577–8593. [Online] [Google Scholar]
- 19.Ryckaert JP, Ciccotti G, Berendsen HJC, Hirasawa K. Numerical integration of the cartesian equations of motion of a system with constraints: Molecular dynamics of n-alkanes. J. Comput. Phys. 1997;23:327–341. [Online] [Google Scholar]
- 20.Miyamoto S, Kollman PA. SETTLE: An analytical version of the SHAKE and RATTLE algorithm for rigid water models. J. Comput. Chem. 1992;13:952–962. [Online] [Google Scholar]
- 21.Izaguirre JA, Catarello DP, Wozniak JM, Skeel RD. Langevin stabilization of molecular dynamics. J. Chem. Phys. 2001;114:2090–2098. [Online] [Google Scholar]
- 22.Case DA, Cheatham TE, Darden TA, Gohlke H, Luor R, Merz M, Onufriev A, Simmerling C, Wang B, Woods R. The AMBER biomolecular simulation programs. J. Comput. Chem. 2005;26:1668–1688. doi: 10.1002/jcc.20290. [Online] [DOI] [PMC free article] [PubMed] [Google Scholar]
- 23.Cerutti DS, Duke RE, Freddolino PL, Fan H, Lybrand TP. A vulnerability in several popular molecular dynamics packages concerning Langevin and Andersen dynamics. J. Chem. Theory Comput. 2008;4:1669–1680. doi: 10.1021/ct8002173. [Online] [DOI] [PMC free article] [PubMed] [Google Scholar]
- 24.Tai K, Shen T, B¨orjesson U, Philippopoulos M, McCammon JA. Analysis of a 10-ns molecular dynamics simulation of mouse acetylcholinesterase. Biophysical Journal. 2001;81:715–724. doi: 10.1016/S0006-3495(01)75736-0. [Online] [DOI] [PMC free article] [PubMed] [Google Scholar]
- 25.Hyre DE, Le Trong I, Freitag S, Stenkamp RE, Stayton PS. Ser45 plays an important role in managing both the equilibrium and transition state energetics of the streptavidin-biotin system. Protein Sci. 2000;9:878–885. doi: 10.1110/ps.9.5.878. [Online] [DOI] [PMC free article] [PubMed] [Google Scholar]
- 26.Le Trong I, Aubert DG, Thomas NR, Stenkamp RE. The high-resolution structure of (+)-epi-biotin bound to streptavidin. Acta. Crystallogr. D. 2006;62:576–581. doi: 10.1107/S0907444906011887. [Online] [DOI] [PubMed] [Google Scholar]
- 27.Pazy Y, Kulik T, Bayer EA, Wilchek M, Livnah O. Ligand exchange between proteins: exchange of biotin and biotin derivatives between avidin and streptavidin. J. Biol. Chem. 2002;277:30892–30900. doi: 10.1074/jbc.M202874200. [Online] [DOI] [PubMed] [Google Scholar]
- 28.Weber PC, Pantoliano MW, Simons DM, Salemme FR. Structure-based design of synthetic azobenzene ligands for streptavidin. J. Am. Chem. Soc. 1994;116:2717–2724. [Online] [Google Scholar]
- 29.Weber PC, Pantoliano MW, Thompson LD. Crystal structure and ligand-binding studies of a screened peptide complexed with streptavidin. Biochemistry. 1992;31:9350–9354. doi: 10.1021/bi00154a004. [Online] [DOI] [PubMed] [Google Scholar]
- 30.Katz BA. Binding to protein targets of peptidic leads discovered by phage display: Crystal structures of streptavidin-bound linear and cyclic peptide ligands containing the HPQ sequence. Biochemistry. 1995;34:15421–15429. doi: 10.1021/bi00047a005. [Online] [DOI] [PubMed] [Google Scholar]
- 31.Kumar S, Bouzida D, Swendsen RH, Kollman PA, Rosenberg JM. The Weighted Histogram Analysis Method for free-energy calculations on biomolecules. I. The method. J. Comput. Chem. 1992;13:1011–1021. [Online] [Google Scholar]
- 32.Freitag S, Le Trong I, Klumb L, Stayton PS, Stenkamp RE. Structural studies of the streptavidin binding loop. Protein Sci. 1997;6:1157–1166. doi: 10.1002/pro.5560060604. [Online] [DOI] [PMC free article] [PubMed] [Google Scholar]
- 33.Halle B. Biomolecular cryocyrstallography: Structural changes during flash cooling. Proc. Natl. Acad. Sci. U.S.A. 2004;101:4793–4798. doi: 10.1073/pnas.0308315101. [Online] [DOI] [PMC free article] [PubMed] [Google Scholar]
- 34.Hyre DE, Amon LM, Penzotti JE, Le Trong I, Stenkamp RE, Lybrand TP, Stayton PS. Early mechanistic events in biotin dissociation from streptavidin. Nat. Struct. Biol. 2002;9:582–585. doi: 10.1038/nsb825. [Online] [DOI] [PubMed] [Google Scholar]
- 35.Chu V, Freitag S, Le Trong I, Stenkamp RE, Stayton PS. Thermodynamic and structural consequences of flexible loop deletion by circular permutation in the streptavidin-biotin system. Protein Sci. 1998;7:848–859. doi: 10.1002/pro.5560070403. [Online] [DOI] [PMC free article] [PubMed] [Google Scholar]
- 36.Blanchet J, Lin S-X, Zhorov BS. Mapping of steroids binding to 17β-hydroxysteroid dehydrogenase type 1 using Monte Carlo energy minimization reveals alternative binding modes. Biochemistry. 2005;44:7218–7227. doi: 10.1021/bi047553x. [Online] [DOI] [PubMed] [Google Scholar]
- 37.Freitag S, Le Trong I, Chilkoti A, Klumb LA, Stayton PS, Stenkamp RE. Structural studies of binding site tryptophan mutants in the high-affinity streptavidin-biotin complex. J. Mol. Biol. 1998;279:211–221. doi: 10.1006/jmbi.1998.1735. [Online] [DOI] [PubMed] [Google Scholar]
- 38.Mirshahi T, Logothetis DE, Rosenhouse-Dantsker A. Hydrogen-bonding dynamics between adjacent blades in G-protein β-subunit regulates GIRK channel activation. Biophys. J. 2006;90:2776–2785. doi: 10.1529/biophysj.105.069302. [Online] [DOI] [PMC free article] [PubMed] [Google Scholar]
- 39.Guàrdia E, Marti J, Garcá-Tarrès L, Laria D. A molecular dynamics simulation study of hydrogen bonding in aqueous ionic solutions. J. Mol. Liq. 2005;117:63–67. [Online] [Google Scholar]
- 40.DeChancie J, Houk KN. The origins of femtomolar protein-ligand binding: Hydrogen-bond cooperativity and desolvation energetics in the biotin-(strept)avidin binding site. J. Am. Chem. Soc. 2007;129:5419–5429. doi: 10.1021/ja066950n. [Online] [DOI] [PMC free article] [PubMed] [Google Scholar]
- 41.Lei Y, Li H, Zhang R, Han S. Theoretical study of cooperativity in biotin. J. Phys. Chem. B. 2007;111:14370–14377. doi: 10.1021/jp076914q. [Online] [DOI] [PubMed] [Google Scholar]
- 42.Kortemme T, Morozov AV, Baker D. An orientation-dependent hydrogen bonding potential improves prediction of specificity and structure for proteins and protein-protein complexes. J. Mol. Biol. 2003;326:1239–1259. doi: 10.1016/s0022-2836(03)00021-4. [Online] [DOI] [PubMed] [Google Scholar]
- 43.Smith GD, Blessing RH, Ealick SE, Fontecilla-Camps JC, Hauptman HA, Housset D, Langs DA, Miller R. Ab initio structure determination and refinement of a scorpion protein toxin. Acta Crystallogr. D. 1997;53:551–557. doi: 10.1107/S0907444997005386. [Online] [DOI] [PubMed] [Google Scholar]
- 44.Sousa R. Use of glycerol, polyols and other protein structure stabilizing agents in protein crystallization. Acta Crystallogr. D. 1995;51:271–277. doi: 10.1107/S0907444994014009. [Online] [DOI] [PubMed] [Google Scholar]
- 45.Derewenda ZS, Vekilov PG. Entropy and surface engineering in protein crystallization. Acta Crystallogr. D. 2006;62:116–124. doi: 10.1107/S0907444905035237. [Online] [DOI] [PubMed] [Google Scholar]
- 46.Weerasinghe S, Smith PE. A Kirkwood-Buff derived force field for mixtures of urea and water. J. Phys. Chem. B. 2003;107:3891–3898. [Online] [Google Scholar]
Associated Data
This section collects any data citations, data availability statements, or supplementary materials included in this article.


