

Urea has long been used to probe the stability and folding kinetics of proteins.1 In contrast only recently it was shown that the RNA molecules that have a high propensity to misfold can be resolved using moderate amounts of urea.2 Urea titrations can also be used to probe the interactions that stabilize the folded states of RNA.2c Although the mechanism by which urea denatures proteins is now fairly well understood3 the nature of interactions by which urea destabilizes RNA is not known. In order to provide a microscopic basis for the action of urea on RNA we have carried out extensive all atom molecular dynamics (MD) simulations on two RNA constructs using two urea force fields. Destabilization of RNA is due to disruption of base-pair interactions by direct hydrogen bonding of urea with the bases. The simulations also reveal a novel mechanism in which urea molecules engage in stacking interactions with the purine bases.4
Analyses of 20 ns trajectories generated using MD simulations with a urea force field that was created as a part of the present work (see SI for simulation details, SI Figs. 1 and 2 and Tables 1–3 for urea parameter development, and for assessing the validity of the force field) of the 22-nucleotide RNA hairpin P5GA5 (Fig. 1A) in various urea concentrations ([C]s) reveal that at high [C] the solvent-exposed stem regions lead to disruption of base pairing. The fraction of intact hydrogen bonds associated with the bases in the stem decreases from about 0.71 in the absence of urea to 0.46 in 8M urea. The loss of the Watson-Crick (WC) hydrogen bonds is accompanied by opening of the base pairs, which is reflected in the distribution of the hydrogen bond donor-acceptor distances (RHB) in the hairpin stem (Fig. 1B). The base-paired state is indicated by a sharp peak at RHB = 3Å, whose height decreases as [C] increases to 6M. The probability of sampling RHB distances that are greater than 10Å (Fig. 1B) increases greatly in high [C], which results in a rotation of the bases of the helix leading to N1–N3 distances of about 16Å.6 Examination of opening at the individual base pair level reveals considerable heterogeneity7 with the largest fluctuations occurring at the GA and GU mismatches. We also show that urea-induced disruption of the base opening due to the loss of WC hydrogen bonds is nonspecific in the sense that urea does not preferentially interact with a specific base pair. These finding suggests that denaturation of RNA is due to favorable non-specific interactions with amide-like surfaces of the nucleic acids. The average base-base interaction energies (GC, AU, AG, and GU) decrease substantially at high [C] (SI Table 4). When averaged over all base pair interactions in the stem the interactions become less favorable by about 2.7 kcal/mol at 6M relative to [C] = 0 (SI Table 4). The average interaction energies for certain base pairs (for example A6G17 and U8A15) are substantially less at high [C] relative to their values in water (see SI Table 4).
Figure 1.
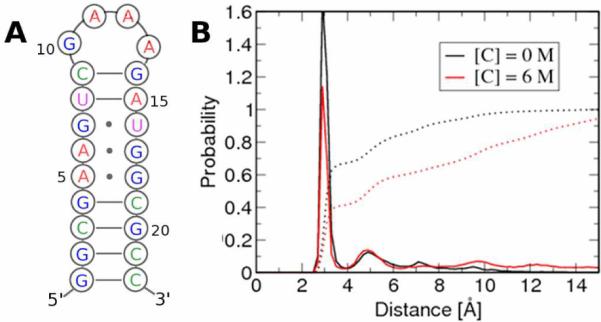
Effect of urea on the P5GA hairpin. A. Secondary structure map of P5GA. B. Probability distribution of the N1–N3, N1–N1 and N1–O2 inter-atomic distances of the GC(AU), GA and GU base pairs, respectively, in the stem. The dotted line is the integrated probability over the distances.
In contrast, the backbone conformational properties in the presence of urea are unperturbed, which is reflected in the distribution functions characterizing the phophodiester linkages. The angle distributions for α, β, γ, χ, and δ do not depend significantly on the urea concentration (Fig. 2 and SI Fig. 3). There are minor changes in the distributions of ε and ζ change as [C] increases to 6M or 8M (Fig. 2). The small peak in the ζ distribution at 30° (Fig. 2) corresponds to the opening of the bases, which is in accord with previous studies that probed the base-flipping dynamics.8 The [C]-dependent distributions of the ζ angle for each nucleotide show that the peak at 30° is also sampled by the GAAA tetra-loop (Fig. 1A). Taken together the results in Fig. 2 and SI Fig. 3 show that urea does not induce structural changes in the RNA backbone. The minor perturbations in the distributions of the χ, ε, and ζ angles is merely a consequence of the opening of the bases.
Figure 2.

Probability distributions of the dihedral angles along phosphodiester backbone of the RNA hairpin at [C]=0, 6, 8 M.
To provide a molecular picture of urea-RNA interactions we introduce the dehydration ratio λDR = ΔNW/NU where ΔNW is the difference in the number of water molecules in the first solvation shell of RNA as [C] increases from 0 and NU is number of urea molecules in the first solvation shell at [C] (SI Table 5. A value of λDR > 1 implies that more than one water molecule is exchanged for each urea. The values of λDR change from 2.54 at 1M urea to about 0.85 at [C] = 8M. The decrease in λDR at higher [C] is because the number of water molecules ceases to decrease while the number of urea molecules in the first solvation shell increases. The value of λDR around the phosphodiester backbone is approximately independent of [C] (SI Table 5), which further indicates that the primary disruption of RNA structure is due to interactions of urea with the bases.
The [C]-dependent values of λDR also suggests that urea can engage in multiple interactions with the nucleic acid bases, which are reflected in the radial distribution functions (RDF) (Fig. 3A). There is an asymmetry in the interaction of NU and OU atoms of urea with RNA; NU atoms compete with water for direct hydrogen bonding interactions with both the bases and the backbone of the RNA as evident from a sharp peak in the RDF around 3 Å at all [C] (SI Fig. 4). The urea oxygen RDFs exhibit three distinct peaks approximately at 3, 4 and 5 Å (Fig. 3A). Surprisingly, the peak at 3 Å, which corresponds to the direct interactions with the RNA, is absent at [C] ≠ 0 indicating that there are only few direct interactions with the hydroxyl group of the ribose moiety and almost all the direct interactions occur with the bases. The additional peaks at approximately 4 and 5 Å correspond to oxygen atoms in urea molecules that indirectly interact with the RNA via the urea nitrogen atom. Representative examples of common hydrogen bonding interactions of urea with both the bases and backbone of the RNA show (Fig. 3B) that NU donates a hydrogen bond to N7 of a guanine base, with the distance between the hydrogen bond acceptor and the OU ≈ 4 Å corresponding to the second peak of the RDFs of the oxygen (Fig. 3A). Multiple urea-RNA interactions, leading to λDR > 1, include N7 and O6 of a single guanine base hydrogen bonding simultaneously the NU atoms (Fig. 3B), with the distances between the hydrogen bond acceptors and OU being around 5 Å, corresponding to the third peak in the RDFs (Fig. 3A). Remarkably, urea participates in stacking interactions with the bases (right panels in Fig. 3B), which further contributes to the destabilization of the folded RNA. Two urea molecules are positioned parallel to the purine base and the approximate interplanar distances are around 3.5 Å, which is comparable to the distance between the two rings in a benzene dimer that are stacked parallel to each other.9
Figure 3.
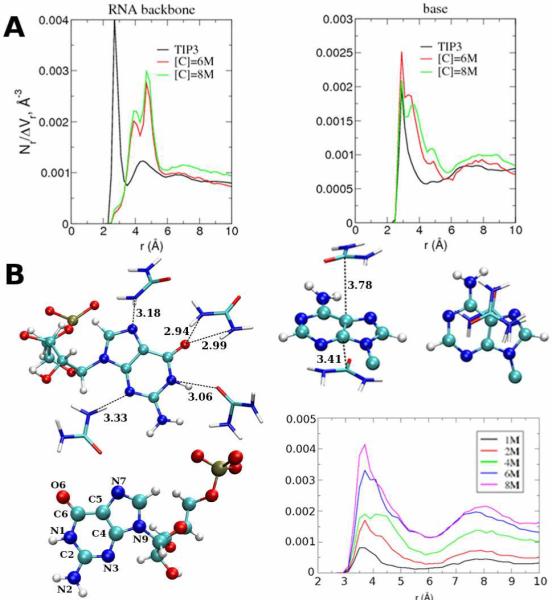
A. RDFs of OU around the RNA nitrogen atoms at 6M and 8M urea. The water RDFs are scaled by 5 and 10 for the urea oxygen plots. Results are shown for the RNA backbone atoms (phosphodiester and sugar oxygen) and RNA bases. B. Structure with multiple hydrogen bonds between urea and RNA base and phosphate group. The panels on the right show the structure of urea-base stacking and the corresponding RDFs between the urea carbon and C4, C5, C2 (A and G) and C5, C6 (C and U) atoms. The contributions from individual atom are in SI Fig.13.
Because of the limitations in the sampling of the conformational space of the P5GA hairpin, we also simulated a smaller RNA duplex made of four complimentary base pairs at varying [C] (Fig. 4). To establish the robustness of the denaturation mechanism we used a different urea force field (see SI). Since the base pair distances (ri) are subject to significant fluctuations when the base pairs are not formed, the inverse distance Xi (=ri−1 can be used to better visualize the equilibrium dynamics of the RNA duplex (Fig.4A). From 300 ns trajectories at each [C] (see Fig. 4A and SI Fig.5) we calculated the fraction of bound duplex using fB = τB/(τB+τU and the change in free energy for (bound)⇔(unbound), ΔG[C]/kBT=log[(1-fB)/fB]=log(τU/τB. The dwell time in the bound state τB satisfies Σ i=14 ϴ[Xc – Xi(t)] ≠ 0 and τU is the time for Σ i=14 ϴ[Xc – Xi(t)] = 0; ϴ(X) is the Heaviside step function, and Xc = 0.2(Å)−1. For GC pair, Xi is the inverse distance between H1 and N3 atoms in G and C, while for GU Xi is taken between H1 in G and O2 in U (see SI Fig. 6). The decrease in fB, relative to its value in water, as [C] increases (Fig. 4B), quantitatively demonstrates the destabilizing effect of urea on the RNA duplex. Because of the small size of the RNA the bound state is unstable even at [C]=0M, in accord with an estimated melting temperature in the range between 18–35 °C.10
Figure 4.

Urea-induced structural transitions. A. The structure of RNA duplex (left). Inverse N1–N3 distances of the four base pairs (color-code, blue, green, red and black are used consistently) as a function of time at [C] = 0M (top) and [C[ = 6M (bottom); B. Fraction of bound fB and change in free energy ΔG as a function of urea concentrations. The fit is made for m-value analysis; C. RDFs of urea oxygen and water oxygen with respect to H1 atom of the G base when the duplex is bound or denatured at [C]=6 M.
Just as in proteins the free energy difference between the bound and the denatured states of the duplex RNA varies as ΔG[C]/kBT = ΔG[0] + m[C] (Fig. 4B). The value of m, which is the slope of the aqua line in Fig. 4B is ≈ 0.21kcal/mol·M. It is known that the m- value is a function of the RNA length, ion concentration, and depends sensitively on the valence of the counterion. Taking these factors into account, we find that the m-value obtained for the first time using simulations is in reasonable agreement with measurements on small duplexes.2c,11
The pair correlation functions involving water around the bound duplex were calculated using only those conformations that satisfy Σi=14 ϴ[Xc – Xi(t)] =4 (aqua shadow in Fig. 4A). The g(r) for the denatured state is calculated using the time traces in which the RNA duplex is fully denatured, i.e., Σi ϴ[Xc – Xi(t)] =0 (yellow shadow in Fig. 4A). The RDFs of OU and water oxygen relative to various atoms of the nucleic acid at varying urea concentrations (SI Figs. (7–13)) lead to a number of interesting conclusions: (i) Near the base, the density of water is below the bulk density (g(r→∞)≈1). As a consequence of the hydrophobic nature of the base the water distribution around the hydrogen atoms at H1 (Fig. 4C and SI Fig. 12) and H21 or H22 of amide group of G (SI Fig. 11), finding that g(r) < 1 regardless of the state of the ds-RNA. (ii) When paired bases are disrupted, OU forms a hydrogen bond with H1 atom in G (Fig. 4C and SI Fig. 7), which is reflected in the increase of RDF peak of urea at r = 2 Å. (iii) The g(r)s of urea or water around H21 or H22 (SI Fig. 8 and 11), O6 oxygen in Guanine base (SI Fig. 9), and OP1 or OP2 in phosphate group (SI Fig. 10) are similar between bound and denatured forms. Thus, the disruption of the central hydrogen bond involving H1 of G, which is replaced by hydrogen bonds involving OU, is the key event for the RNA denaturation. (iv) Comparison of g(r) functions in SI Figs. 8 and 11 shows in a dramatic fashion the depletion of water around the bases. More importantly, the ability of OU to form multiple hydrogen bonds is vividly illustrated (see Fig. 8 in the SI). (v) Stacking interactions with urea are reflected in the various RDFs (see Figs. 3 and SI).
Both sets of simulations show that destabilization of RNA is due to disruption of base-pair interactions by direct multiple hydrogen bonding with the bases and formation stacking interactions with the bases. In contrast to proteins, a multitude of favorable interactions largely involving the solvent-exposed bases leads to urea-induced destabilization of the structured RNA. In particular, there is no analogue of the stacking interactions involving urea in proteins, though stacking interactions in GdnHCl have been observed.13 Finally, the proposed mechanism readily explains the observations2 that urea-induced destabilization of base pair interactions in misfolded RNA molecules can increase the folding rates, thus acting as “chemical” chaperones.
Supplementary Material
Acknowledgement
This work was supported in part by grants from the National Science Foundation (CHE 09-10433), the NIH (GM51501), and the National Research Foundation of Korea (NRF) (R01-2008-000-10920-0, KRF-C00142, KRF-C00180 and 2009-0093817).
Footnotes
Supporting Information Available: Simulation methods and figures. This material is available free of charge in the Internet at http://pubs.acs.org.
REFERENCES
- (1).(a) Fersht A. Structure and Mechanism in Protein Science: A Guide to Enzyme Catalysis and Protein Folding. W. H. Freeman Company; 1998. [Google Scholar]; (b) Tanford C. J. Am. Chem. Soc. 1964;86:2050–2059. [Google Scholar]; (c) Makhatadze GI, Privalov PL. J. Mol. Biol. 1992;226:491–505. doi: 10.1016/0022-2836(92)90963-k. [DOI] [PubMed] [Google Scholar]; (d) Myers JK, Pace CN, Scholtz JM. Protein Sci. 1995;4:2138–2148. doi: 10.1002/pro.5560041020. [DOI] [PMC free article] [PubMed] [Google Scholar]
- (2).(a) Pan J, Thirumalai D, Woodson SA. J. Mol. Biol. 1997;273:7–13. doi: 10.1006/jmbi.1997.1311. [DOI] [PubMed] [Google Scholar]; (b) Rook MS, Treiber DK, Williamson JR. Proc. Natl. Acad. Sci. 1998;281:609–620. doi: 10.1006/jmbi.1998.1960. [DOI] [PubMed] [Google Scholar]; (c) Shelton VM, Sosnick TR, Pan T. Biochemistry. 1999;38:16831–16839. doi: 10.1021/bi991699s. [DOI] [PubMed] [Google Scholar]; (d) Sclavi B, Woodson SA, Sullivan M, Chance MR, Brenowitz M. J. Mol. Biol. 1997;266:144–159. doi: 10.1006/jmbi.1996.0775. [DOI] [PubMed] [Google Scholar]
- (3).(a) Robinson DR, Jencks WP. J. Am. Chem. Soc. 1965;87:2462–2469. doi: 10.1021/ja01089a028. [DOI] [PubMed] [Google Scholar]; (b) Wallqvist A, Covell DG, Thirumalai D. J. Am. Chem. Soc. 1998;120:427–428. [Google Scholar]; (c) Vanzi F, Madan B, Sharp K. J. Am. Chem. Soc. 1998;120:10748–10753. [Google Scholar]; (d) Tobi D, Elber R, Thirumalai D. Biopolymers. 2003;68:359–369. doi: 10.1002/bip.10290. [DOI] [PubMed] [Google Scholar]; (e) Soper AK, Castner EW, Luzar A. Biophys. Chem. 2003;105:649–666. doi: 10.1016/s0301-4622(03)00095-4. [DOI] [PubMed] [Google Scholar]; (f) Bennion BJ, Daggett V. Proc. Natl. Acad. Sci. 2003;100:5142–5147. doi: 10.1073/pnas.0930122100. [DOI] [PMC free article] [PubMed] [Google Scholar]; (g) O'Brien EP, Dima RI, Brooks B, Thirumalai D. J. Am. Chem. Soc. 2007;129:7346–7353. doi: 10.1021/ja069232+. [DOI] [PubMed] [Google Scholar]; (h) Hua L, Zhou R, Thirumalai D, Berne BJ. Proc. Natl. Acad. Sci. 2008;105:16928–16933. doi: 10.1073/pnas.0808427105. [DOI] [PMC free article] [PubMed] [Google Scholar]; (i) England JR, Pande VS, Haran G. J. Chem. Soc. 2008;130:11854–11855. doi: 10.1021/ja803972g. [DOI] [PMC free article] [PubMed] [Google Scholar]
- (4).Mason PE, Neilson GW, Enderby JE, Saboungi M-L, Dempsey CE, MacKerell AD, Brady JW. J. Am. Chem. Soc. 2004;126(11):462–11470. doi: 10.1021/ja040034x. [DOI] [PubMed] [Google Scholar]
- (5).Rudisser S, Tinoco I., Jr. J. Mol. Biol. 2000;295:1211–1223. doi: 10.1006/jmbi.1999.3421. [DOI] [PubMed] [Google Scholar]
- (6).Huang N, Banavali NK, MacKerell AD., Jr. Proc. Natl. Acad. Sci. 2003;100:68–73. doi: 10.1073/pnas.0135427100. [DOI] [PMC free article] [PubMed] [Google Scholar]
- (7).Pan YP, Priyakumar D, MacKerell AD., Jr. Biochemistry. 2005;44:1433–1443. doi: 10.1021/bi047932q. [DOI] [PubMed] [Google Scholar]
- (8).(a) Banavali NK, MacKerell AD., Jr. J. Mol. Biol. 2002;319:141–160. doi: 10.1016/S0022-2836(02)00194-8. [DOI] [PubMed] [Google Scholar]; (b) Banavali NK, Huang N, MacKerell AD., Jr. J. Phys. Chem. B. 2006;110:10997–11004. doi: 10.1021/jp0561322. [DOI] [PMC free article] [PubMed] [Google Scholar]
- (9).Sinnokrot MO, Valeev EF, Sherrill CD. J. Am. Chem. Soc. 2002;124:10887–10893. doi: 10.1021/ja025896h. [DOI] [PubMed] [Google Scholar]
- (10).Xia T, et al. Biochemistry. 1998;37:14719–14735. doi: 10.1021/bi9809425. [DOI] [PubMed] [Google Scholar]
- (11).(a) Scholtz JM, Barrick D, York EJ, Stewart JM, Baldwin R. Proc. Natl. Acad. Sci. 1995;92:185–189. doi: 10.1073/pnas.92.1.185. [DOI] [PMC free article] [PubMed] [Google Scholar]; (b) Pace CN, Shaw KL. Proteins: Struct. Func. Genetics. 2000;Suppl 4:1–7. doi: 10.1002/1097-0134(2000)41:4+<1::aid-prot10>3.3.co;2-u. [DOI] [PubMed] [Google Scholar]
- (12).(a) Shelton VM, Sosnick TR, Pan T. Biochemistry. 2001;40:3629–3638. doi: 10.1021/bi002646+. [DOI] [PubMed] [Google Scholar]; (b) Lambert D, Draper DE. J. Mol. Biol. 2007:993–1005. doi: 10.1016/j.jmb.2007.03.080. [DOI] [PMC free article] [PubMed] [Google Scholar]
- (13).Mason PE, Brady JW, Neilson GW, Dempsey CE. Biophys. J. 2007;93:L04–L06. doi: 10.1529/biophysj.107.108290. [DOI] [PMC free article] [PubMed] [Google Scholar]
Associated Data
This section collects any data citations, data availability statements, or supplementary materials included in this article.