Abstract
Perinatal hypoxia-ischemia (HI) may result in long-term neurological deficits. In addition to producing neuron death, HI causes death of neural precursor cells (NPCs) in the developing brain. To characterize the molecular pathways that regulate hypoxia-induced death of NPCs, we treated a mouse neural stem cell line (C17.2 cells) and fibroblastic growth factor-II-expanded primary NPCs derived from wild-type or gene-disrupted mice, with oxygen glucose deprivation (OGD) or the hypoxia-mimetics desferrioxamine (DFO) or Cobalt chloride. NPCs undergoing hypoxia exhibited time- and concentration-dependent caspase-3 activation and cell death, which was significantly reduced by treatment with a broad caspase inhibitor or protein synthesis inhibition. Bax/Bak-deficient NPCs were protected from DFO-induced death and exhibited minimal caspase-3 activation. OGD or hypoxia-mimetic exposure also resulted in increased hypoxia inducible factor alpha and bcl-2/adenovirus E1B 19 kDa interacting protein-3 (BNIP3) expression. BNIP3 shRNA treatment failed to affect hypoxia-induced caspase-3 activation but inhibited cell death and nuclear translocation of apoptosis inducing factor, indicating that BNIP3 is an important regulator of caspase-independent NPC death following hypoxia. These studies demonstrate that hypoxia activates both caspase-dependent and -independent NPC death pathways that are critically regulated by multiple Bcl-2 family members.
Keywords: Apoptosis, Apoptosis inducing factor, BNIP3, Hypoxia
INTRODUCTION
Programmed cell death of neural precursor cells (NPCs) is important for normal nervous system development but pathological apoptosis of NPCs under conditions such as perinatal hypoxia-ischemia (HI) may contribute to long term neurological dysfunction (1). Hypoxia induces a stimulus-specific cell death response resulting in the stabilization of hypoxia-inducible factor (HIF) and p53 (2). During normoxia, proline hydroxylase domain proteins hydroxylate HIF-1α, which is required for its binding to von-Hippel-Lindau tumor suppressor protein, a component of an E3 ubiquitin ligase, thus resulting in HIF-1α proteosomal degradation (3–5). During hypoxia, HIF-1α remains non-hydroxylated, which leads to its stabilization and transactivation of target genes through hypoxia-regulated elements, which may result in either apoptotic or non-apoptotic cell death (6–8). Hypoxia mimetics such as desferrioxamine (DFO), and Cobalt Chloride (CoCl2), sequester iron and ascorbate, the rate limiting molecules needed by proylhydoxylases, thus effectively inhibiting HIF1α proteosomal degradation, leading to HIF1α and HIF1β dimerization and the induction of HIF-inducible genes (9, 10).
Programmed cell death has been classified as type I (apoptotic) or type II (autophagic) and is important for normal nervous system development (11,12). Apoptosis is mediated by Bcl-2 family protein members. Bcl-2 pro-survival proteins negatively regulate pro-apoptotic proteins Bax and Bak via interactions between their Bcl-2 homology (BH) domains. The interaction between Bcl-2 and Bax may be inhibited by BH3-only pro-apoptotic proteins in a stimulus-specific pattern. bcl-2/adenovirus E1B 19 kDa interacting protein-3 (BNIP3), a BH3-only protein, has been previously implicated in hypoxia-induced cell death (13, 14). The promoter of BNIP3 contains a functional hypoxia response element and is activated by E2F and HIF-1α under hypoxic conditions and by stimuli such as cyanide, ceramide, and arsenic trioxide (15–17). BNIP3 and other Bcl-2 family members also regulate autophagy, a naturally occurring catabolic process that sequesters and degrades cytosolic contents via the lysosome (18). The Bcl-2 and BNIP3 interaction increases during hypoxia while the Beclin1 and Bcl-2 interaction decrease, thus promoting the accumulation of autophagic vacuoles (19).
To investigate the molecular mechanisms regulating hypoxia-induced NPC death, we utilized the hypoxia mimetics DFO and CoCl2, and OGD and found that these agents increased expression of HIF-1α and BNIP3. Hypoxia-induced NPC death occurred through both a Bax/Bak mediated caspase-dependent pathway and a caspase-independent pathway that is regulated by BNIP3.
MATERIALS AND METHODS
Animals
C57BL/6J mice were used in all experiments. Mice were housed and cared for according to the NIH Guide for the Core and Use of Laboratory Animals. All animal protocols were approved by the Institutional Animal Care and Use Committee of the University of Alabama at Birmingham. The generation of Bax-deficient mice has been described previously (20). The genotypes for gene-disrupted mice were determined from tail DNA extracts by polymerase chain reaction (PCR).
Cell Culture
Fibroblast growth factor-2 (FGF2) has been previously demonstrated to stimulate NPC proliferation while maintaining their undifferentiated state. NPC cultures were established from the cerebellum of postnatal day 6 to 7 male and female mice as previously published (21). Briefly, freshly isolated, dissociated cerebellar cells were incubated at 37°C in humidified 5% CO2/95% air atmosphere; this allowed glia and post-mitotic neurons to adhere while non-adherent cell populations were suspended in the supernatant. After 24 hours, non-adherent cells in the supernatant were transferred to a poly-L-lysine (Sigma, St. Louis, MO)- and laminin (BD Bioscience, Bedford, MA)-coated flask. NPCs formed an adherent monolayer and were grown until they were 70% confluent. Fresh FGF2-containing media was added every 3 to 4 days. Cells were passaged and plated as previously described (21). A small aliquot of cells was stained with Trypan Blue and counted. 30,000 cells were plated per well and allowed to grow for 2 to 4 days in FGF2-containing media. Experimental agents (DFO, CoCl2) were added directly to the medium.
C17.2 Cells
The C17.2 neural stem cell line was a generous gift from Dr. Evan Y. Snyder (Burnham Institute, La Jolla, CA). C17.2 cells were derived from the mouse cerebellar external granule cell layer and possess neural stem cell properties (22). C17.2 cells were cultured in high-modified Dulbecco’s Modified Eagle’s Medium (DMEM; Gibco, Grand Island, NY) containing 1% penicillin/streptomycin, 1% L-glutamine (Sigma), 5% horse serum, and 10% fetal calf serum (Gibco). The cells were passaged every other day by trypsinization and adding a tenth of the cells to a new T75 flask. Cells were plated on 48-well plates at a density of 30,000 cells per well. Cultures were incubated for 1 day before treatment. Desferrioxamine, CoCl2, and Boc-Asp-FMK (50 μM) were added to 3% horse and fetal calf serum-containing media to keep C17.2 cells in a proliferative state. For OGD studies, cells were cultured in DMEM without (−) glucose placed in either a standard incubator (normoxia) or into a hypoxia chamber in which the oxygen concentration is maintained below 1%.
Cell Viability and Caspase Assays
Cell viability was assessed by the Calcein AM assay. Briefly, cells were washed in Locke’s buffer (154 mM NaCl, 5.6 mM KCl, 3.6 mM NaHCO3, 2.3 mM CaCl2, 1.2 mM MgCl2, 5.6 mM glucose, 5 mM HEPES, pH 7.4). 5 μM Calcein AM (Molecular Probes, Eugene, OR) was diluted in this buffer and added to cells; they were then incubated at 37°C for 30 minutes. Calcein AM conversion was measured using a fluorescence plate reader (excitation 488 nM, emission 530 nM). To calculate the percentage of dead cells after DFO exposure, live and dead cell numbers were determined by using Calcein AM and propidium iodide. To assess caspase activity in vitro, we utilized the DEVD-AMC labeled caspase substrate cleavage assay. Following treatment, cells were lysed in 100μl buffer A (10 mM HEPES, pH 7.4, 42 mM KCl, 5 mM MgCl2, 1 mM DTT, 0.5% CHAPS, 10% sucrose, 1 mM PMSF, and 1μg/ml leupeptin) followed by 150 μl of buffer B (25 mM HEPES, pH 7.4, 1 mM EDTA, 0.1% CHAPS, 10% sucrose, and 3 mM DTT) containing 10 μM DEVD-AMC (Biomol, Plymouth Meeting, PA) and incubated at 37°C for 30 minutes. Production of the fluorescent AMC caspase-3 product was measured with a fluorescence plate reader (excitation 360 nM, emission 460 nM). Both assays were expressed in comparison to untreated controls.
Immunocytochemistry
NPC cultures were fixed in 4% paraformaldehyde for 20 minutes at 4°C followed by phosphate-buffered saline (PBS) wash and stored at 4°C. Cells were permeabilized with PBS-blocking buffer (PBS with 0.1% BSA, 0.3% Triton X-100, and 0.2% nonfat powdered milk) for 30 minutes at room temperature (RT). Primary antibodies were incubated overnight at 4°C in PBS blocking buffer without Triton. The primary antibodies used were rabbit anti-LC3, cleaved caspase-3 (9661), pyruvate dehydrogenase (PDH; 3205), and BNIP3 (3769) (all from Cell Signaling Technologies, Danvers, MA), and goat anti-apoptosis inducing factor (AIF) (sc-9416) (Santa Cruz Biotechnology, Santa Cruz, CA). Plates were washed with PBS and secondary antibody was applied, either horseradish peroxidase-conjugated horse anti-rabbit SuperPicture (Zymed Laboratories Inc., South San Francisco, CA) or anti-goat Vector Impress (Vector Laboratories, Burlingame, CA) for 1 hour at RT. Plates were washed with PBS and immunoreactivity was detected using Tyramide Signal Amplification (TSA) system (Perkin-Elmer Life Science Products, Boston, MA). Following PBS washes the cells were counterstained with bisbenzimide (2 μg/ml; Hoechst 33258; Sigma). Plates were examined with a Zeiss Axioskop microscope equipped with epifluorescence. Images were captured using Axiovision® software.
Confocal Laser Scanning Microscopy
For dual labeling of BNIP3 and PDH, immunocytochemical analysis was performed as described above. After TSA detection of BNIP3, 0.3% H2O2 was added for 10 minutes to destroy any residual horseradish peroxidase activity followed by PBS wash. Cells were then incubated for 30 minutes in PBS blocking buffer containing Triton followed by diluted PDH in PBS blocking buffer without Triton overnight. The next day, goat anti-mouse Vector Impress (Vector Laboratories) was applied for 1 hour followed by TSA detection (Perkin-Elmer Life Science Products, Boston, MA). Cells were then stained with bisbenzimide, coverslipped, and imaged using a Leica Confocal TCS SP1 UV unit with a Coherent Laser Group Enterprise UV laser for blue fluorochromes, Argon laser for green fluorochromes, and Helium/Neon laser for far red fluorochromes. Filter sets for fluorescein and Cy3 were used (Chroma Technology Corp., Brattleboro, VT). Fluorochrome excitation and emission was controlled by using an accusto-optical tunable filter and prism spectrophotometer. The 100x objective and Leica confocal software were used to acquire images from untreated and DFO-treated neural stem cells.
RNA extraction and reverse transcriptase - polymerase chain reaction
Following DFO treatment, NPCs were trypsinized as described above. Suspensions were centrifuged at 1,700 RPM and the cells were then lysed using Trizol reagent (Invitrogen, Carlsbad, CA) and RNA was extracted by following the manufacture’s protocol. RNA (1 μg) was incubated with 200 ng random hexamers, 0.5 mM dNTPs, and RNase-free water at 65°C for 10 minutes (Invitrogen). After incubation, 5x first strand buffer, 5 mM DTT, 40U RNAseOUT, and 200U SuperScript III was added and the reaction mixture was incubated at RT for 5 minutes, at 50°C for 60 minutes, at 70°C for 15 minutes, and at 4°C for 10 minutes. Cyclophilin was used as a cDNA control. Semiquantitative RT-PCR was performed using Taq DNA polymerase (Sigma) according to manufacturer’s instructions and the following primers were used: (HIF1α forward primer) TGAGGCTCACCATCAGTTAT, (HIF1α reverse primer) CCTCATGGTCACATGGATGA, (cyclophilin forward primer), (BNIP3 forward primer) CCCTGCTACCTCTCGGTGAC, (BNIP3 reverse primer) GCTGGGCATCCAACAGTATT, (cyclophilin forward primer) CAAGACTGAGTGGCTGGATGG, (cyclophilin reverse primer) TAAAATGCCCGCAAGTCAAAGAAA. PCR products were run on 1.5% agarose gels and stained with ethidium bromide and photoimaged with a UV transilluminator.
RNA Interference
Lentiviral shRNA (BNIP3) constructs were purchased from Open Biosystems (RMM4534_001478188). Plasmids containing the shRNAs were co-transfected into 293FT cells together with packaging plasmids by following the manufacturer’s protocol (ViraPower™ Lentiviral Expression Systems kit, Invitrogen). C17.2 cells were passaged and plated in a 6-well plate and allowed to adhere for 24 hours before infection. C17.2 cells were subjected to lentiviral infection in the presence of polybrene overnight and media was replaced by fresh media on the following day. After 24 hours, cells were selected by treating with media containing 1.5 μg/ml puromycin. Protein levels and experiments were assessed after at least 72 hours and cells were passaged as needed.
Lysate Preparation
Preparation of whole cell lysates was performed as follows. Briefly, cells were suspended in lysis buffer (2 mM Tris-HCl, 150 mM NaCl, 2 mM EDTA, 1% Triton X-100, and 10% Glycerol) with 1% PMSF, 1% protease inhibitor cocktail (Sigma) and 1% phosphatase inhibitor cocktail protease and incubated on ice for 30 minutes with vortexing every 10 minutes. Samples were centrifuged at 13,000 × g for 15 minutes and protein concentrations determined via Pierce BCA kit (Pierce, Rockford, IL).
Preparation of nuclear and cytoplasmic fractions was performed using the NE-PER® Biotechnology kit (Pierce) according to the manufacturer’s instructions. Briefly, cells were suspended in reagent I (Cer I) containing 1% protease inhibitor cocktail (Sigma) and 1% phosphatase inhibitor cocktail (Sigma) and then incubated on ice for 10 minutes; 11 μl of reagent II (Cer II) was added to the mixture, vortexed, and then incubated on ice for 1 minute. The sample was centrifuged at maximum speed (13,000 × g) for 10 minutes at 4°C. The supernatant (cytoplasmic fraction) was transferred to a new tube and stored at −80°C. The pellet was resuspended in 100 μl of ice-cold nuclear extraction reagent (NER I) and vortexed for 15 seconds every 10 minutes over a total of 40 minutes. The sample was then centrifuged at max speed (13,000 × g) for 10 minutes at 4°C. The supernatant (nuclear fraction) was transferred to a new tube and stored at −80°C. Protein concentrations were determined as above.
Western blot
Equal amounts of whole cell lysates were resolved by SDS-PAGE and transferred to PVDF. Blots were blocked for 1 hour at RT, 5% milk in wash buffer (200 mM Tris Base, 1.37 M NaCl, 1% Tween 20, pH 7.6), followed by overnight incubation with primary antibodies. Blots with transferred and probed for either AIF (4642), BNIP3 (3769), Poly (ADP-ribose) polymerase (PARP) (9542), cleaved caspase-3 (9661) (all from Cell Signaling Technologies), HIF 1α (400080, Calbiochem), or β-tubulin (sc-9104) (Santa Cruz) served as a loading control. After primary antibody incubation, blots were washed with 1X TBS containing 0.1% Tween 20, then incubated with secondary antibody, either goat anti-rabbit IgG (BioRad, Hercules, CA) or anti-mouse IgG (Cell Signaling Technologies), for 1 hour at RT and washed. Signal was detected using Supersignal chemiluminescence (Pierce), or ECL (Amersham, Fairfield, CT). Western blots were scanned into Adobe Photoshop and digitized with the UN-SCAN-IT software, version 6.1 (UN-SCAN-IT, Orem, UT).
Statistics
For experiments involving quantification, SEM were determined from at least 3 independent experiments with an “n” of 1 representing 1 gene disruptedmouse accompanied by 1 wild-type litter mate control or separate experiments from different C17.2 passages. Effects of genotype for each age were analyzed for significance using two-way ANOVA, followed by Bonferroni test for all pair-wise comparisons. In all cases, a p value of less than or equal to 0.05 was considered significant.
RESULTS
Hypoxia causes time-dependent neural precursor cell death
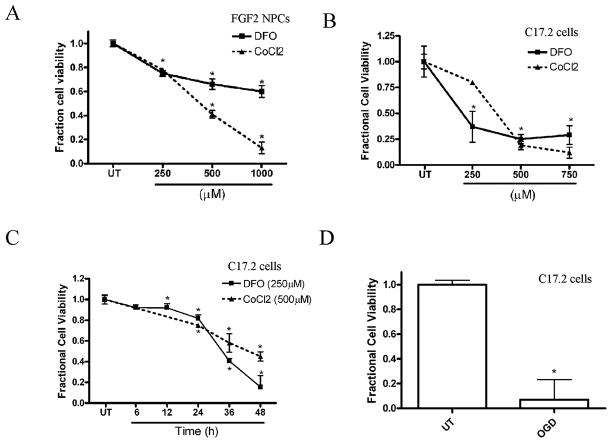
To dissect the molecular pathways associated with hypoxia-induced death of NPCs, we used mitogenically expanded mouse NPCs and C17.2 cells, a mouse neural stem cell line. We developed an in vitro hypoxia model by treating these cells with the iron-chelator DFO or CoCl2. Both NPCs and C17.2 cells exposed to DFO or CoCl2 exhibited concentration- and time-dependent decreases in viability (Fig. 1AC, and data not shown). OGD has been previously used to model the effects of HI on neuronal cells in vitro (23). C17.2 cells exposed to OGD for 16 hours showed significantly decreased cell viability compared to untreated cells (Fig. 1D).
Figure 1.
Hypoxia mimetics and oxygen glucose deprivation (OGD) cause concentration- and time-dependent decreases in neural precursor cell (NPC) viability. (A) NPC viability decreased significantly after CoCl2 and desferrioxamine (DFO) treatment at concentrations greater than or equal to 250 μM for 36 hours compared to untreated (UT) cells. Viability was assessed by measuring the fluorescence produced from the cleavage of Calcein AM by intracellular esterases in intact cells. (B) C17.2 cell viability decreased significantly after 36 hours exposure to DFO and CoCl2 at concentrations greater than or equal to 250 μM for 36 hours compared to UT cells (C) C17.2 cells exposed to 250 μM DFO or 500 μM CoCl2 exhibited decreased cell viability by 24 hours, which further decreased at 48 hours. (D) C17.2 cells subjected to 16-hour OGD resulted in decreased cell viability. Data points represent mean ± SEM, with n = 6. *p < 0.01 by one-way ANOVA/Bonferroni post hoc test versus UT controls.
Caspase activation in hypoxia-induced neural precursor cell death
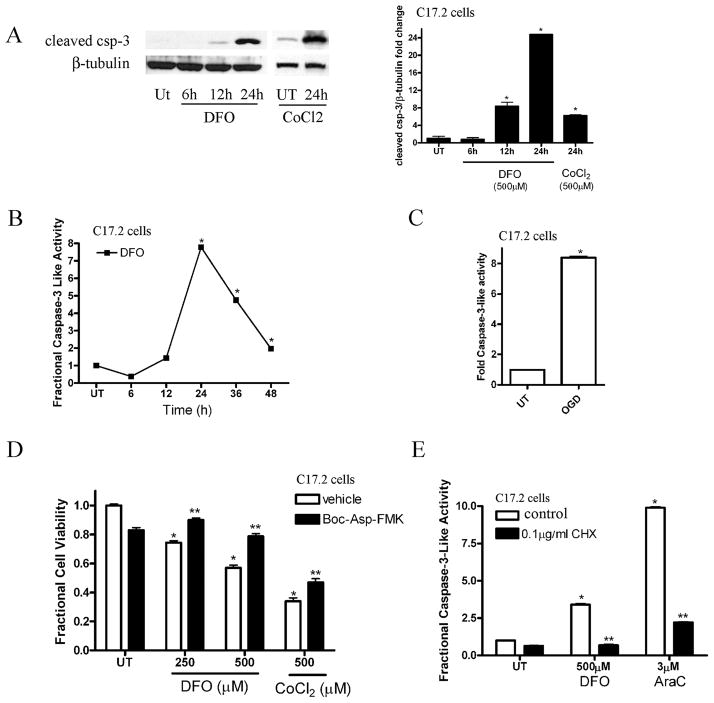
We previously demonstrated that C17.2 neural stem cells and NPCs undergo cell death in response to staurosporine treatment or genotoxic insult (21). To examine the apoptotic signaling cascade involved in hypoxia-induced NPC death, we measured caspase-3 activation, an important component of the apoptotic death pathway. To detect caspase-3 activation, we performed Western blot analysis for the cleaved activated form of caspase-3 on whole cell lysates obtained from C17.2 cells treated in the absence or presence of 250 μM DFO from 6 to 24 hours or 500 μM CoCl2 for 24 hours. Whole cell lysates from C17.2 cells treated with DFO for 12 and 24 hours showed a significant increase in cleaved caspase-3 compared to the control and 6-hour DFO time point (Fig. 2A). Similarly, treatment with 500 μM CoCl2 for 24 hours caused a significant increase in cleaved caspase-3 (Fig. 2A). To assess caspase-3-like enzymatic activity, C17.2 cells were treated with normal media or 250 μM DFO for 6 to 48 hours and caspase-3-like activity was determined via the DEVD-AMC cleavage assay. Desferrioxamine-treated C17.2 cells exhibited a significant increase in caspase-3-like enzymatic activity by 24 hours (Fig. 2B). Similarly, OGD led to a significant increase in DEVD-AMC cleavage after 12 hours exposure (Fig. 2C).
Figure 2.
Hypoxia causes neural precursor cell (NPC) caspase-3 activation. (A) Biochemical detection of cleaved caspase-3 revealed a significant increase at 12 to 24 hours after 250 μM desferrioxamine (DFO) exposure or 500 μM CoCl2 in C17.2 cells (24 hours) compared to untreated (UT) and 6 hours time point. Western blots were digitized by UN-SCAN-IT software and cleaved caspase-3/β-tubulin pixel totals were determined, normalized to UT groups, and values were expressed as fold change. The data represent mean ± SEM, with n = 4. *p < 0.01 by 2-way ANOVA/Bonferroni post hoc test versus UT. (B) DFO (250 μM) treatment for 12 to 48 hours leads to a significant increase in caspase-3 enzymatic activity as measured by the fluorescence produced by DEVD-AMC cleavage. Data points represent mean ± SEM, with n = 6. *p < 0.01 by one-way ANOVA/Bonferroni post hoc test versus UT controls. (C) Oxygen glucose deprivation (OGD) exposure for 12 hours caused a significant increase in casapse-3-like activity in C17.2 cells relative to UT cells. Data points represent mean ± SEM, with n = 6. *p < 0.01 by one-way ANOVA/Bonferroni post hoc test vs. UT controls. (D) Co-incubation with Boc-Asp-FMK (40 μM), a broad caspase inhibitor, attenuates DFO- and CoCl2-induced cell death after 24 hour treatment. *p < 0.01 by two-way ANOVA/Bonferroni post hoc test versus matched treated group. (E) Cycloheximide (CHX), a protein synthesis inhibitor, significantly attenuated caspase-3-like activation following 12 hours DFO (500 μM) or cytosine arabinoside (AraC) (3μM) exposure. *p < 0.01 by two-way ANOVA/Bonferroni post-test vs. treated in the presence of CHX.
Hypoxia has been shown previously to cause either apoptotic or non-apoptotic cell death in other in vitro cell models (19, 24). To test whether caspase activity was required for DFO- or CoCl2-induced NPC death, we treated NPCs with DFO or CoCl2 alone or in the presence of BOC-Asp-FMK, a broad caspase inhibitor. NPCs treated with hypoxia-mimetics in conjunction with BOC-Asp-FMK exhibited significantly less cell death than NPCs treated with DFO or CoCl2 (Fig. 2D), indicating that at least 1 component of hypoxia-induced NPC death is caspase-dependent.
To test the hypothesis that DFO-induced apoptosis requires new protein synthesis, we treated C17.2 cells with DFO alone or in the presence of the protein synthesis inhibitor cycloheximide (CHX). Cytosine arabinoside (AraC) was used as a control (25). We previously showed that AraC produces p53-dependent, transcription-dependent caspase-3 activation in NPCs (25). C17.2 neural stem cells were treated with fresh media in the presence or absence of DFO (500 μM) and/or CHX for 12 hours. CHX significantly reduced DFO-induced caspase-3-like enzymatic activity indicating that like AraC-induced caspase activation, hypoxia-induced caspase-3 activation requires new protein synthesis (Fig. 2E).
Hypoxia-mimetics cause an increase in HIF1α expression and protein levels
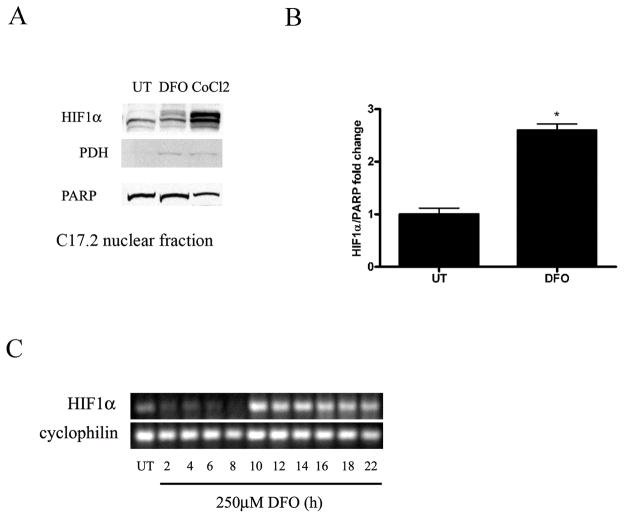
Hypoxia-mimetics have been shown to prevent ubiquitination and degradation of HIF1α, leading to its dimerization with HIF1β and induction of HIF inducible genes (3, 6, 8). We hypothesized that hypoxia-induced NPC death and caspase activation resulted from decreased HIF1α breakdown and increased HIF1α transcriptional activity. To determine whether hypoxia-mimetics lead to an increase in HIF1α protein, C17.2 cells were treated with 250 μM DFO or 500 μM CoCl2 for 24 hours followed by nuclear and non-nuclear fractionation. To confirm non-nuclear lysates, the mitochondria marker PDH was used and to confirm nuclear lysates, the nuclear protein PARP was used. C17.2 cells treated with DFO had a significant increase in HIF1α in nuclear fractions relative to controls (Fig. 3A, B).
Figure 3.
Hypoxic stimuli induce HIF1α expression. (A) Western blot analysis was performed on nuclear fractions prepared from C17.2 cells treated with 250 μM desferrioxamine (DFO) or 500 μM CoCl2 for 24 hours. DFO and CoCl2 treated neural precursor cells (NPC) had increased HIF1α protein levels compared to untreated (UT) cells. (B) Western blots for panel A were digitized by UN-SCAN-IT software and averages for HIF1α/ poly (ADP-ribose) polymerase (PARP) pixel totals were calculated and the data points expressed in fold change. Data points in A represent mean ± SEM, with n = 4. *p < 0.01 by one-way ANOVA/Bonferroni post hoc test vs. UT controls. (C) DFO-induced an increase in HIF1α expression after 10 hours that persisted for at least an additional 10 hours compared to UT cells and 2 to 8 hour time points. Cyclophilin was used as a cDNA loading control. PDH = pyruvate dehydrogenase.
Like hypoxia, DFO has been shown to cause HIF1α stabilization, allowing it to dimerize with HIF1β leading to the activation of HIF1α-inducible genes. HIF1α-regulated processes are dependent on transactivation of HIF inducible genes and new protein synthesis. To determine whether DFO caused an increase in HIF1α mRNA levels in NPCs, RT-PCR was performed on C17.2 cells treated with DFO compared to untreated controls. HIF1α gene expression was dramatically increased at 10 hours and remained elevated through 22 hours compared to untreated controls and earlier time points (Fig. 3C).
Hypoxia-induced death requires Bax and Bak
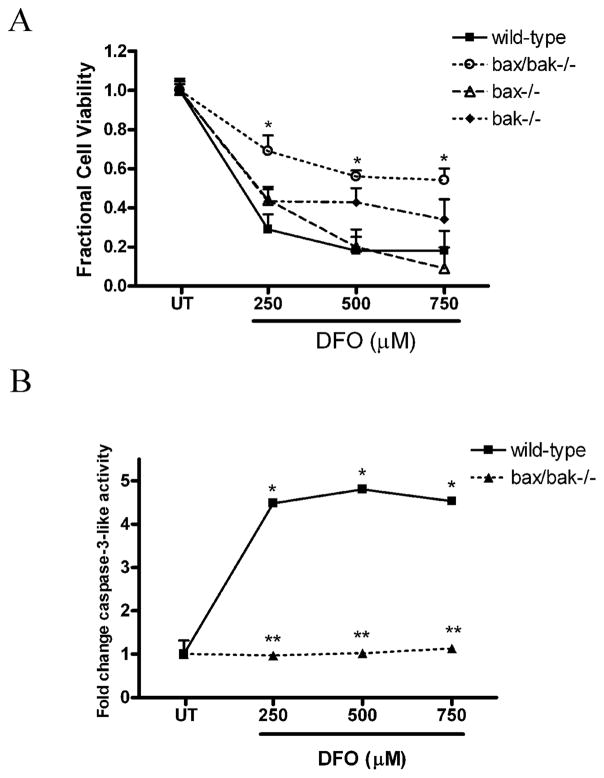
To define the regulators of hypoxia-induced NPC death further, we investigated the pro-apoptotic Bcl-2 family members Bax and Bak. We have previously reported that Bax is a critical regulator of staurosporine- and DNA damage-induced NPC apoptosis (21, 25). To determine whether Bax/Bak deficiency inhibits DFO-induced death, wild type, Bax-deficient, Bak-deficient, and Bax/Bak dual-deficient FGF2-expanded NPCs were treated with DFO for 24 hours. Bax/Bak-deficient NPCs were significantly protected from DFO-induced NPC death compared to wild type NPCs or NPCs deficient in Bax or Bak alone (Fig. 4A). Wild type and Bax/Bak-deficient NPCs were treated with 250, 500 and 750 μM DFO for 24 hours and caspase-3-like activity was measured via the DEVD-AMC cleavage assay. In contrast to a robust increase in wild type treated NPCs, Bax/Bak-deficient NPCs failed to show a significant increase in caspase-3-like activity after DFO (Fig. 4B). These data suggest a prominent role for Bax and Bak and the intrinsic mitochondrial apoptotic death pathway in regulating hypoxia-induced NPC death.
Figure 4.
Loss of Bax and Bak attenuates desferrioxamine (DFO)-induced neural precursor cell death and caspase-3 activation. (A) Bax/Bak-deficient NPCs exhibited significantly less death after 36 hours of exposure to DFO (250–750 μM) compared to wild type, bax−/−, or bak−/− NPCs. *p < 0.01 by two-way ANOVA/Bonferroni post hoc test compared with both the wild type and the knockout treated group. (B) Wild-type or Bax/Bak-deficient NPCs were treated with 250, 500, or 750 μM DFO or media alone for 24 hours. Bax/Bak-deficient NPCs exposed to DFO showed a significant decrease in caspase-3-like activity compared to wild-type NPCs. The data represent mean ± SEM, with n = 5. *p < 0.01 by two-way ANOVA/Bonferroni post hoc test compared to both the wild-type and the knock-out treated group.
Upregulation of BNIP3 in response to hypoxia
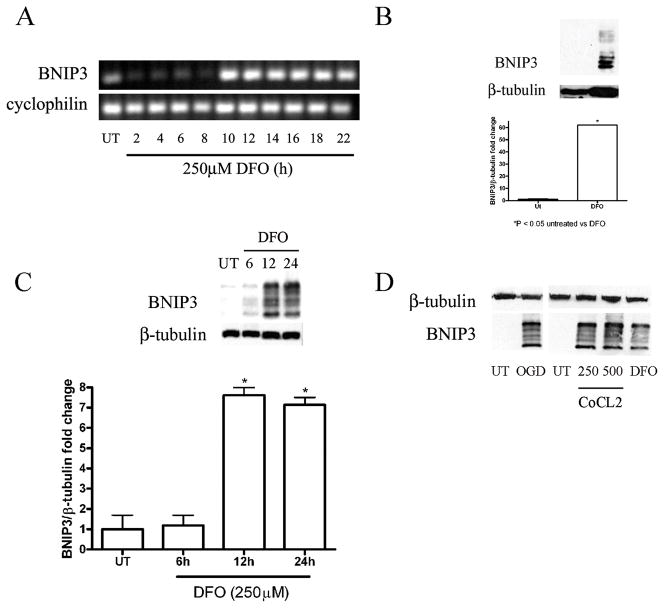
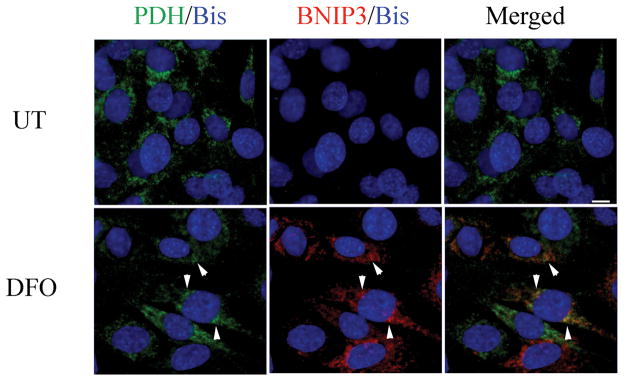
BNIP3 is a known HIF-inducible gene and has been previously implicated in both cell death and autophagy regulation (13, 24). BNIP3 is a BH3-only Bcl-2 family member and has been previously reported to mediate cell death independent of Apaf1, caspase activation, and cytochrome C release (14, 26). BNIP3 mRNA levels were assessed to determine whether DFO caused an increase in BNIP3 transcription. RNA was extracted from C17.2 cells treated with DFO for 0 to 22 hours followed by cDNA synthesis. RT-PCR revealed BNIP3 expression was increased from 10 to 22 hours following DFO treatment compared to untreated controls and other time points (Fig. 5A). To examine the effects of hypoxia on BNIP3 protein levels, Western blot analysis was performed on FGF2-expanded NPCs and C17.2 cells treated with DFO for 24 hours. The BNIP3 protein has a predicted molecular weight of 22 kDa but previous reports have indicated that it runs at multiple bands between 22 and 28 kDa and appears to form a dimer that exists around 50 to 55 kDa (17, 27, 28). BNIP3 protein levels were significantly increased in DFO-treated, FGF2-expanded NPCs at 24 hours compared to untreated wild type controls (Fig. 5B). BNIP3 levels were also assessed at 6- to 24-hour post-DFO exposure or 24 hour CoCl2 and compared to untreated cells. Lysates from C17.2 cells treated with DFO at 12 and 24 hours and CoCl2 (24 hours) revealed significant increases in BNIP3 isoforms (22–28 kDa) (Fig. 5C). Similar to DFO-treated NPCs, whole cell lysates from C17.2 cells exposed to OGD or CoCl2 also exhibited robust levels of BNIP3 compared to untreated NPCs (Fig. 5D). It has been reported that upon activation, BNIP3 integrates into the mitochondria membrane to induce cell death. Dual labeling immunocytochemistry and confocal analysis was performed to determine whether DFO treatment results in increased BNIP3 expression and mitochondria association. Consistent with the Western blot analysis, very little BNIP3 immunoreactivity was observed in untreated cells. Desferrioxamine-treated C17.2 cells exhibited markedly increased BNIP3 immunoreactivity that colocalized with the mitochondrial marker PDH (Fig. 6).
Figure 5.
Hypoxia increases mRNA expression and protein levels of BNIP3. (A) An increase in BNIP3 mRNA expression was detected within 10 hours after desferrioxamine (DFO) (250 μM) treatment and persisted for at least 10 hours compared to untreated (UT) and 2 to 8 hour time points. Cyclophilin was used as a cDNA loading control. (B) Lysates from fibroblast growth factor (FGF)-expanded neural precursor cells treated with 500 μM DFO for 24 hours had significantly increased BNIP3 protein levels compared to UT cells. (C) C17.2 cells showed a time-dependent increase in BNIP3 protein levels following DFO. Western blots for panels B and C were digitized by UN-SCAN-IT software and averages for BNIP3/β-tubulin pixel totals were calculated and the data points expressed in fold change. Data points in panels B and C represent mean ± SEM, with n = 4. *p < 0.01 by one-way ANOVA/Bonferroni post hoc test vs. UT controls. (D) C17.2 cells subjected to oxygen glucose deprivation (OGD), CoCl2, or DFO had in increased BNIP3 levels relative to UT controls.
Figure 6.
BNIP3 localizes to mitochondria following desferrioxamine (DFO) exposure. C17.2 cells were treated with 250 μM DFO for 12 hours, fixed with 4% paraformaldehyde, and immunocytochemical detection of BNIP3 (red), pyruvate dehydrogenase (PDH, green), and bisbenzimide (Bis, blue) was performed. Confocal analysis revealed partial BNIP3 and PDH colocalization (arrowheads) following DFO exposure compared to untreated (UT). Scale bar =10μm.
BNIP3 regulates hypoxia-induced neural precursor cell death
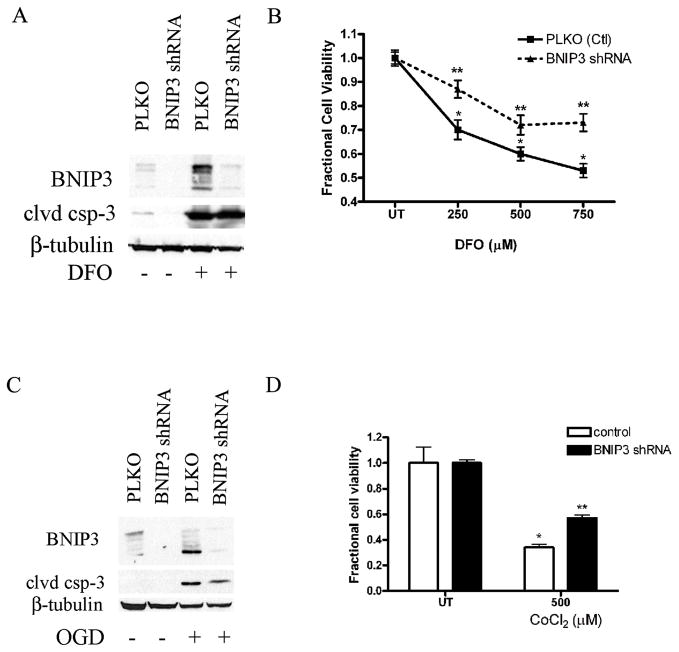
To determine the role of BNIP3 in hypoxia-induced NPC death, we generated lentiviruses for shRNA targeting BNIP3. C17.2 cells and FGF2-expanded NPCs express only low levels of BNIP3. To assess BNIP3 knockdown, we treated C17.2 cells transduced with either a PLKO empty vector or BNIP3 shRNA with DFO or OGD and observed BNIP3 protein levels. BNIP3 protein levels were significantly decreased in C17.2 cells transduced with the BNIP3 shRNA compared to the untreated, DFO- and OGD-treated C17.2 cells (Fig. 7A, C). To investigate whether BNIP3 expression is important for hypoxia-induced NPC death, both PLKO control and BNIP3 shRNA transduced C17.2 cells were plated and treated with DFO (250–750 μM) or 500 μM CoCl2. BNIP3 knockdowns exhibited significant protection against DFO- and CoCl2-induced NPC death compared to PLKO controls (Fig. 7B, D). Whole cell lysates were prepared from transduced cells treated with DFO for 24 hours or 6 hours OGD and cleaved caspase-3 was assessed by Western blot analysis. Similar to previous reports using non-neuronal cells, DFO-and OGD-induced caspase activation was not prevented by BNIP3 knockdown (Fig. 7A, C) (29).
Figure 7.
Knockdown of BNIP3 protects against hypoxia-induced death. (A) C17.2 cells infected with a lentivirus containing BNIP3 shRNA caused a decrease in BNIP3 protein levels compared to the empty vector control (PLKO). Western blot analysis with BNIP3 and β-tubulin as the loading control were performed after DFO treatment for 24 hours. Lysates from DFO-treated BNIP3 shRNA cells exhibited robust cleaved caspase-3 protein (clvd csp-3) levels similar to lysates from control treated cells. (B) C17.2 cells transduced with BNIP3 shRNA exhibited significantly attenuated DFO-induced death at concentrations between 250 and 750 μM compared to the empty vector control. (C) Whole cell lysates from C17.2 cells containing BNIP3 shRNA or PLKO were subjected to OGD and BNIP3 and cleaved caspase-3 protein levels were assessed. BNIP3 knockdown attenuated OGD-induced BNIP3 accumulation but not cleaved caspase-3. (D) C17.2 cells transduced with BNIP3 shRNA significantly attenuated CoCl2-induced death at 500 μM compared to empty vector treated cells. Data points for panels B and D represent mean ± SEM, with n = 6. *p < 0.01 by two-way ANOVA/Bonferroni post hoc test vs. both PLKO treated or **p < 0.01 by two-way ANOVA/Bonferroni post hoc test vs. BNIP3 knockdown-treated.
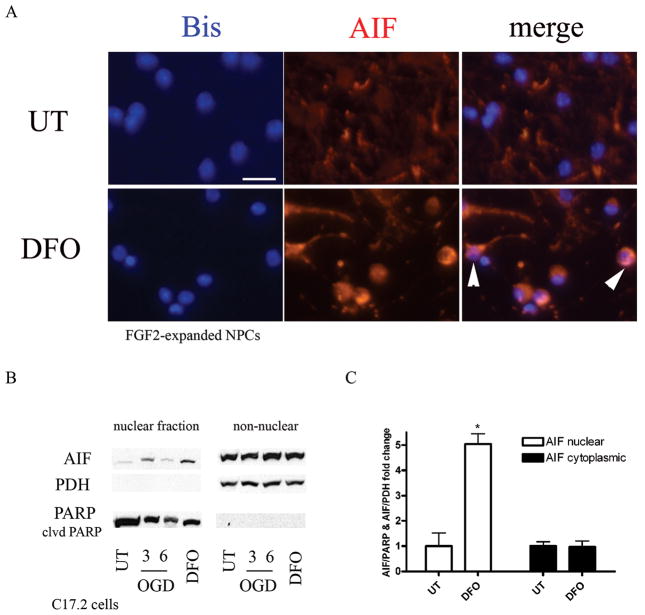
To investigate the potential mechanism of BNIP3-dependent, caspase-independent cell death in response to hypoxia, we performed immunocytochemical analysis for AIF after DFO treatment. AIF regulates caspase-independent apoptosis in a variety of cell death models (30). Under normal conditions, AIF is localized to the mitochondria; however, previous studies have shown that hypoxia induces AIF translocation from the mitochondria to the nucleus to initiate cell death. FGF2-expanded NPCs treated with DFO for 24 hours showed both perinuclear and nuclear AIF localization in contrast to its mitochondrial localization in untreated cells (Fig. 8A). Western blot analysis performed on nuclear and cytoplasmic fractions from wild type and 24-hour DFO-treated C17.2 cells showed that C17.2 cells treated with DFO had a significant increase in AIF in the nuclear fraction compared to untreated controls (Fig. 8B). AIF levels in the cytoplasmic fraction contained similar AIF levels in both wild type controls and DFO-treated cells.
Figure 8.
Hypoxia leads to increased nuclear apoptosis inducing factor (AIF). (A) fibroblast growth factor 2 (FGF2-expanded neural precursor cells (NPC) were treated with 250 μM desferrioxamine (DFO) for 24 hours, fixed with 4% paraformaldehyde, and immunostained for AIF (red) and bisbenzimide (blue). DFO exposure caused AIF translocation from the cytoplasm to the nucleus (white arrowheads). Scale bar = 20 μm. (B) C17.2 cells were subjected to oxygen glucose deprivation (OGD) (3–6 hours) and 250 μM DFO (24 hours) followed by nuclear and cytoplasmic fractionation to assess AIF translocation to the nucleus. Western blot analysis revealed an increase in AIF levels in the nucleus following 3-hour OGD and 24-hour DFO treatment compared to untreated (UT) controls. Pyruvate dehydrogenase (PDH) was used as a cytoplasmic control and poly (ADP-ribose) polymerase (PARP) as a nuclear control. AIF/PARP or AIF/PDH pixel totals were calculated and data points were expressed as fold change. Data points for B represent mean ± SEM, with n = 3. *p < 0.01 by one-way ANOVA/Bonferroni post hoc test versus untreated controls.
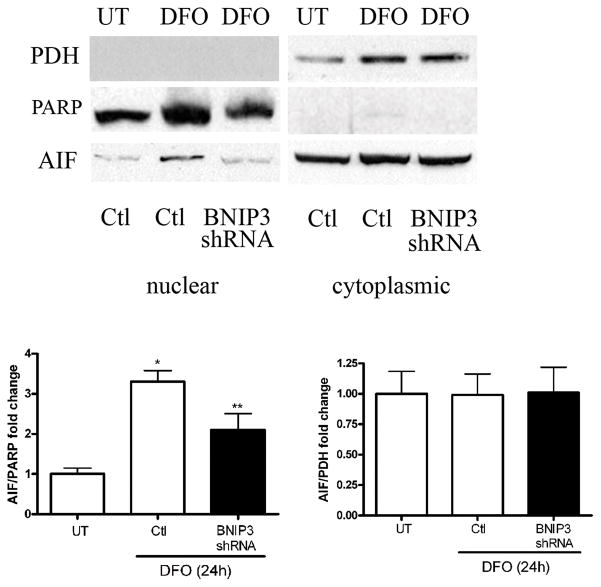
To explore the caspase-independent death pathway further, we tested the hypothesis that BNIP3 is important for AIF translocation from the mitochondria to the nucleus. C17.2 cells with either empty vector or BNIP3 shRNA were treated with DFO for 24 hours and cytoplasmic and nuclear fractions were obtained. Western blot analysis revealed that AIF protein levels were significantly decreased in BNIP3 knockdown nuclear lysates compared to control-treated cells while cytoplasmic AIF protein levels were unaltered (Fig. 9). These results suggest that under hypoxic conditions BNIP3 stimulates NPC death by promoting AIF release from the mitochondria.
Figure 9.
BNIP3 knockdown attenuates desferrioxamine (DFO)-induced apoptosis inducting factor (AIF) translocation to the nucleus. Control C17.2 cells or BNIP3 knockdown cells were treated with 250 μM DFO for 24 hours followed by nuclear and cytoplasmic fractionation. Western blot analysis for poly (ADP-ribose) polymerase (PARP) (nuclear marker), pyruvate dehydrogenase (PDH) (cytoplasmic marker), and AIF was performed. BNIP3 knockdown cells significantly attenuated DFO-induced AIF translocation from the mitochondria to the nucleus compared to control treated cells. AIF levels in the cytoplasmic fraction remained unchanged between control and knockdown cells. AIF/PARP and AIF/PDH western blots were scanned, pixel totals were calculated and data points expressed as fold change. Data points represent mean ± SEM, with n = 3. *p < 0.01 by 2-way ANOVA/Bonferroni post hoc test vs. treated controls and **p < 0.01 by 2-way ANOVA/Bonferroni post hoc test vs. treated BNIP3 knockdowns.
DISCUSSION
Perinatal HI in humans is a frequent cause of cerebral palsy and recent studies using rodent models of neonatal HI have shown that this stimulus causes significant NPC death (1, 31). In this study, we found that hypoxia-mimetics and OGD activated both caspase-dependent and independent NPC death pathways involving the Bcl-2 family members Bax, Bak, and BNIP3. Both OGD and hypoxia-mimetics caused an increase in cleaved caspase-3 that was significantly reduced by Bax/Bak deficiency or protein synthesis inhibition. In addition, we found that both OGD and hypoxia-mimetics increased BNIP3 and HIF1α levels. By testing neural stem cells with BNIP3 knockdown, we showed that BNIP3 was involved in DFO- and OGD-induced death but not caspase activation. Desferrioxamine treatment also led to an increase in nuclear AIF, suggesting that BNIP3 causes HI-induced NPC death by localizing to the mitochondria and promoting AIF release and nuclear translocation. In total, our results indicate that hypoxia activates both the intrinsic apoptotic death pathway and a second caspase-independent death pathway involving BNIP3.
Although multiple transcription factors have been implicated in the regulation of hypoxia-induced death in various cell types, little is known about the upstream regulators of hypoxia-induced death in NPCs. NPCs exposed to hypoxia-mimetics exhibited upregulation of HIF1α mRNA and protein levels. HIF1α is an established regulator of BNIP3 that binds to the BNIP3 promoter; we found a significant increase in NPC BNIP3 protein levels following hypoxia (24). In a recent study, transglutaminase-2 attenuated OGD-induced BNIP3 activation by interacting with HIF1β, thus preventing HIF1α and β dimerization (23). Together with our results, these findings suggest that HIF1α and β promote hypoxia-induced NPC death and caspase activation via transcription of pro-apoptotic genes such as BNIP3.
Mitochondria membrane integration of pro-apoptotic Bcl-2 family members such as Bax and Bak induces mitochondrial dysfunction and plays an important role in caspase activation and cell death (14, 32). Our results revealed that DFO-induced caspase activation was virtually eliminated and cell death reduced significantly by dual Bax/Bak deficiency (Fig. 4A, B). Conversely, we identified the BH3 only pro-apoptotic protein, BNIP3, as an important mediator of DFO-induced NPC death, but not caspase activation. These results suggest that hypoxia activates both caspase-dependent and –independent death pathways in NPCs. Previous studies in cancer cells showed BNIP3 induced cell death by promoting Bax translocation to the mitochondria and activating Bax and Bak (33, 34). BNIP3 has been shown to interact with Bcl-2 and Bcl-XL, suggesting that BNIP3 can activate Bax and Bak via an indirect mechanism (35). Our studies revealed mitochondrial BNIP3 localization after hypoxia but unlike Bax/Bak double-deficient NPCs, which showed minimal hypoxia-induced caspase-3 activation, BNIP3 was not required for caspase activation. These results indicate that BNIP3 is an important regulator of hypoxia-induced NPC death but not a critical regulator of Bax/Bak-dependent caspase activation in NPCs.
Our studies suggest that BNIP3 regulates DFO-induced caspase-independent NPC death by affecting the translocation of AIF from the mitochondria to the nucleus. Recent studies have shown that BNIP3-deficient mice subjected to myocardial ischemia/reperfusion have decreased infarct sizes compared to those of wild type mice (36, 37). In addition, harlequin mice carrying an AIF mutation rendering it approximately 60% inactive contained smaller brain infarct volumes compared to wild type mice after HI exposure (30, 38). Consistent with the results of our studies, the harlequin mutation did not prevent HI-induced cytochrome C release or caspase activation. These findings suggest that hypoxia initiates 2 parallel death pathways in vivo: one that involves a caspase-independent death that is regulated by AIF and BNIP3 and a second caspase-dependent signaling cascade involving Bax and Bak.
In total, our studies indicate that hypoxia causes activation of multiple pro-death pathways in NPCs. One such pathway involves the Bax/Bak-dependent intrinsic apoptotic death program and caspase-3 activation whereas a second pathway consists of HIF-induced BNIP3 expression and subsequent AIF translocation from mitochondria to the nucleus to trigger caspase-independent cell death. These findings illustrate the dynamic interplay between cell death pathways and further highlight the stimulus-specific nature of NPC death regulation.
Acknowledgments
We wish to thank UAB Neuroscience Core Facilities (NS47466 and NS57098) and the UAB Civitan International Research Center (KCW) for additional support. We also thank Shawn Williams and Ms. Cecelia Latham for technical assistance, Ms. Angela Schmeckebier for manuscript preparation, and Dr. John Shacka for critical review of this manuscript. The C17.2 cell line was generously provided by Dr. Evan Snyder (Burnham Institute).
This work was supported by grants from the National Institutes of Health (NS35107 and NS41962) and UAB Core Facilities (NS47466 and NS57098).
References
- 1.Romanko MJ, Zhu C, Bahr BA, et al. Death effector activation in the subventricular zone subsequent to perinatal hypoxia/ischemia. J Neurochem. 2007;103:1121–31. doi: 10.1111/j.1471-4159.2007.04820.x. [DOI] [PubMed] [Google Scholar]
- 2.An WG, Kanekal M, Simon MC, et al. Stabilization of wild-type p53 by hypoxia-inducible factor 1alpha. Nature. 1998;392:405–8. doi: 10.1038/32925. [DOI] [PubMed] [Google Scholar]
- 3.Epstein AC, Gleadle JM, McNeill LA, et al. C. elegans EGL-9 and mammalian homologs define a family of dioxygenases that regulate HIF by prolyl hydroxylation. Cell. 2001;107:43–54. doi: 10.1016/s0092-8674(01)00507-4. [DOI] [PubMed] [Google Scholar]
- 4.Jaakkola P, Mole DR, Tian YM, et al. Targeting of HIF-alpha to the von Hippel-Lindau ubiquitylation complex by O2-regulated prolyl hydroxylation. Science. 2001;292:468–72. doi: 10.1126/science.1059796. [DOI] [PubMed] [Google Scholar]
- 5.Ivan M, Kondo K, Yang H, et al. HIF-α targeted for VHL-mediated destruction by proline hydroxylation: implications for O2 sensing. Science. 2001;292:464–8. doi: 10.1126/science.1059817. [DOI] [PubMed] [Google Scholar]
- 6.Berra E, Roux D, Richard DE, et al. Hypoxia-inducible factor-1 alpha (HIF-1 alpha) escapes O(2)-driven proteasomal degradation irrespective of its subcellular localization: nucleus or cytoplasm. EMBO Rep. 2001;2:615–20. doi: 10.1093/embo-reports/kve130. [DOI] [PMC free article] [PubMed] [Google Scholar]
- 7.Richard DE, Berra E, Gothie E, et al. p42/p44 mitogen-activated protein kinases phosphorylate hypoxia-inducible factor 1alpha (HIF-1α) and enhance the transcriptional activity of HIF-1. J Biol Chem. 1999;274:32631–7. doi: 10.1074/jbc.274.46.32631. [DOI] [PubMed] [Google Scholar]
- 8.Berra E, Richard DE, Gothie E, et al. HIF-1-dependent transcriptional activity is required for oxygen-mediated HIF-1α degradation. FEBS Lett. 2001;491:85–90. doi: 10.1016/s0014-5793(01)02159-7. [DOI] [PubMed] [Google Scholar]
- 9.Hirsila M, Koivunen P, Xu L, et al. Effect of desferrioxamine and metals on the hydroxylases in the oxygen sensing pathway. FASEB J. 2005;19:1308–10. doi: 10.1096/fj.04-3399fje. [DOI] [PubMed] [Google Scholar]
- 10.Guo M, Song LP, Jiang Y, et al. Hypoxia-mimetic agents desferrioxamine and cobalt chloride induce leukemic cell apoptosis through different hypoxia-inducible factor-1alpha independent mechanisms. Apoptosis. 2006;11:67–77. doi: 10.1007/s10495-005-3085-3. [DOI] [PubMed] [Google Scholar]
- 11.Clarke PG. Developmental cell death: Morphological diversity and multiple mechanisms. Anat Embryol (Berl) 1990;181:195–213. doi: 10.1007/BF00174615. [DOI] [PubMed] [Google Scholar]
- 12.Akhtar RS, Ness JM, Roth KA. Bcl-2 family regulation of neuronal development and neurodegeneration. Biochim Biophys Acta. 2004;1644:189–203. doi: 10.1016/j.bbamcr.2003.10.013. [DOI] [PubMed] [Google Scholar]
- 13.Azad MB, Chen Y, Henson ES, et al. Hypoxia induces autophagic cell death in apoptosis-competent cells through a mechanism involving BNIP3. Autophagy. 2008;4:195–204. doi: 10.4161/auto.5278. [DOI] [PMC free article] [PubMed] [Google Scholar]
- 14.Vande VC, Cizeau J, Dubik D, et al. BNIP3 and genetic control of necrosis-like cell death through the mitochondrial permeability transition pore. Mol Cell Biol. 2000;20:5454–68. doi: 10.1128/mcb.20.15.5454-5468.2000. [DOI] [PMC free article] [PubMed] [Google Scholar]
- 15.Kanzawa T, Zhang L, Xiao L, et al. Arsenic trioxide induces autophagic cell death in malignant glioma cells by upregulation of mitochondrial cell death protein BNIP3. Oncogene. 2005;24:980–91. doi: 10.1038/sj.onc.1208095. [DOI] [PubMed] [Google Scholar]
- 16.Zhang L, Li L, Liu H, et al. HIF-1alpha activation by a redox-sensitive pathway mediates cyanide-induced BNIP3 upregulation and mitochondrial-dependent cell death. Free Radic Biol Med. 2007;43:117–27. doi: 10.1016/j.freeradbiomed.2007.04.005. [DOI] [PMC free article] [PubMed] [Google Scholar]
- 17.Daido S, Kanzawa T, Yamamoto A, et al. Pivotal role of the cell death factor BNIP3 in ceramide-induced autophagic cell death in malignant glioma cells. Cancer Res. 2004;64:4286–93. doi: 10.1158/0008-5472.CAN-03-3084. [DOI] [PubMed] [Google Scholar]
- 18.Pattingre S, Tassa A, Qu X, et al. Bcl-2 antiapoptotic proteins inhibit Beclin 1-dependent autophagy. Cell. 2005;122:927–39. doi: 10.1016/j.cell.2005.07.002. [DOI] [PubMed] [Google Scholar]
- 19.Zhang H, Bosch-Marce M, Shimoda LA, et al. Mitochondrial autophagy is an HIF-1-dependent adaptive metabolic response to hypoxia. J Biol Chem. 2008;283:10892–903. doi: 10.1074/jbc.M800102200. [DOI] [PMC free article] [PubMed] [Google Scholar] [Retracted]
- 20.Knudson CM, Tung KS, Tourtellotte WG, et al. Bax-deficient mice with lymphoid hyperplasia and male germ cell death. Science. 1995;270:96–9. doi: 10.1126/science.270.5233.96. [DOI] [PubMed] [Google Scholar]
- 21.Geng Y, Akhtar RS, Shacka JJ, et al. p53 transcription-dependent and -independent regulation of cerebellar neural precursor cell apoptosis. J Neuropathol Exp Neurol. 2007;66:66–74. doi: 10.1097/nen.0b013e31802d4ab4. [DOI] [PubMed] [Google Scholar]
- 22.Snyder EY, Deitcher DL, Walsh C, et al. Multipotent neural cell lines can engraft and participate in development of mouse cerebellum. Cell. 1992;10(68):33–51. doi: 10.1016/0092-8674(92)90204-p. [DOI] [PubMed] [Google Scholar]
- 23.Filiano AJ, Bailey CD, Tucholski J, et al. Transglutaminase 2 protects against ischemic insult, interacts with HIF1β, and attenuates HIF1 signaling. FASEB J. 2008;22:2662–75. doi: 10.1096/fj.07-097709. [DOI] [PMC free article] [PubMed] [Google Scholar]
- 24.Tracy K, Dibling BC, Spike BT, et al. BNIP3 is an RB/E2F target gene required for hypoxia-induced autophagy. Mol Cell Biol. 2007;27:6229–42. doi: 10.1128/MCB.02246-06. [DOI] [PMC free article] [PubMed] [Google Scholar]
- 25.Akhtar RS, Geng Y, Klocke BJ, et al. Neural precursor cells possess multiple p53-dependent apoptotic pathways. Cell Death Differ. 2006;13:1727–39. doi: 10.1038/sj.cdd.4401879. [DOI] [PubMed] [Google Scholar]
- 26.Chen G, Cizeau J, Vande VC, et al. Nix and Nip3 form a subfamily of pro-apoptotic mitochondrial proteins. J Biol Chem. 1999;274:7–10. doi: 10.1074/jbc.274.1.7. [DOI] [PubMed] [Google Scholar]
- 27.Fei P, Wang W, Kim SH, et al. Bnip3L is induced by p53 under hypoxia, and its knockdown promotes tumor growth. Cancer Cell. 2004;6:597–609. doi: 10.1016/j.ccr.2004.10.012. [DOI] [PubMed] [Google Scholar]
- 28.Zhang Z, Yang X, Zhang S, et al. BNIP3 upregulation and EndoG translocation in delayed neuronal death in stroke and in hypoxia. Stroke. 2007;38:1606–13. doi: 10.1161/STROKEAHA.106.475129. [DOI] [PubMed] [Google Scholar]
- 29.Tracy K, Macleod KF. Regulation of mitochondrial integrity, autophagy and cell survival by BNIP3. Autophagy. 2007;3:616–9. doi: 10.4161/auto.4892. [DOI] [PMC free article] [PubMed] [Google Scholar]
- 30.Zhu C, Wang X, Huang Z, et al. Apoptosis-inducing factor is a major contributor to neuronal loss induced by neonatal cerebral hypoxia-ischemia. Cell Death Differ. 2007;14:775–84. doi: 10.1038/sj.cdd.4402053. [DOI] [PubMed] [Google Scholar]
- 31.Brazel CY, Nunez JL, Yang Z, et al. Glutamate enhances survival and proliferation of neural progenitors derived from the subventricular zone. Neuroscience. 2005;131:55–65. doi: 10.1016/j.neuroscience.2004.10.038. [DOI] [PubMed] [Google Scholar]
- 32.Chipuk JE, Kuwana T, Bouchier-Hayes L, et al. Direct activation of Bax by p53 mediates mitochondrial membrane permeabilization and apoptosis. Science. 2004;303:1010–4. doi: 10.1126/science.1092734. [DOI] [PubMed] [Google Scholar]
- 33.Kubli DA, Quinsay MN, Huang C, et al. Bnip3 functions as a mitochondrial sensor of oxidative stress during myocardial ischemia and reperfusion. Am J Physiol Heart Circ Physiol. 2008;295:H2025–H2031. doi: 10.1152/ajpheart.00552.2008. [DOI] [PMC free article] [PubMed] [Google Scholar]
- 34.Kubli DA, Ycaza JE, Gustafsson AB. Bnip3 mediates mitochondrial dysfunction and cell death through Bax and Bak. Biochem J. 2007;405:407–15. doi: 10.1042/BJ20070319. [DOI] [PMC free article] [PubMed] [Google Scholar]
- 35.Ray R, Chen G, Vande VC, et al. BNIP3 heterodimerizes with Bcl-2/Bcl-X(L) and induces cell death independent of a Bcl-2 homology 3 (BH3) domain at both mitochondrial and nonmitochondrial sites. J Biol Chem. 2000;14(275):1439–48. doi: 10.1074/jbc.275.2.1439. [DOI] [PubMed] [Google Scholar]
- 36.Diwan A, Krenz M, Syed FM, et al. Inhibition of ischemic cardiomyocyte apoptosis through targeted ablation of Bnip3 restrains postinfarction remodeling in mice. J Clin Invest. 2007;117:2825–33. doi: 10.1172/JCI32490. [DOI] [PMC free article] [PubMed] [Google Scholar]
- 37.Hochhauser E, Cheporko Y, Yasovich N, et al. Bax deficiency reduces infarct size and improves long-term function after myocardial infarction. Cell Biochem Biophys. 2007;47:11–20. doi: 10.1385/cbb:47:1:11. [DOI] [PubMed] [Google Scholar]
- 38.Zhu C, Wang X, Deinum J, et al. Cyclophilin A participates in the nuclear translocation of apoptosis-inducing factor in neurons after cerebral hypoxia-ischemia. J Exp Med. 2007;204:1741–8. doi: 10.1084/jem.20070193. [DOI] [PMC free article] [PubMed] [Google Scholar]


