Abstract
We previously studied a 16-amino acid-residue fragment of the C-terminal β-hairpin (residues 46–61), [IG(46–61)], of the B3 domain of the immunoglobulin binding protein G from Streptoccocus, and found that hydrophobic interactions and the turn region play an important role in stabilizing the structure. Based on these results, we carried out systematic structural studies of peptides derived from the sequence of IG(46–61) by systematically shortening the peptide by one residue at a time from both the C and the N terminus. To determine the structure and stability of two resulting 12- and 14-amino acid residue peptides, IG(48–59) and IG(47–60), respectively, we carried out CD, NMR and calorimetric studies of these peptides in pure water. Our results show that IG(48–59) possesses organized three-dimensional structure stabilized by hydrophobic interactions (Tyr50 – Phe57 and Trp48 – Val59) at T = 283 and 305 K. At T = 313 K, the structure breaks down because of increased chain entropy, but the turn region is preserved in the same position observed for the structure of the whole protein. The breakdown of structure occurs near the melting temperature of this peptide (Tm = 310 K) measured by Differential Scanning Calorimetry (DSC). The melting temperature of IG(47–60) determined by DSC is Tm = 330 K and its structure is similar to that of the native β-hairpin at all (lower) temperatures examined (283 – 313 K). Both of these truncated sequences are conserved in all known amino acid sequences of the B domains of the immunoglobulin binding protein G from bacteria. Thus, this study contributes to an understanding of the mechanism of folding of this whole family of proteins, and provides information about the mechanism of formation and stabilization of a β-hairpin structural element.
Keywords: peptide structure, β-hairpin, B3 domain of protein G, NMR, CD
INTRODUCTION
Acquisition of the mechanism of protein folding is one of the significant unsolved problems in molecular and structural biology. Hierarchical models of protein folding emphasize the importance of local interactions in restricting the conformational space of polypeptide chains in the search for the native state. These interactions between different parts of the sequence promote nuclei of structure leading to a cooperative rate-limiting step from which the native state emerges.1–7 Studies of short fragments of proteins provide information about local interactions isolated from the protein context and, therefore, indicate the importance of these interactions in determining the secondary structure elements of proteins. It has been shown that some short protein fragments can fold in aqueous solution into native-like conformations when no tertiary interactions are present.8,9 Thus, these fragments may play an important role as nucleation centers in initiating protein folding10–12 through local interactions, knowledge about which in the earliest events of protein folding is the most important and the least understood as yet.
For the last 40 years, many water-soluble peptides corresponding to α-helical fragments of proteins have been investigated extensively.13–20 On the other hand, because of their marginal stability and strong tendency to aggregate,21 it has usually been difficult to study β-hairpin fragments. The first reported β-hairpin peptide that was demonstrated to fold autonomously into the native-like hairpin in water was the 17 amino acid-residue fragment from the N-terminus of ubiquitin;9,22 however, this peptide adopts only ~20% of regular β-hairpin structure in water solution.9,22 Studies of other peptides, derived from tendamistat,23 the B1 domain of protein G,8,24 and ferredoxin,25 also showed that β-structured peptides could exist in the monomeric form without aggregating, but that, in most cases, they showed a very limited tendency to fold in the absence of tertiary contacts. Blanco et al.,8 studied the C-terminal 16-amino-acid-residue β-hairpin fragment from the B1 domain of protein G (PGB1), and showed the first example of native-like folding of this fragment in water. This peptide remained monomeric at high concentration.8 It was estimated that it adopts a population containing up to 40% native-like β-hairpin structure, and they, therefore, speculated that it would be the first folding initiation site of the protein that could provide a nucleation center to initiate the folding of the rest of the protein.8 On the other hand, the studies by Blanco et al. were carried out at very low temperature at which the structure is usually stabilized.26 Such results cannot directly identify the mechanism of folding of those proteins for which the folding temperatures are much higher (the folding temperature of the B domains of protein G is around 353 K).27,28
In this work, we present studies of two peptides corresponding to the C-terminal part of the B3 domain of protein G from Streptoccocus (strain G148)29 (Fig. 1), hereafter referred to as IG(48–59) (12 amino acid residues) and IG(47–60) (14 amino acid residues), respectively, where the numbers in parentheses denote the position of the first and the last residue, respectively, of the corresponding peptide in the B3 domain of protein G. This protein, as well as each B domain of protein G, possesses a compact fold, small size and very high thermal stability. These features make each of the B domains an ideal system for studying protein folding and stability.27,30–33 In our previous work,34 we showed that the 16-amino-acid-residue fragment, corresponding to the C-terminal β-hairpin of the B3 domain of the immunoglobulin binding protein G from Streptoccocus, resembled the general shape of a β-hairpin structure observed for this peptide in the structure of the whole protein, at all temperatures investigated. However, we found that the structure was stabilized by hydrophobic interactions between side chains and not by the hydrogen bonds suggested in previous studies.8,35
Fig. 1.
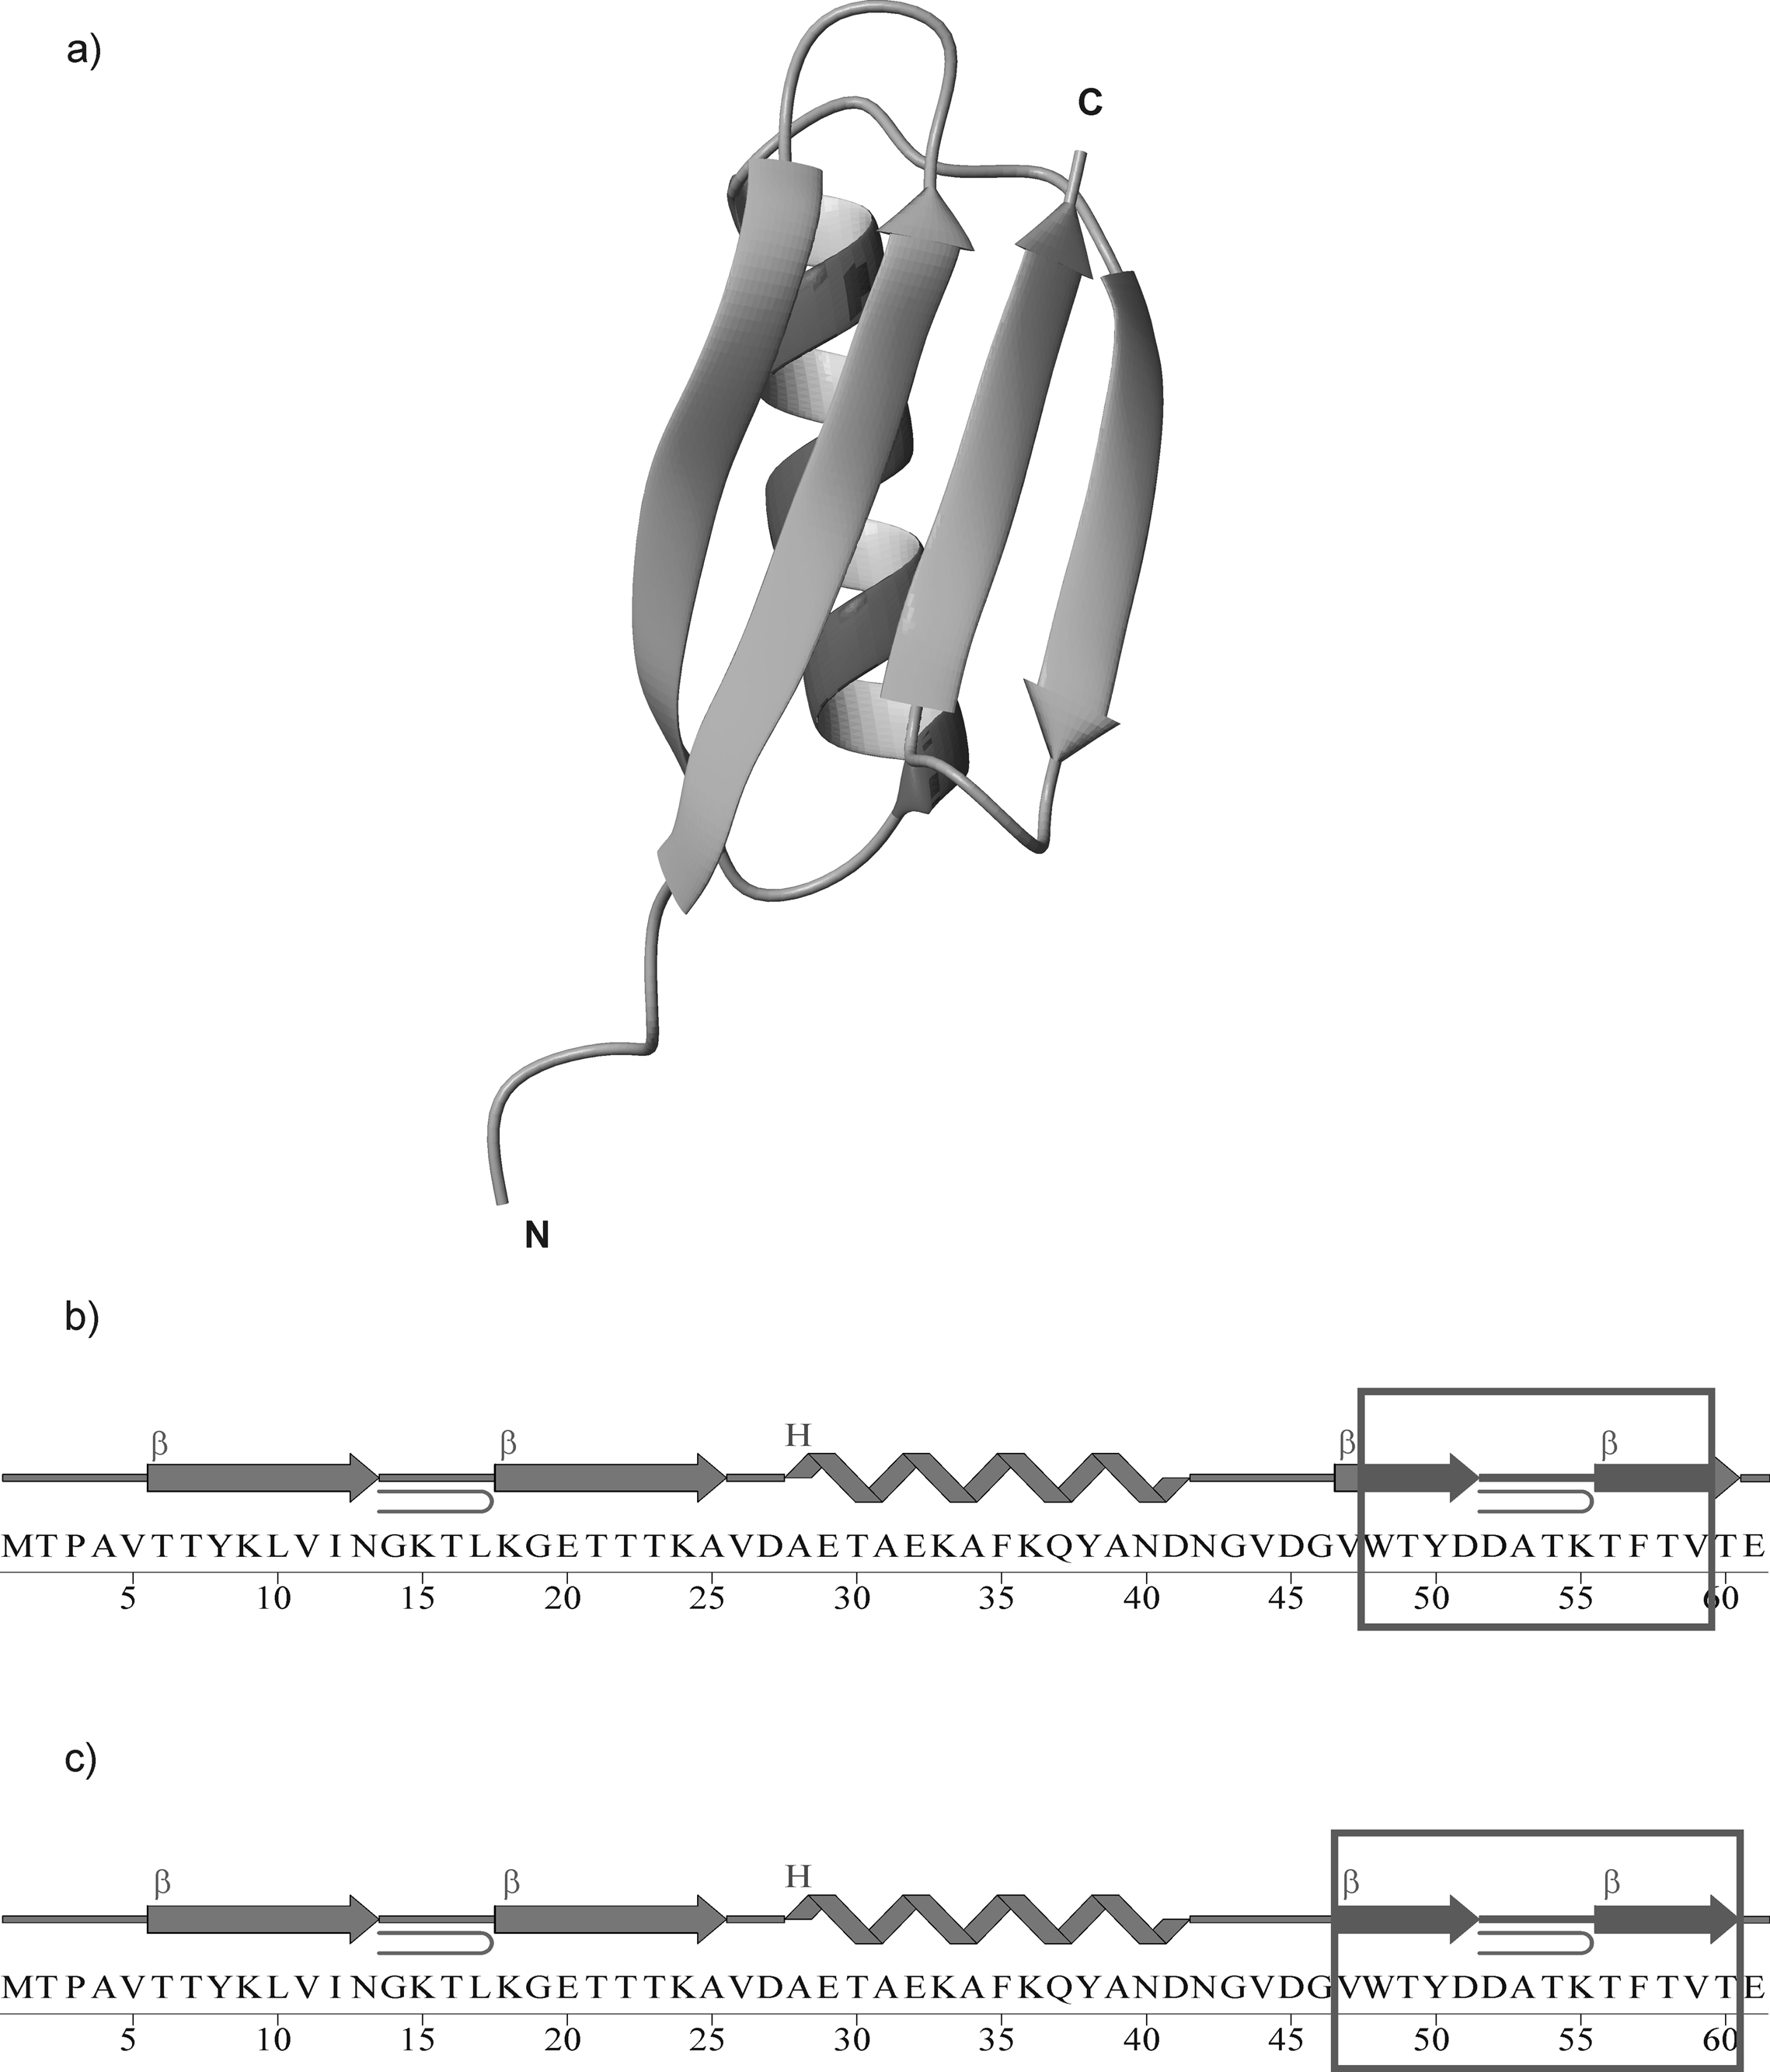
X-ray structure29 of the B3 domain of protein G (PDB nomenclature: 1IGD) (a); Amino acid sequence of 1IGD, where the boxed fragments, IG(48–59) (b), and IG(47–60) (c), were synthesized and examined. In (b) and (c), β and H denote strand and helix, respectively.
The 16-amino acid-residue fragment also exhibited very high thermal stability with a melting temperature of about 320 K, determined from DSC measurements34. Based on these studies, we decided to synthesize and investigate two shorter peptides derived from the C-terminal β-hairpin of the immunoglobulin binding protein G from Streptoccocus (Fig. 1). We used shorter peptides than those investigated so far8,34 because these shorter sequences are identical for all B domains of the immunoglobulin binding protein G from bacteria.28 Thus, our studies can be useful for understanding the folding mechanism of the whole family of proteins.
Previous conformational studies of several 16-residue peptides, whose amino acid sequences are based on the C-terminal β-hairpin of the immunoglobulin binding protein G, show the importance of terminal residues in structure stabilization, mainly by electrostatic interactions.36,37 On the other hand, in sequences of naturally occurring proteins of the IGG family as well as designed proteins with the IGG fold, large numbers of mutations are observed at residues 45–47 and at the C-terminus; these regions correspond to the N- and the C-terminal regions of IG(47–60), while IG(48–59) is devoid of these residues. This indicates that the end residues of the β-hairpin part of the protein are not essential for stabilizing its structure.28,38–40
To the best of our knowledge, studies of protein peptide fragments carried out so far are restricted only to peptides that match some structural elements observed in the native state (β-hairpins or α-helices) of ubiquitin9,22, protein G B1 domain8,23,24 and ferredoxin.25 Such an approach always raises a question as to whether the peptide sequences studied are minimal sequences, which can fold autonomously. Our study is the first attempt to determine the shortest possible fragment of a protein that can fold autonomously into a structure which resembles that in the native protein. Such studies can define the composition and the structure of nucleation sites of the sequence at the very early stages of the folding processes. Moreover, these studies will eventually enable us to define the nature of the physical forces responsible for the formation and stabilization of nucleaction sites, which can lead to an understanding of protein folding and misfolding processes. An additional motivation of these studies is that they provide experimental information about the early stages of the protein-folding mechanism. Such data are extremely valuable in our work on the parameterization of our coarse-grained united-residue (UNRES) force field for mesoscopic dynamics simulations of folding, structure, and thermodynamics of proteins.41,42 To parameterize UNRES, we developed a hierarchical-optimization method in which the conformational space of each selected training protein is partitioned into levels, each corresponding to a given stage of folding (which is considered here as a quasi-static process corresponding to gradual removal of denaturating conditions; e.g., decreasing temperature); we parameterize the force field to reproduce the experimental temperature dependence of the free energy of each of these stages. Both qualitative (sequence of folding events) and quantitative (free energies) experimental information is needed to execute the parameterization procedure.42
MATERIALS AND METHODS
Peptide synthesis
The peptides Ac-WTYDDATKTFTV-NH2 [IG(48–59); 12 amino acid residues] and Ac-VWTYDDATKTFTVT-NH2 [IG(47–60); 14 amino acid residues] were synthesized by standard solid-phase Fmoc-amino acid chemistry with a Milipore synthesizer. Both resins Tentagel R RAM (1g, capacity 0.19 mmol/g) were treated with piperidine (20%) in DMF, and all amino acids were coupled using DIPCI/HOBt methodology. The coupling reaction time was 2 h. Piperidine (20%) in DMF was used to remove the Fmoc group at all steps. After deprotection of the last Fmoc N-terminal group, each of the resins was washed with methanol and dried in vacuo. Then the resins were treated with 1 M 1-acetylimidazole in DMF at room temperature for 2 h to attach the acetyl group to the N-terminal part of the peptide. In the final step, the resins were treated with a TFA/water/phenol/triisopropylsilane (8.8/0.5/0.5/0.2) mixture (10 ml per gram of resin) at room temperature for 2 h to remove the peptide from the resin. Each of the resins was separated from the mother liquid; the excess of solvent was then evaporated to a volume of 2 ml, and the residue was precipitated with diethyl ether. Each of the crude peptides was dissolved in 19% CH3CN in TEA/H3PO4 and purified by reverse-phase HPLC using a Kromasil C8 semi-preparative column (20 × 250 mm, 5 µm) with 16 ml/min elution and a 120 min isocratic mixture of 19% CH3CN in TEA/H3PO4 to adjust the pH to approximately 7.0. To identify fractions containing the pure peptides, HPLC was run first with a small amount of the crude peptide and the absorbance at 222 nm was measured for each fraction. A plot of absorbance vs. retention time was constructed and the interval of the retention time to separate the pure peptide was estimated as that corresponding to the large peak in the plot. Subsequently, a semi-preparative HPLC run was carried out and the fractions containing the pure peptide were collected and lyophilized. The purity of each peptide was confirmed by analytical HPLC and MALDI-TOF analysis (M = 1489.5 g/mol, calculated 1489.57 g/mol, and M = 1688.9 g/mol, calculated 1688.85 g/mol for IG(48–59) and IG(47–60), respectively).
Circular dichroism (CD) spectroscopy
CD spectra were recorded on a Jasco J-815 spectropolarimeter with a 100 nm/min scan speed, and data were collected from 260 to 190 nm with a 1 mm path-length quartz cell. The samples were dissolved in water [the pH of IG(48–59) and IG(47–60) was 5.13 and 5.45, respectively], and the CD was measured at 16 different temperatures, i.e., at 5° intervals between 278 and 353 K. The final concentration of IG(48–59) and IG(47–60) was 0.010g/100 ml and 0.012g/100 ml, respectively. The secondary structure content was calculated from CD spectra using the CONTINLL method.43
Differential Scanning Calorimetry (DSC)
Calorimetric measurements were carried out with a VP-DSC microcalorimeter (MicroCal) at a scanning rate of 1.5 degree/minute. Scans were obtained at a protein concentration of 0.04 mM and 0.03 mM of IG(48–59) and IG(47–60), respectively. The cell volume was 0.5 ml. All scans were run at pH = 5.13 and 5.45 for IG(48–59) and IG(47–60), respectively, in pure water in the range of temperatures from 5 °C to 80 °C. The reversibility of the transition was checked by cooling and reheating the same sample. No histeresis of heat capacity was found in the repeated heating and cooling cycles and, moreover, no largely negative values of heat capacity were observed. This demonstrates that no irreversible processes such as, e.g., aggregation or hydrolysis, occurred during the thermal transition. The data presented for each compound are mean values from three independent measurements. Results from the DSC measurements were analyzed with the Origin 7.0 software from MicroCal using the software routines provided with the instrument.44
1H-NMR spectroscopy
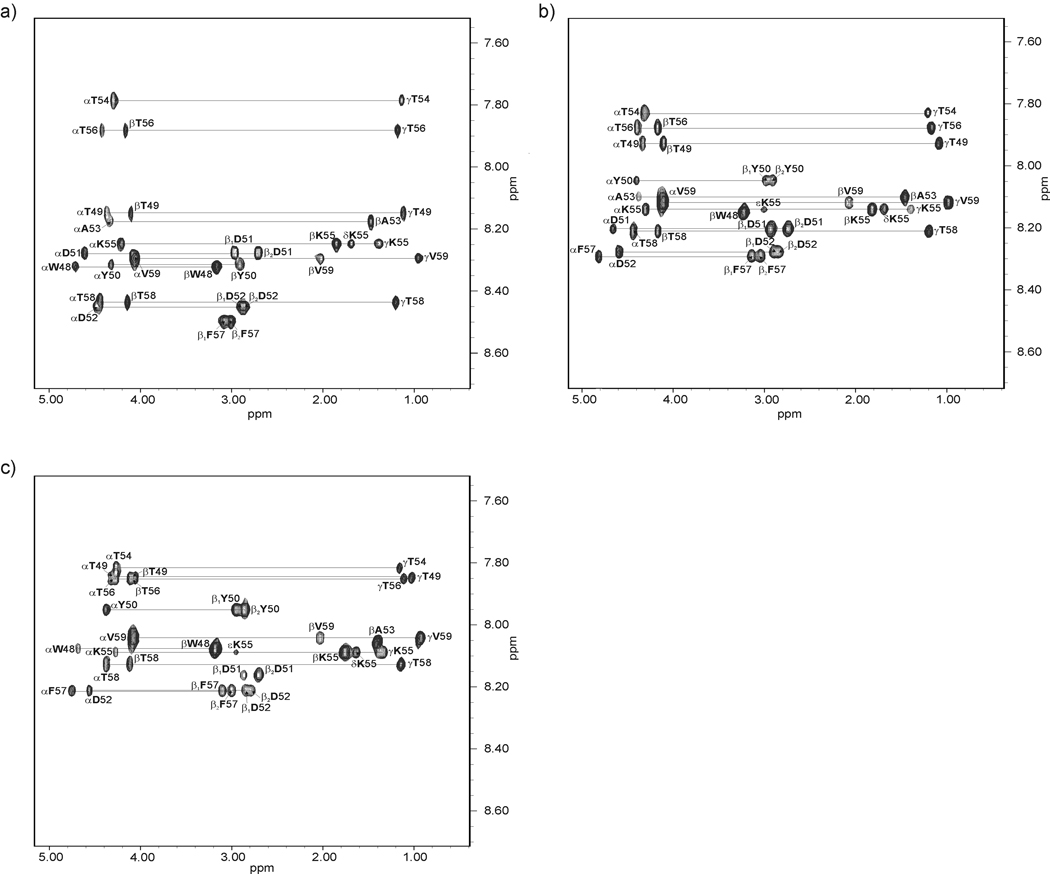
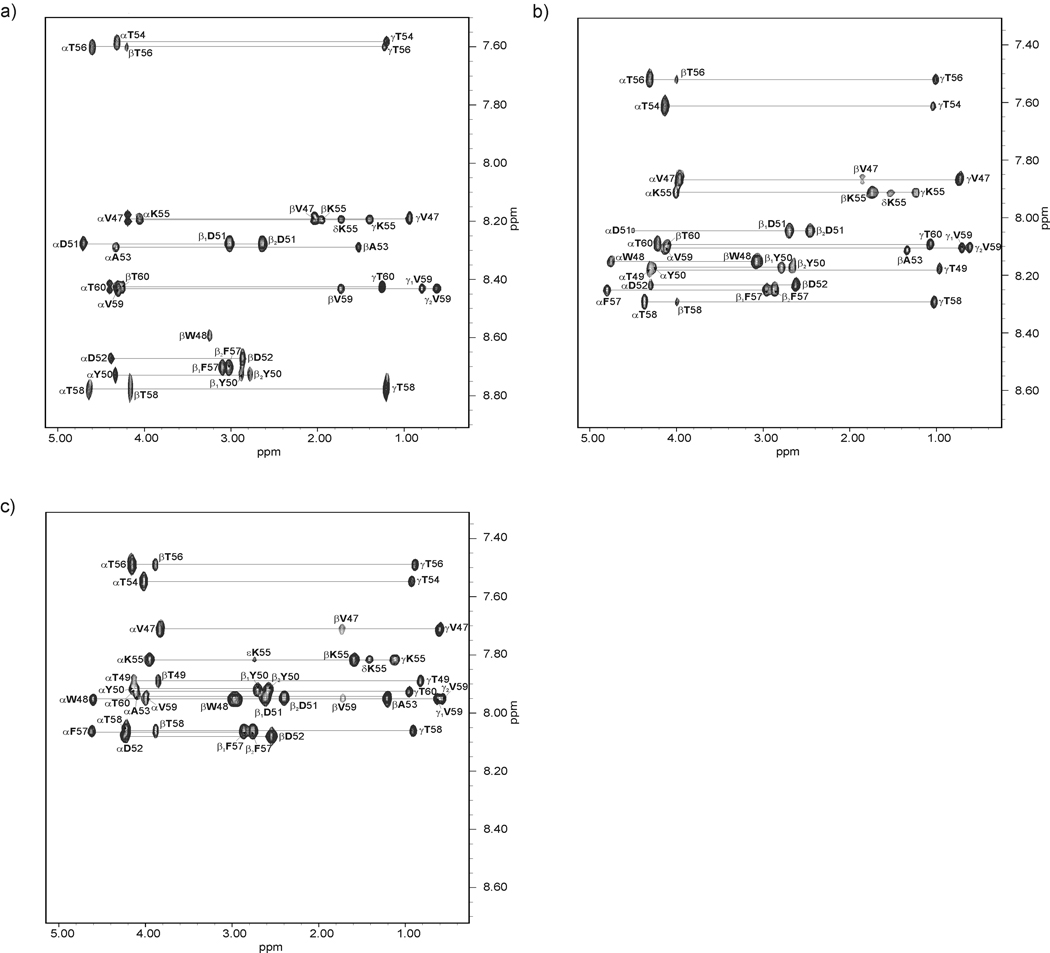
The NMR spectra of IG(48–59) and IG(47–60) were measured on VARIAN 500 MHz and 600 MHz spectrometers. The following spectra were recorded: 1D H-NMR (at 283, 289, 297, 305, 313 and 321 K) and 2D H-NMR: DQF-COSY,45 TOCSY46 (80 ms), ROESY47 (200 ms) at 283, 305 and 313 K. The samples were dissolved in H2O/2H2O (9:1 by vol.) [pH of IG(48–59) and IG(47–60) was 5.13 and 5.45, respectively] and the concentration of each of the samples was 3 mM. The spectra were processed using VARIAN 4.3 software (Varian Instruments, PaloAlto, CA, USA) and analyzed with the XEASY program.48 The spectra were calibrated against the DSS (sodium 4,4-dimethyl-4-silapentane-1-sulfonate) signal.49 Proton signals were assigned based on the TOCSY spectra. The sequential analysis of the peptide was confirmed by the ROESY spectra.47 The chemical shifts are reported in Tables I – VI in supplemental data. The coupling constants between NH and Hα protons (3JHNHα) of IG(48–59) and IG(47–60) were obtained from two-dimensional DQF-COSY and one-dimensional 1H spectra. The intensities of ROE signals were estimated from the ROESY spectra47. In Fig. 2 and Fig. 3, the TOCSY spectra, with peak assignments of IG(48–59) and IG(47–60), respectively, are shown.
Fig. 2.
Amino acid spin systems in the TOCSY spectra of IG(48–59) in H2O at pH = 5.13 (tm=80 ms; the diagnostic region) at (a) 283 K, (b) 305 K and (c) 313 K.
Fig. 3.
Amino acid spin systems in the TOCSY spectra of IG(47–60) in H2O at pH = 5.45 (tm=80 ms; the diagnostic region) at (a) 283 K, (b) 305 K and (c) 313 K.
Three-dimensional structure calculations
The ROE inter-proton cross-peaks of IG(48–59) and IG(47–60) were derived from 2D H-NMR ROESY spectra, and vicinal coupling constants 3JHNHα were obtained from 2D H-NMR DQF-COSY and temperature-dependent 1D H-NMR spectra. In the first step, the ROESY peak volumes were converted to upper distance bounds by using CALIBA50 of the DYANA package.51 In the next step, torsion angles, based on the Bystrov-Karplus52 equation, were generated using the HABAS algorithm of the DYANA package53. The upper distance limits and torsional angles were used as restraints in molecular dynamics calculations.
Molecular dynamics simulations with the time-averaged methodology (TAV)54–56 were carried out with the AMBER force field57 using the AMBER 8.0 package.56 The interproton distances were restrained with the force constant k = 20 kcal/(mol × Å2), and the dihedral angles with k = 2 kcal/(mol × deg2), respectively. The dihedral angles ω were restrained with a center at 180° and k = 10 kcal/(mol × deg2). The improper dihedral angles centered at the Cα atoms (defining the chirality of amino acid residues) were restrained with k = 50 kcal/(mol × deg2). Three sets of separate simulations, using the restraints from the NMR data collected at 283, 305 and 313 K, were run for both compounds. All simulations were carried out in a TIP3P58 periodic water box at constant volume, with the particle-mesh Ewald procedure for long-range electrostatic interactions.59,60 MD simulations with time-averaged restraints at these three different temperatures, were carried out with a time step of 2 fs,61 and the total duration of the run was 2 ns. Coordinates were saved every 2000 steps of MD simulations.
For every NMR restraint set, four independent TAV MD simulations were run at the following temperatures: N, 400, 500, 600 K (where N is the temperature of the NMR experiment (i.e., runs at 283K, 305K, and 313K), respectively, for three independent sets of calculations). The purpose of running simulations at many temperautres including elevated temperatures was to enhance sampling. From every trajectory, 300 final conformations were collected for the analysis of each compound. The structures from four trajectories, obtained from simulations performed using the same NMR restraint set, were combined together. After TAV MD simulations, we obtained three sets of 1200 conformation each (four runs, with 300 conformations from every run) corresponding to three NMR restraint sets recorded at different temperatures for IG(48–59) and IG(47–60), respectively. All three sets of conformations were clustered separately, with the use of the MOLMOL program.62 An RMS deviation cut-off of 5.0 Å was used in the clustering procedure. The clustering procedure provided five families of conformations for the IG(48–59) and IG(47–60) peptides. The four most populated families for IG(48–59) and five for IG(47–60) were selected for presentation. The RMS deviation was calculated based on the Cα atoms.
RESULTS AND DISCUSSION
Differential Scanning Calorimetry (DSC)
We began our investigation by performing DSC measurements of the two peptides. DSC experiments can provide information about two very important properties, namely thermal stability10 and possible aggregation of a protein or peptide.63 In previous studies, ultracentrifugation was used to detect possible aggregation;64 however most of such studies are limited to only one temperature and it is known that a temperature change can induce oligomerization/aggregation processes63. Ultracentrifugation can be conducted under a controlled temperature regime but, from a practical point of view, it is very difficult and time/sample consuming to perform a series of experiments using different temperatures. For practical purposes, the DSC experiment can detect oligomerization/aggregation processes in a wide range of temperatures, using a very small amount of an investigated compound, and can show if the process of aggregation/oligomerization is reversible with changes of temperature; also, a wide range of heating/cooling speed can be used to detect oligomerization/aggregation processes if the only interest is detection of such processes but not their thermodynamic/kinetic effects.63
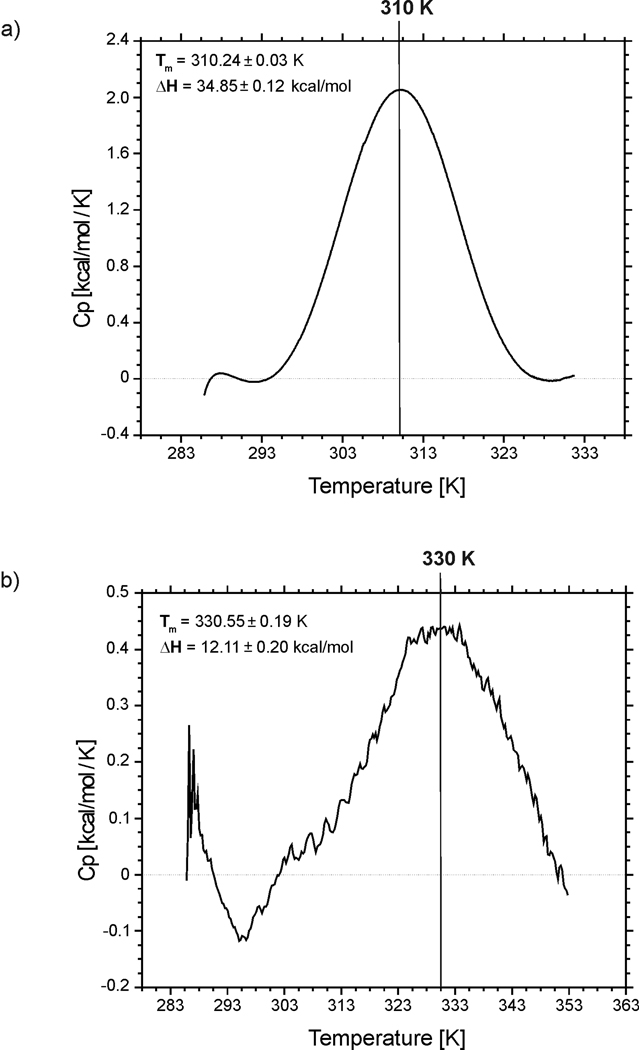
The heat capacity curves for the two peptides are presented in Fig. 4. For both peptides, relatively sharp peaks, which correspond to folding/unfolding transitions, are observed on the heat capacity curves. Based on the heat capacity curves, and the use of a two-state model, the transition temperatures 310.24±0.03 K and 330.55±0.19 K were computed for IG(48–59) and IG(47–60), respectively; the enthalpy changes related to these transitions are ΔH = 34.85±0.12 kcal/mol and ΔH = 12.11±0.20 kcal/mol for IG(48–59) and IG(47–60), respectively. Previously, we studied the longer 16-residue (IG46–61) fragment of the C-terminal part of the B3 domain protein G34 and, using DSC techniques, we determined the folding temperature to be T = 320.11±0.14 K with an enthalpy change of ΔH = 48.01±0.60 kcal/mol. All of these results clearly show that the folding temperature is not linearly connected with the peptide length, even when all peptides share a twelve-reside-long common fragment. Changes in melting temperature and enthalpy of folding are not correlated with peptide length. Systematic reduction of the length of the peptides initially increases the folding temperature and then decreases it, and the enthalpy of folding is not correlated with the folding temperature. Generally, the range of changes obtained in the melting point and enthalpy of folding in our study are similar to those obtained by other authors who used similar peptides but studied mostly single or multiple mutations with constant peptide length.32,36–37
Fig. 4.
Heat capacity curves for (a) IG(48–59) and (b) IG(47–60) recorded in water at pH = 5.13 and 5.45, respectively.
CD measurements
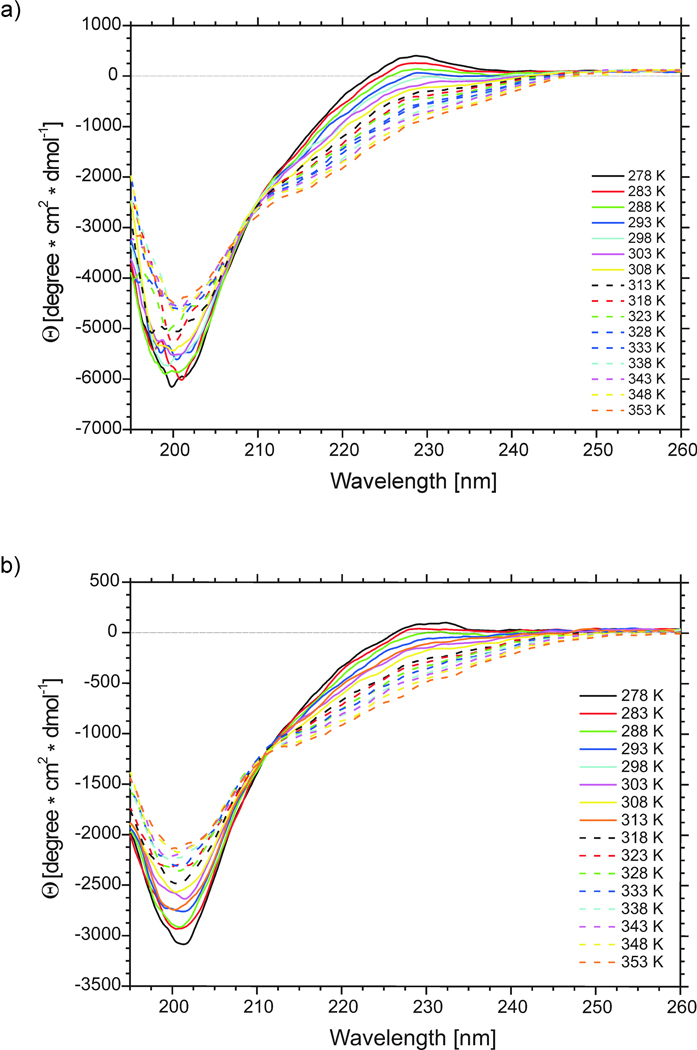
The CD spectra were recorded in pure water (pH = 5.13 and 5.45 for IG (48–59) and IG (47–60), respectively) at 16 different temperatures, i.e., at 5° intervals between 278 and 353 K (Fig. 5).
Fig. 5.
CD spectra of (a) IG(48–59) and (b) IG(47–60) in water at 16 different temperatures.
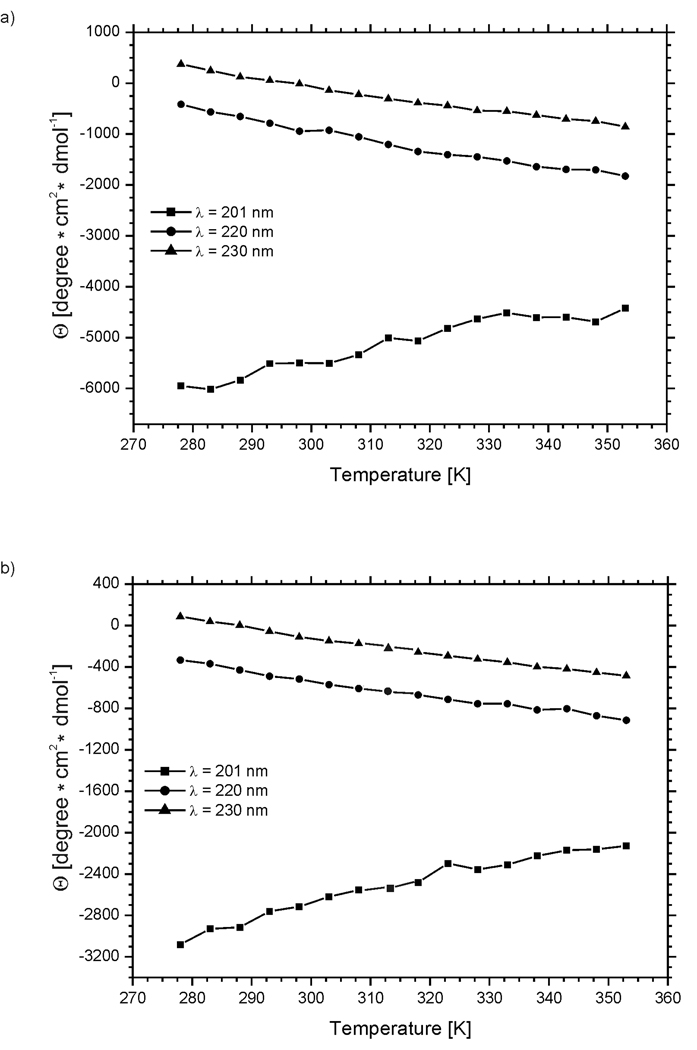
As shown in Fig. 5 and Fig. 6, the molar ellipticity varies with temperature. For both compounds, the ellipticity at 220 and 230 nm becomes more negative, whereas that at 201 nm less negative, with increasing temperature (Fig. 5 and Fig. 6). Negative bands at 201 and 220 nm are characteristic of statistical coil and regular β-sheet conformation, respectively.65,66 From the changes in ellipticity at selected diagnostic wavelengths, we observe that the overall changes are very small. Variation of the percentage of secondary structure elements with temperature, as calculated from CD spectra for IG(48–59) and IG(47–60), change very little with temperature (less than 2%) (see Table I), which prevents us from drawing any conclusion from these data.
Fig. 6.
Variation of the molar ellipticity of (a) IG(48–59) and (b) IG(47–60), at 201 nm (squares), 220 nm (circles), and 230 nm (triangles), respectively, with temperature.
Table I.
Percentage of secondary structure elements of IG(48–59) and IG(47–60) under different temperature conditions obtained from CD spectra using SP37A CONTINLL method.43
| IG(48–59) | IG(47–60) | |||||||||
|---|---|---|---|---|---|---|---|---|---|---|
| T [K] | α-helix | β-sheet | turn | statistical coil |
pp2 | α-helix | β-sheet | turn | statistical coil |
pp2 |
| 278 | 0.9 | 32.2 | 12.6 | 42.9 | 11.4 | 1.2 | 31.9 | 12.8 | 41.9 | 12.2 |
| 283 | 1 | 32.8 | 13.3 | 41.1 | 11.9 | 1.3 | 31.9 | 12.9 | 41.8 | 12.2 |
| 293 | 1.1 | 32.8 | 13.4 | 41 | 11.7 | 1.3 | 32 | 13 | 41.6 | 12.1 |
| 303 | 0.9 | 33.6 | 14.2 | 39.1 | 12.2 | 1.4 | 32.1 | 13.1 | 41.4 | 12 |
| 313 | 1.2 | 33.3 | 14.4 | 39.3 | 11.8 | 1.3 | 32 | 13 | 41.6 | 12 |
| 323 | 1.3 | 34.4 | 15.3 | 36.7 | 12.3 | 1.3 | 32.2 | 13.2 | 41.3 | 11.9 |
| 333 | 1.6 | 33.9 | 15.8 | 36.2 | 12.5 | 1.3 | 33.3 | 13.3 | 40.1 | 12 |
| 343 | 1.7 | 33.8 | 15.3 | 37.1 | 12.1 | 1.3 | 33.4 | 13.3 | 40 | 12 |
| 353 | 1.9 | 33 | 14.7 | 38.9 | 11.5 | 1.4 | 33.9 | 13.6 | 39.1 | 12 |
The method of Reference 43 was used to de-convolute the CD spectra.
In many studies, the change of ellipticity is used to determined the melting temperature of peptides34,64. It is seen in Figure 6 that, for all three wavelengths (201, 220 and 230 nm) for which we observed the largest ellipticity changes for both peptides, the ellipticity changes are rather linear or almost linear. Such a situation does not enable us to determine the melting temperatures for both investigated peptides based on CD measurements.
NMR measurements
A more detailed structural analysis was carried out with NMR spectroscopy. 2D H-NMR spectra of IG(48–59) and IG(47–60) were recorded in H2O/2H2O (9:1 by vol.) at pH = 5.13 and 5.45, respectively, at three different temperatures 283, 305 and 313 K, to examine the influence of temperature on the structure. The chemical shifts of the proton resonances for these peptides at these three temperatures are listed in Tables I – VI of supplemental data.
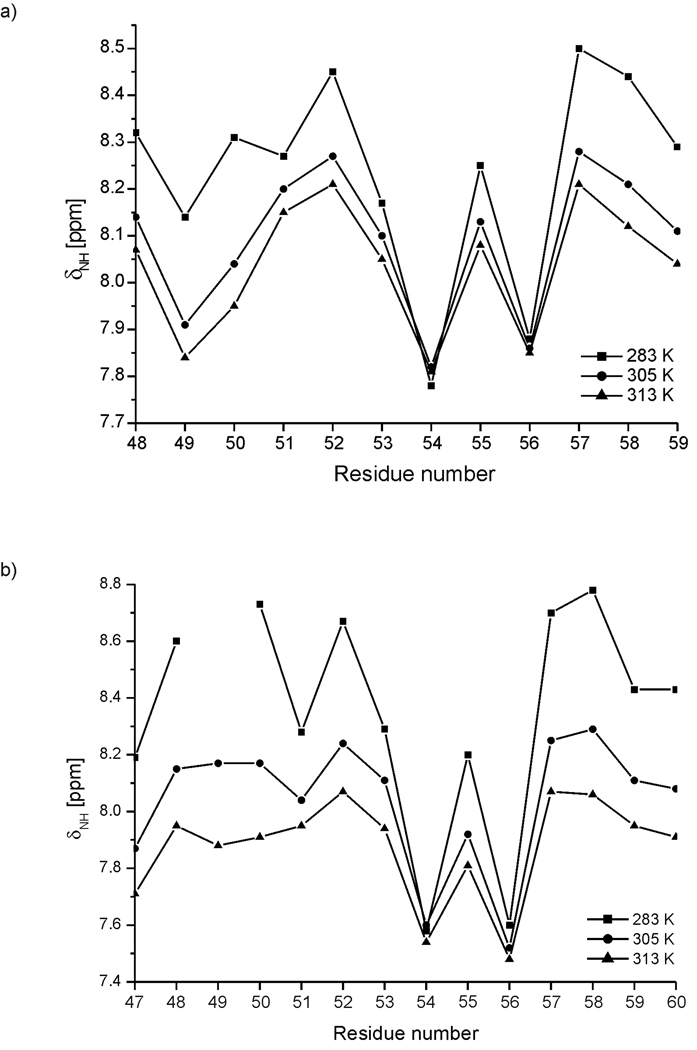
The chemical shifts of the amide protons of IG(48–59) and IG(47–60) at three different temperatures (283, 305 and 313 K) are plotted as a function of residue number in Fig. 7. Except for Thr54 and Thr56, whose amide chemical shifts do not change significantly, the chemical shifts of all other amino acid residues show a tendency to move upfield with increasing temperature (Fig. 7). In addition to these two threonine residues, the change in the chemical shift of the amide proton of Asp51 of the IG(48–59) peptide is finite but small. For Thr54 and Thr56, the temperature coefficients are Δδ/ΔT = 1.2 and 0.1 ppb/K, respectively, for IG(48–59), and Δδ/ΔT = −0.9 and −3.9 ppb/K for IG(47–60), respectively. The temperature coefficient for the amide proton of Asp51 in peptide IG(48–59) is Δδ/ΔT = −3.8 ppb/K (see Table VII of supplemental data). Thus, the amide protons of these residues could either be involved in a hydrogen bond or be buried in a hydrophobic region of the peptide (Δδ/ΔT < |4.5| ppb/K is the threshold below which an amide proton can be considered to be screened from the solvent).67 In our previous studies of the 16-residue peptide, we found that the amide protons of the three residues Thr54, Thr56 and Asp51 possess low temperature coefficients.34
Fig. 7.
Chemical shifts of the amide protons of consecutive amino acid residues of (a) IG(48–59) and (b) IG(47–60) at pH = 5.13 and 5.45, respectively, at three different temperatures (283, 305 and 313 K).
From these results, it can be seen that, in all three investigated peptides of different lengths, the amide protons of Thr54 and Thr56 are somehow protected from the environment. In the longer peptides (16-34 and 14-residues long), the amide proton of Asp51 is protected from the environment, which is not the case for the shorter 12-residue IG(48–59) peptide. In the native structure of the B3 domain of protein G,29 the amide proton of Thr54 forms a hydrogen bond with the carbonyl oxygen of the Asp51 residue. All hydrogen bonds listed above are responsible for stabilization of the β-turn in the native state. Our results indicate that the amide protons of Thr54 and Thr56 are located inside a well-organized three-dimensional structure which is a β-turn in the structure of the whole protein. The amide proton of Asp51 in the native structure of the B3 domain forms the last (the most exposed) hydrogen bond in the β-turn. Our study indicates that this amide proton becomes more and more exposed to solvent as the length of the peptide decreases. These findings support the idea that, regardless of the temperature and peptide length, part of the sequence, which involves at least residues Thr54 and Thr56, forms a well-packed three-dimensional structure. Further discussion about possible hydrogen-bond formation is presented in the section on MD simulations.
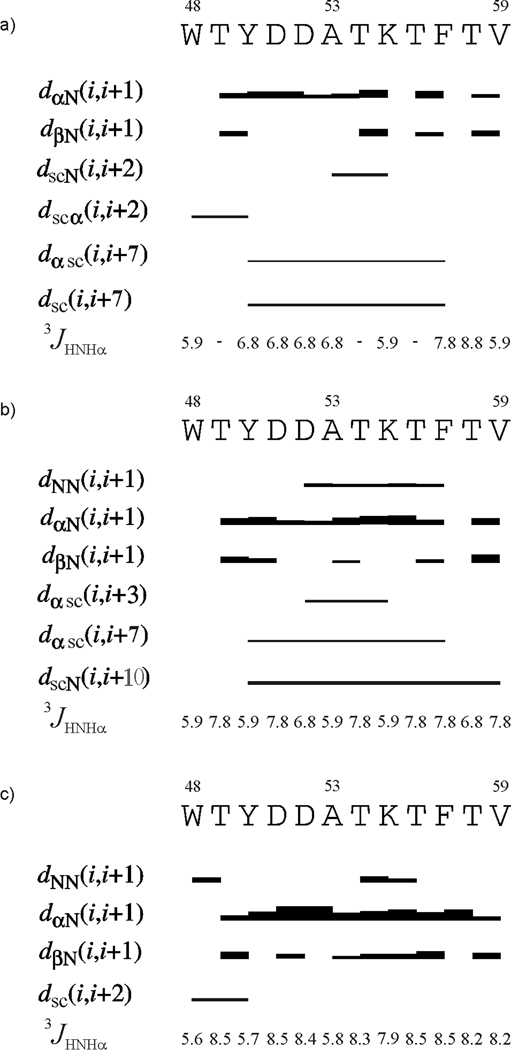
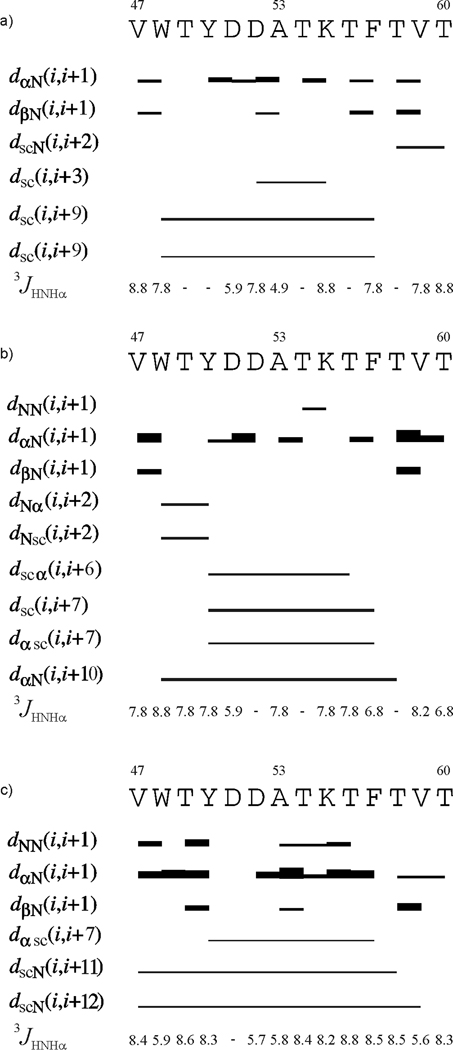
In Fig. 8 and Fig. 9, the ROE effects corresponding to interproton contacts and the values of the 3JNHHα coupling constants for IG(48–59) and IG(47–60), respectively, are presented for NMR measurements carried out at different temperatures. These quantities are discussed below.
Fig. 8.
ROE effects corresponding to the interproton contacts and the 3JNHHα coupling constants of IG(48–59) measured in H2O at (a) 283 K, (b) 305 K and (c) 313 K. The thickness of the bars reflects the strength of the ROE correlation as strong, medium or weak.
Fig. 9.
ROE effects corresponding to the interproton contacts and the 3JNHHα coupling constants of IG(47–60) measured in H2O at (a) 283 K, (b) 305 K and (c) 313 K. The thickness of the bars reflects the strength of the ROE correlation as strong, medium or weak.
IG(48–59)
In a β-turn structure, we should expect to find strong HN(i) – HN(i+1) connectivities and weak Hα(i) – HN(i+1) sequential ROE connectivities in the turn region whereas, for residues in β-strands, we should expect weak HN(i) – HN(i+1) and strong Hα(i) – HN(i+1) ROE signals.8,68 As shown in Fig. 8 for IG(48–59) at all temperatures, the Hα(i) – HN(i+1) ROEs are always observed but with different strength. The HN(i) – HN(i+1) connectivities are observed at 305 K and 313 K (Fig. 8b, c, respectively) mainly in the central part of the sequence (the expected β-turn region), which suggests that some kind of turn is formed and is more pronounced at higher temperature and occurs even above the melting temperature (the strength of the signals increases with increasing temperature). The Hβ(i) – HN(i+1) connectivities are usually weaker than Hα(i) – HN(i+1) signals, but are also found at all temperatures (Fig. 8). The Hβ(i) – HN(i+1) connectivities are usually stronger or more frequently observed in the terminal parts of the sequence, suggesting that this part of the molecule is in an extended conformation.8,68 For the IG(48–59) peptide, we observe long-range distance connectivities at 283 K [Hα(i) - Hsc(i+7), Hsc(i) - Hsc(i+7)] and at 305 K [Hα(i) - Hsc(i+7), Hsc(i) - HN(i+10)] where the subscript “sc” denotes side-chain proton(s) (Fig. 8a, b, Fig. 10a, Table II). At 313 K (Fig. 8c, Fig. 10a) there is only one long-range distance ROE connectivity [Hsc(i) - Hsc(i+2) between Trp48 and Tyr50] in the N-terminus of the peptide sequence. However, these residues are very close in the sequence and this interaction cannot force the investigated peptide to form a β-hairpin-like structure at 313 K.
Fig. 10.
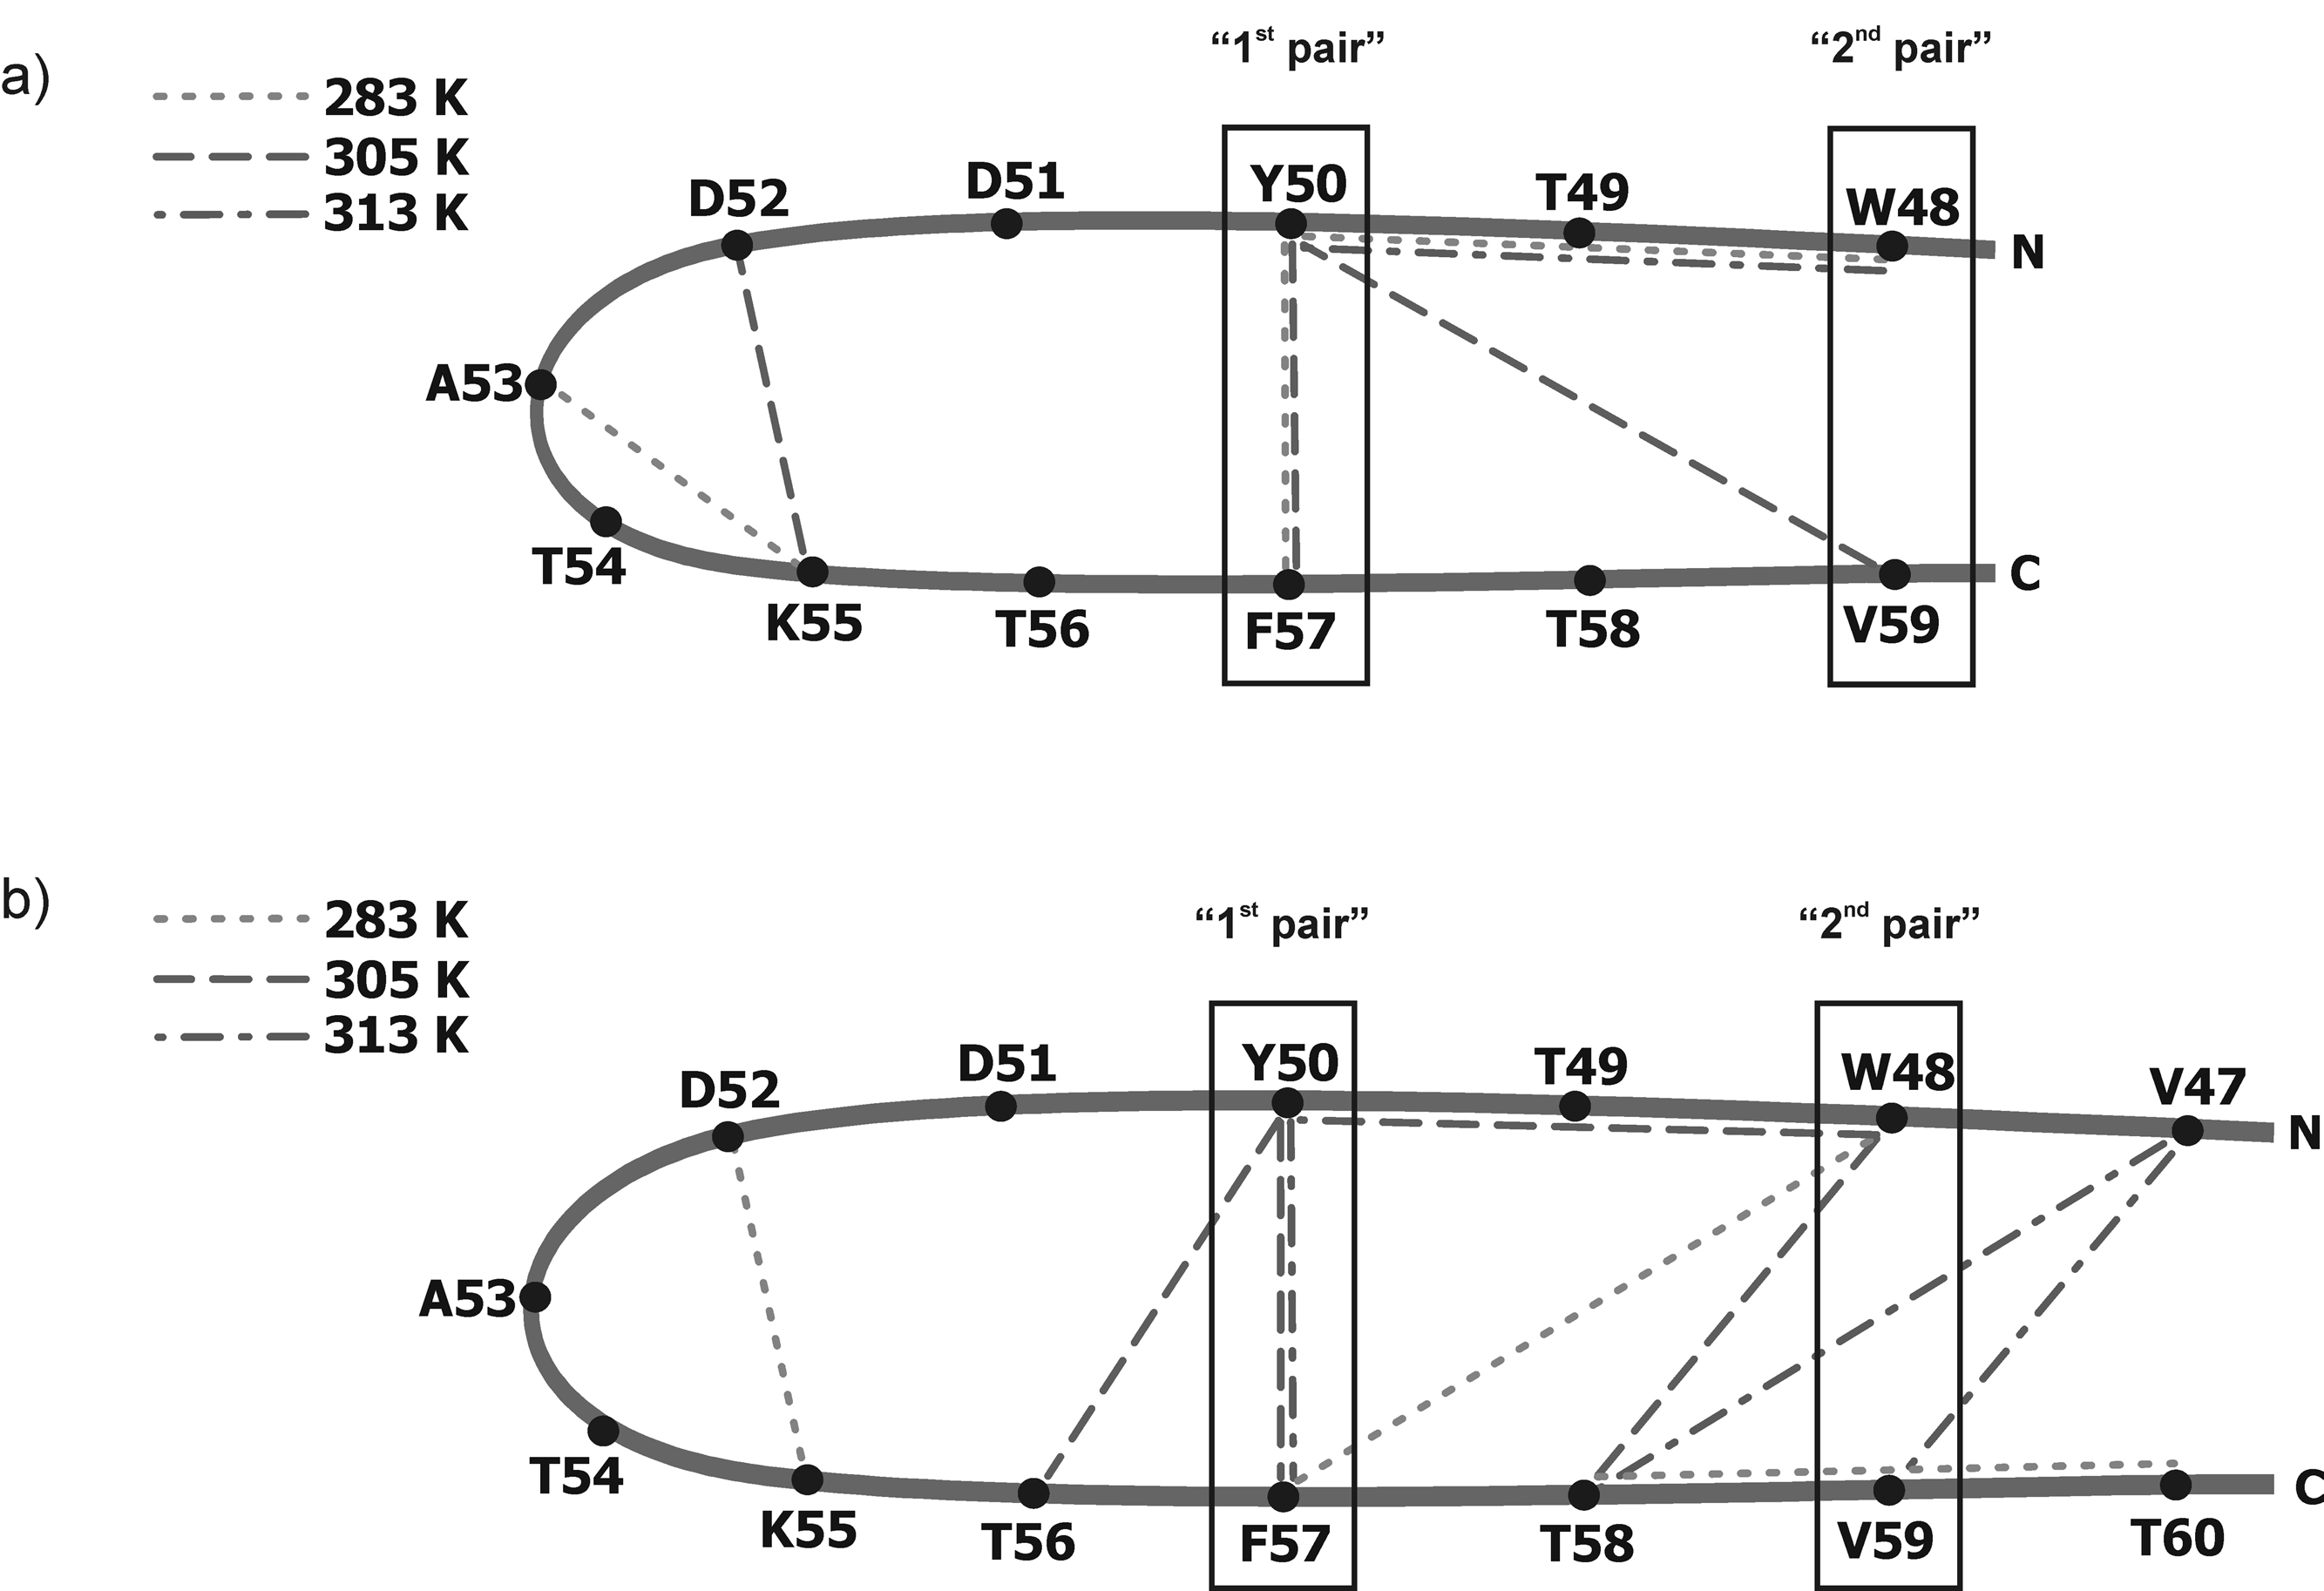
Outline of the structure of (a) IG(48–59) and (b) IG(47–60) with marked ROE connectivities at 283 K (short-dashed lines), 305 K (long-dashed lines) and 313 K (short-and-long dashed lines). In (a) and (b), the boxed fragments of the sequence correspond to the “1st pair” of hydrophobic residues (Tyr50 – Phe57) and the “2nd pair” of hydrophobic residues (Trp48 – Val59) [types of long-range interactions are listed in Table II].
Table II.
Atoms of residues separated by at least 2 residues in sequence (|i-j| > 1) between which ROE peaks were found at 283, 305 and 313 K in IG(48–59) and IG(47–60), respectively.
| ROE peaks between residues |i – j| > 1 | |||||
|---|---|---|---|---|---|
| IG(48–59) | IG(47–60) | ||||
| 283 K | 305 K | 313 K | 283 K | 305 K | 313 K |
| ζ2W48-αY50 | αY50 – δF57 | ζ3W48-β1Y50 | βW48 – δF57 | NW48 – αY50 | γV47 – NT58 |
| αY50 – δF57 | β2Y50 – Na | ζ3W48-β2Y50 | βW48 – εF57 | NW48–β1Y50 | γV47 – NV59 |
| βY50 - δF57 | αD52–δK55 | ζ2W48 – β1F57 | αW48 – NT58 | αY50 – δF57 | |
| βY50 - εF57 | ζ2W48 – β2F57 | αY50 – δF57 | |||
| βA53–NK55 | βD52 – δK55 | β1Y50 – αT56 | |||
| γT58 – NT60 | β1Y50 - δF57 | ||||
| β1Y50 - εF57 | |||||
| δY50 - εF57 | |||||
N – amide protons
Na – C-terminal amide protons
At 283 and 305 K, we observed long-range ROEs mostly between aromatic/hydrophobic residues (Tyr50 – Phe57) which stabilize the β-hairpin-like structure. All of these long-range hydrophobic interactions observed at lower temperatures are not observed at 313 K. The absence of these long-range hydrophobic interactions at 313 K coincides with the melting temperature (310 K) of IG(48–59), determined by the DSC method (Figure 4). It is clear from the NMR measurements that long-range hydrophobic interactions, which are responsible for formation and stabilization of a β-hairpin-like structure, are observed only at temperatures lower than the melting temperature determined from DSC measurements; also the disruption of these interactions probably lead to the melting of the structure. In our previous studies of the 16-residue peptide, we suggested that the presence of long-range hydrophobic interactions creates and stabilizes structure, and disruption of such interactions is clearly connected with the melting temperature.34 However, in our previous studies, we were not able to obtain clean interpretable NMR spectra at temperatures higher than the melting temperature determined from the DSC experiment. In the case of the shorter peptide IG(48–59), we are able to show that long-range hydrophobic interactions are observed at temperatures which are lower than the melting temperature and all long-range hydrophobic interactions vanish at temperatures above the melting temperature.
IG(47–60)
As for IG(48–59), the mostly very strong Hα(i) – HN(i+1) and weak Hβ(i) – HN(i+1) ROE connectivities are observed for IG(47–60) at all temperatures (Fig. 9). The same situation is observed with HN(i) – HN(i+1) connectivities which, however, are found only at higher temperatures (305 and 313 K) (Fig. 9b, c, respectively). This suggests that the turn is more pronounced with increasing temperature; however, the strength of the observed ROE signals do not grow as rapidly with increasing temperature as it did for IG(48–59). Long-range distance ROE connectivities are also observed: Hsc(i) - HN(i+2), Hsc(i) - Hsc(i+3), Hsc(i) - Hsc(i+9) at 283 K, HN(i) - Hα(i+2), HN(i) - Hsc(i+2), Hsc(i) - Hα(i+6), Hsc(i) - Hsc(i+7), Hα(i) - Hsc(i+7), Hα(i) - HN(i+10) at 305 K, and Hα(i) - Hsc(i+7), Hsc(i) - HN(i+11), Hsc(i) - HN(i+12) at 313 K [where the subscript “sc” denotes side-chain proton(s)] (Fig. 9, Fig. 10b, Table II). In the case of IG(47–60), the number of long-range contacts observed in the ROESY spectra is very high compared to the IG(48–59) peptide (see Figure 10). Many long-range contacts, which are consistent with formation of a β-hairpin-like structure, are observed. Most of these interactions are between hydrophobic residues: Tyr50 - Phe57, Val47 - Val59. It is clear that the number of long-range contacts between hydrophobic residues increases with increasing temperature. At 313 K (the highest temperature of the NMR measurements), only interactions between hydrophobic residues (Tyr50 - Phe57, Val47 - Val59) are observed whereas, at lower temperatures, many contacts between different kinds of residues (for example an ion-pair contact between Lys52 and Asp55) are found (see Figure 10b and Table II). Observation of an increased occurrence of interactions between hydrophobic residues with increasing temperature is in excellent agreement with the well-known fact that the strength of hydrophobic interactions increases with increasing temperature.69–75 The melting temperature of the IG(47–60) peptide, determined from DSC measurements, is 330.55 K. At the highest temperature at which NMR spectra were recorded (313 K), long-range hydrophobic interactions are observed, which is consistent with our hypothesis that hydrophobic interactions create and stabilize the structure of the peptide and their rupture is associated with the phase transition.34
MD simulations
The structural data summarized in Fig. 8 and Fig. 9 were used to carry out MD simulations of IG(48–59) and IG(47–60), respectively, with time-averaged restraints, in order to determine the structures of these peptides. The structures are discussed below.
IG(48–59)
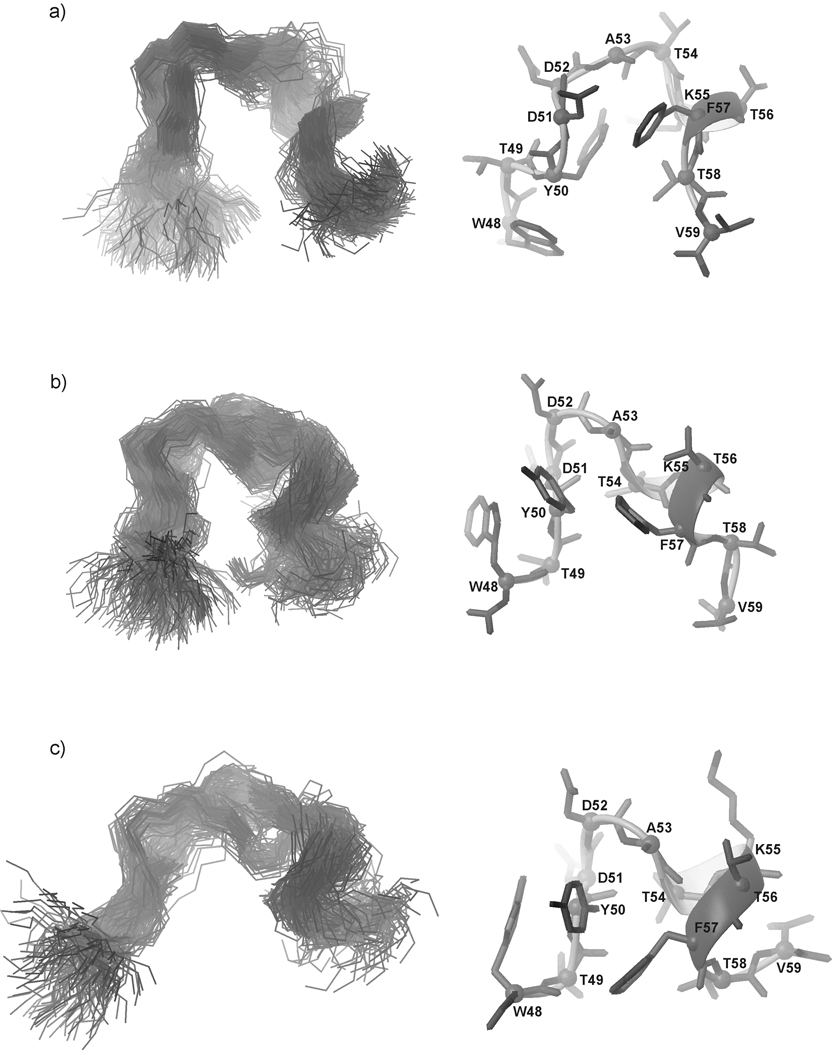
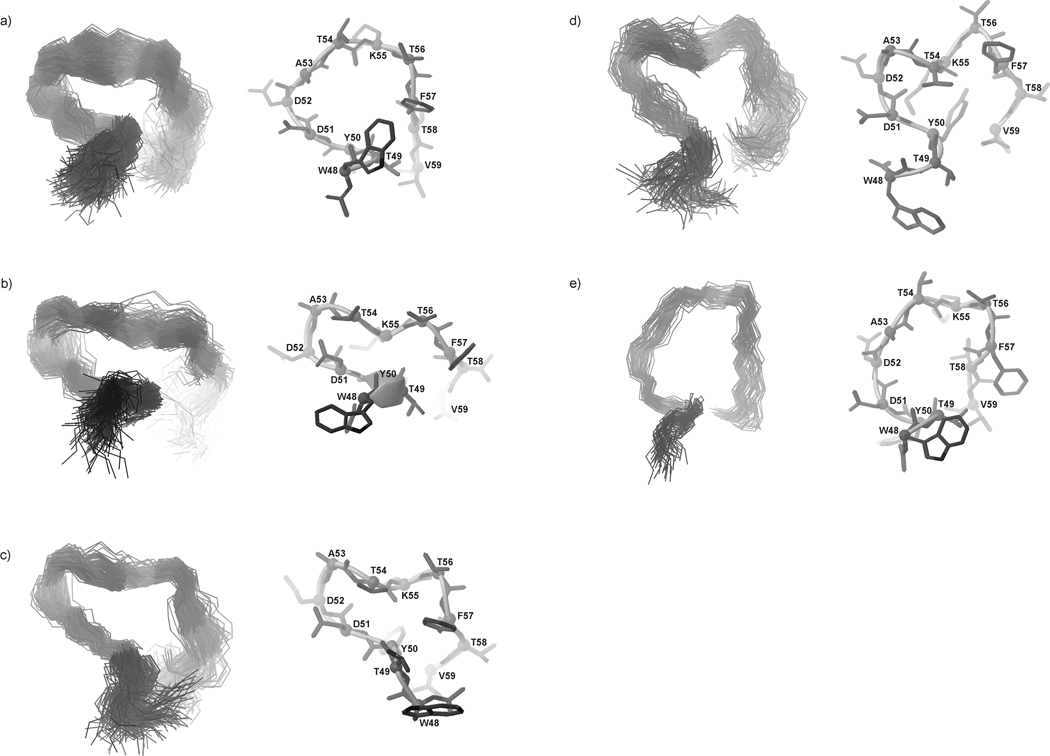
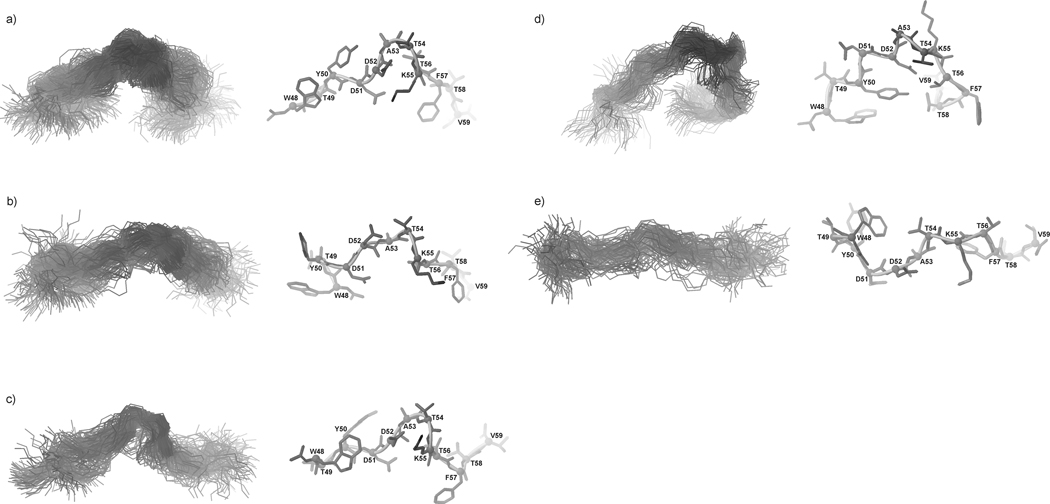
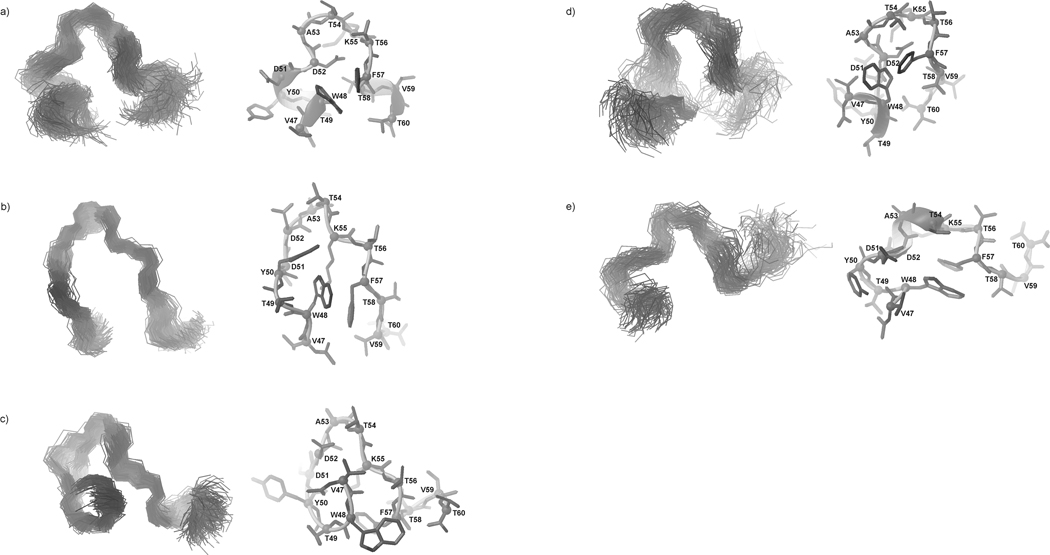
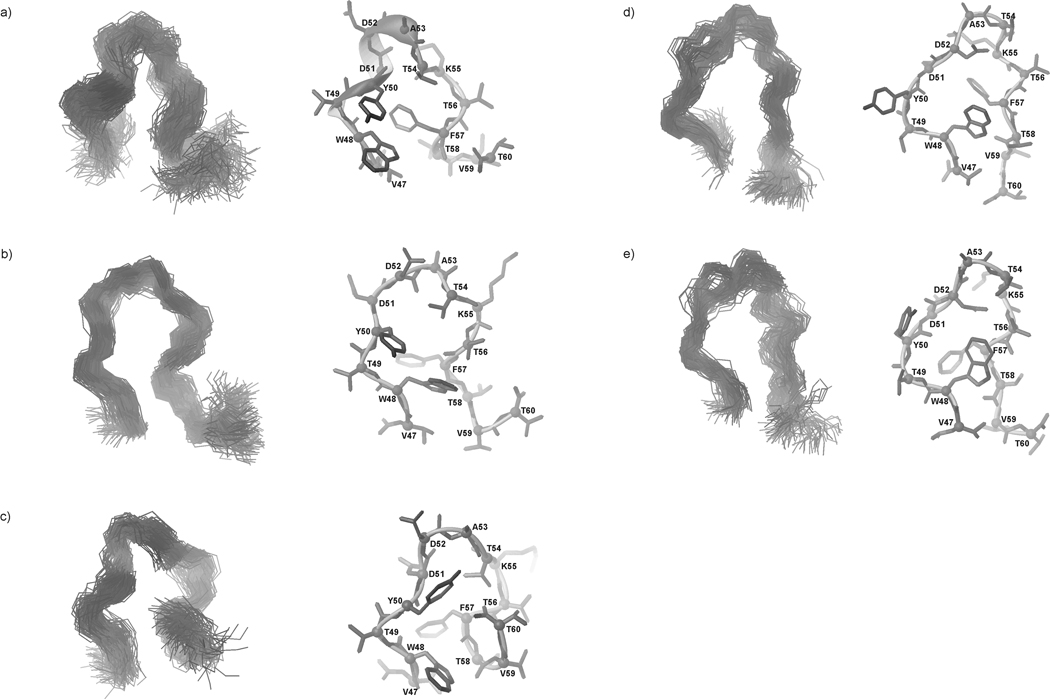
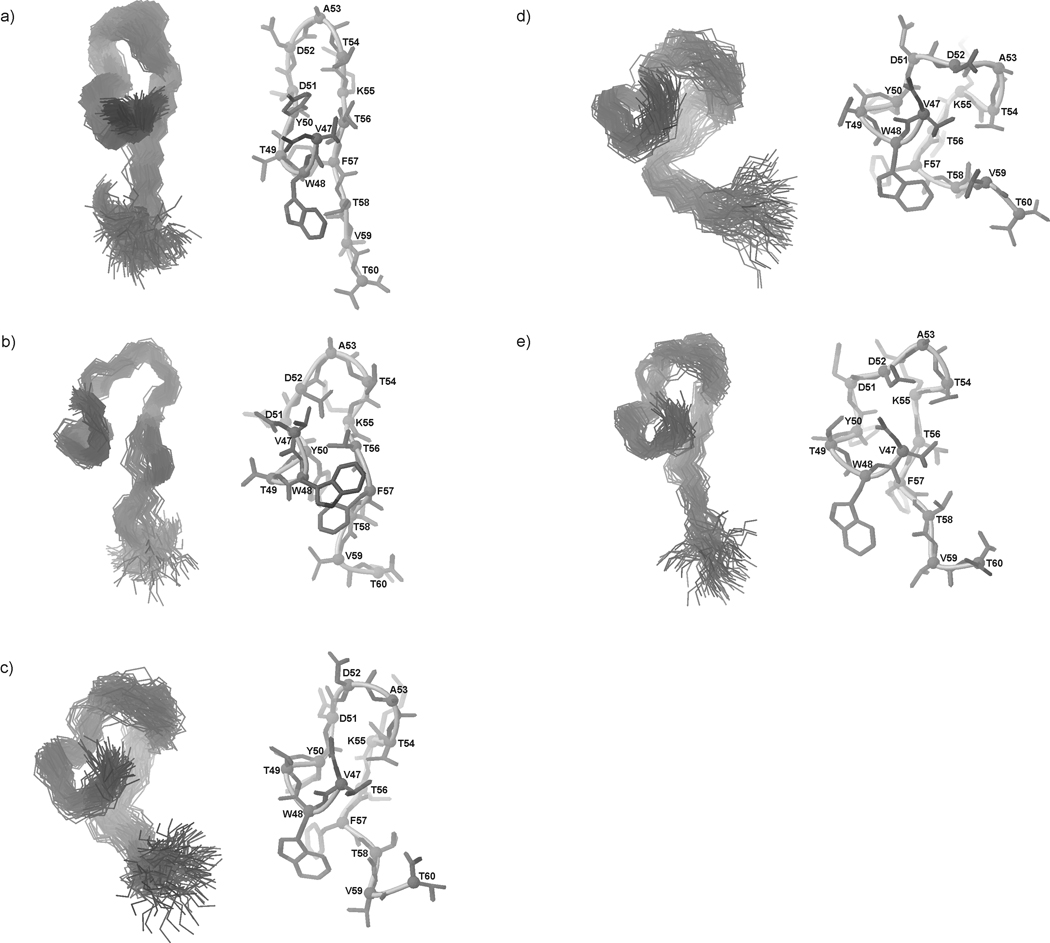
In Fig. 11, Fig. 12, and Fig. 13, the most populated conformational families of IG(48–59) at 283, 305 and 313 K, respectively, are presented.
Fig. 11.
Three most populated families of clustered conformations of IG(48–59) obtained by using time-averaged MD methodology with restraints from NMR measurements at 283 K. Left columns show all conformations from a family (only backbones are shown for clarity), right columns show the lowest energy conformation from the corresponding family (all heavy atoms are shown). 1200 conformations were subjected to a cluster analysis, leading to the following numbers and percentages of each clustered family: (a) 569 (47.4%), (b) 406 (33.8%), (c) 183 (15.3%).
Fig. 12.
Five families of clustered conformations of IG(48–59) obtained by using time-averaged MD methodology with restraints from NMR measurements at 305 K. Left columns show all conformations from a family (only backbones are shown for clarity), right columns show the lowest energy conformation from the corresponding family (all heavy atoms are shown). 1200 conformations were subjected to a cluster analysis, leading to the following numbers and percentages of each clustered family: (a) 563 (46.9%), (b) 271 (22.6%), (c) 209 (17.4%), (d) 106 (8.8%), (e) 51 (4.3%).
Fig. 13.
Same as Figure 12, but for 313 K, with the following results: (a) 448 (37.3%), (b) 290 (24.2%), (c) 188 (15.7%), (d) 172 (14.3 %), (e) 102 (8.5 %).
After MD simulations using the NMR restraints obtained at 283 K, we obtained three main families of conformations, which exhibit β-hairpin-like structure (Fig. 11). The most populated family of conformations (47.4%) (Fig. 11a) has a well-developed turn region, which is observed in exactly the same sequence position as it is in the native β-hairpin fragment. The other two families of conformations (Fig. 11b, c) are more disordered but, in each case, the β-hairpin-like structure is stabilized by interactions between two aromatic residues Tyr50 and Phe57 hereafter referred as the “1st pair” of hydrophobic residues (Fig. 11, Fig. 8, and Fig. 10a). In each of the three families of conformations, in the C-terminal strand of the IG(48–59) peptide, one α-helical roll between residues Lys55 – Phe57 is created. There are two reasons for this behavior: first is that, at 283 K and 305 K, Lys55, which begins the inverse roll, has a very low value of its vicinal coupling constant (5.9 Hz) (Fig. 8a, b); second is that Lys55, and Thr56 at 305 K and 313 K, and additionally Phe57 at 305 K, are involved in sequential HN(i) – HN(i+1) ROE connectivities.68 In earlier studies of the 16-amino-acid-residue peptide corresponding to the C-terminal β-hairpin fragment of the B1 domain of protein G, Blanco at al.8 as well as Muñoz et al.35 and others concluded that two pairs of hydrophobic residues [Tyr50 – Phe57 (the “1st pair” of hydrophobic residues) and Trp48 – Val59 (the “2nd pair” of hydrophobic residues)] are the most important in stabilizing the secondary structure of this fragment. Our studies of a similar 16-amino-acid-residue fragment corresponding to the C-terminal β-hairpin of the B3 domain of protein G34 show the same behavior at 283 and 305 K. When the peptide is shorter by about four residues, two from its N- (Gly and Val) and two from its C-terminus (Thr and Glu) (which now corresponds to the C-terminal β-hairpin of each of the B domains of protein G), the significance of each pair in stabilizing the structure becomes clear.
The results of the conformational analysis at T = 305 K are also very interesting (Fig. 12). We obtained five families of conformations (Fig. 12), which could be divided into three groups. It appears as if the conformations are in a fast equilibrium and change from the Ω-loop-like structure (Fig. 12a, e) through more disordered conformations (Fig. 12d) and finally to a β-hairpin-like structure, but with a different position of the turn region than is observed in the native structure of the whole protein29 (the turn position between Asp51 – Thr54) (Fig. 12b, c). The melting temperature of the IG(48–59) peptide is T = 310.24 K, which differs from the temperature of the measurements only by about 5 K, which means that the structure obtained at T = 305 K reflects the conformational dynamics very close to the folding temperature at which the population of the folded and unfolded structures become equal. It is also important to note that, although the structures at T = 305 K are not similar in shape to the native β-hairpin, the main interactions within the “1st pair” of hydrophobic residues (Tyr50 – Phe57) (Fig. 8, Fig. 10) which stabilize the structure are still preserved, even at the temperature close to the melting temperature. Additionally, one cross-strand interaction is also present between Tyr50 and Val59 (Fig. 8, Fig. 10a, Table II).
At the highest temperature of the measurements (313 K), the structure is more extended (Fig. 13), not exhibiting long-range interactions, which could span the whole structure of the peptide. It was mentioned before that HN(i) – HN(i+1) ROEs are observed in the turn region (Fig. 8). These interactions and the low coupling constant of Ala53 (5.8 Hz) (Fig. 8), which is in the middle of the turn sequence in the native hairpin, results in the creation of the turn in the middle of the sequence (Fig. 13). The turn position is preserved in the most populated families of the IG(48–59) peptide (Fig. 13a, b, c, d). Since 313 K is above the phase transition temperature (Fig. 4), the structures shown in Fig. 13 reflect the general behavior of this fragment after the folding/unfolding stage when the turn structure is still preserved in exactly the same position as in the native β-hairpin. Additionally, Thr54 and Thr56, which exist in the turn region, exhibit very low temperature coefficients (Δδ/ΔT = 1.2 and 0.1 ppb/K, respectively) which suggests that they may be involved in hydrogen-bond formation (the possible acceptors of the amide protons of Thr54 and Thr56 are listed in Table III and shown in Fig. 14 a–d) or that they are simply protected from fast local environment changes.67 This means that the sequence of the turn is very important for understanding the folding and stability of this fragment, which appears in each of the C-terminal β-hairpin fragments of the B domains of protein G from Streptococcus.
Table III.
Percentage of possible hydrogen bonds at 283, 305 and 313 K for IG(48–59).
| Donor | Acceptor | % Occupancy | ||
|---|---|---|---|---|
| 283 K | 305 K | 313 K | ||
| NT56 | Oγ1T54 | 12.9 | 3.65 | |
| NT56 | OA53 | 11.8 | 15.45 | |
| NT54 | OD52 | 8.8 | 2.85 | 10.55 |
| NT54 | Oδ1D52 | 7.0 | 39.25 | |
| NT56 | OT54 | 6.25 | 46.8 | 12.85 |
| NT54 | OD51 | 5.7 | 63.45 | |
| NT54 | Oδ2D52 | 5.5 | 47.85 | |
| ND51 | OT54 | 20.9 | ||
| NT54 | Oδ2D51 | 6.75 | ||
| NT54 | Oδ1D51 | 4.7 | ||
| NT56 | Oδ2D52 | 14.4 | ||
| NT56 | Oδ1D52 | 11.4 | ||
Fig. 14.
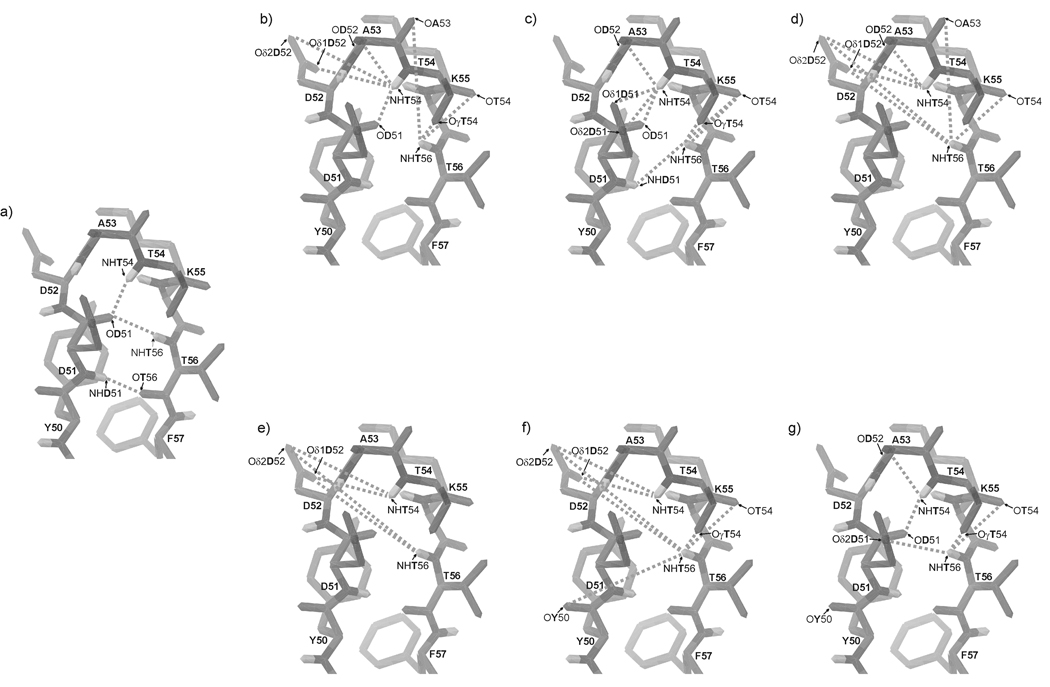
The native C-terminal β-hairpin structure fragment of IGD with marked (a) native hydrogen bonds; possible hydrogen bonds (b) at 283 K, (c) at 305 K and (d) at 313 K for IG(48–59) and possible hydrogen bonds (e) at 283 K, (f) at 305 K and (g) at 313 K for IG(47–60).
At 283 K, there are no HN(i) – HN(i+1) ROE connectivities but only the medium-strength Hsc(i) – HN(i+2) connectivity between Ala53 and Lys55 which stabilizes the turn region. The amide protons of residues Asp51, Thr54 and Thr56 have very low temperature coefficients (−3.8, 1.2 and 0.1 ppb/K, respectively) suggesting their role as possible donors of amide protons in hydrogen bonds. In our NMR spectra, we are not able to find any ROE connectivities to identify the possible acceptors in possible hydrogen bonds. To determine the possibility of hydrogen-bond formation, we have analyzed MD trajectories to determine whether the amide protons with low temperature coefficients can be involved in hydrogen-bond formation.34 For a given structure, we assumed that a hydrogen bond is formed when the distance between the amide proton and the potential acceptor is smaller than 2.5 Å, and the N-H…Acceptor angle is in the range of 150–180 degrees. Every set of MD trajectories, obtained with use of the NMR data recorded at 283, 305 and 313 K, was analyzed separately.
The possible acceptors of the amide protons of IG(48–59) at each temperature are listed in Table III and shown in Fig. 14a–d. In the native structure, the amide protons of residues Thr54 and Thr56 are involved in hydrogen-bond formation.29 By analyzing the data from Table III, it is found that the amide protons of residues Thr54 and Thr56 can form many hydrogen bonds with many acceptors, which reflects the conformational dynamics of the peptide. As shown in Fig. 14 a–d and in Table III, the amide protons of Asp51, Thr54 and Thr56 at 305 K form relatively stable hydrogen bonds with the carbonyl oxygen of residues Thr56, Asp51 and Thr54, respectively. At T = 283 and 313 K, it seems that the amide protons can be involved in possible hydrogen bonds with many acceptors (Fig. 14b, d). At 283 K, the frequency of observed hydrogen bonds is very low, and increases with increasing temperature, as shown in Table III. For the amide proton of Thr54, the number and frequency of observed possible hydrogen bonds increase with increasing temperature in about 26% of the MD snapshots from simulations with NMR restraints recorded at 283K. At 305 K, the same amide proton is involved in hydrogen-bond formation in about 67% and, at 313 K, 93% of the MD snapshots, respectively. It should be noted that hydrogen bonds are formed with several different acceptors (see Table III). The results presented here are consistent with the NMR data which clearly show that the strength of HN(i) – HN(i+1) connectivities in the part of the sequence related to the turn region increases with increasing temperature (Fig. 8). The possible hydrogen-bond formation can increase the stability of the turn structure even at temperatures higher than the melting temperature. The data suggest that the amino acid sequence of the investigated peptide has the ability to form a very stable turn structure which can be stabilized by a very dynamic hydrogen bond network.
A similar analysis was performed for all amide protons present in the investigated peptide (data not shown). It was found that the possibility of formation of hydrogen bonds by other than the Asp51, Thr54 and Thr56 amide protons is very low. All these results clearly show that, in particular, the Thr54 and Thr56 amide protons can be involved in the formation of many hydrogen bonds, which explains the low values of the temperature coefficients determined from the NMR spectra; however, it should be stressed that the protons are involved in hydrogen bonding with many acceptors and not with just one acceptor as usually observed in the structures of proteins. Our results also show that hydrogen bonds are not responsible for the stabilization of the whole structure of the investigated peptide, as was postulated in previous studies;8,35 however, our results suggest that those hydrogen bonds stabilize a bent conformation around the turn region (in fact, we observed many possible hydrogen bonds only inside the turn region sequence (see Fig. 14b–d).
IG(47–60)
The most populated conformational families of IG(47–60) at 283, 305 and 313 K, respectively, are presented in Fig. 15–17.
Fig. 15.
Five families of clustered conformations of IG(47–60) obtained by using time-averaged MD methodology with restraints from NMR measurements at 283 K. Left columns show all conformations from a family (only backbones are shown for clarity), right columns show the lowest energy conformation from the corresponding family (all heavy atoms are shown). 1200 conformations were subjected to a cluster analysis, leading to the following numbers and percentages of each clustered family: (a) 373 (31.1%), (b) 300 (25%), (c) 300 (25%), (d) 131 (10.9%), (e) 96 (8%).
Fig. 17.
Same as Figure 14, but for 313 K, with the following results: (a) 356 (29.7%), (b) 300 (25%), (c) 245 (20.4%), (d) 177 (14.8%), (e) 122 (10.2%).
After MD simulations, with NMR restraints recorded at 283 K, five main families of conformations were obtained; these exhibit β-hairpin-like structure as was found for IG(48–59) (Fig. 15). At this temperature, the behavior of IG(47–60) is slightly different than that of IG(48–59). For IG(47–60), there are no HN(i) – HN(i+1) ROE signals which could indicate stabilization of the structure, but there is an interaction between Asp52 and Lys55, which appears in the IG(48–59) fragment only at 305 K. Secondly, there are long-range distance cross-strand interactions between hydrophobic amino acid residues that stabilize a hairpin-like structure (Trp48 and Phe57), which are not present in IG(48–59).
At T = 305 K, the conformations of each of the five families of IG(47–60) are similar in shape to the native hairpin (Fig. 16). The “1st pair” of hydrophobic residues starts to emerge (Fig. 9, Fig. 10b). The turn region is preserved in most of the resulting families of conformations (Fig. 16a, b, e). Because of the large number of long-range distance interactions, the structure at 305 K looks like the native one. There is a small chain reversal which arises because of the interaction between Trp48 and Tyr50 in the N-terminus (Fig. 9, Fig. 10b).
Fig. 16.
Same as Figure 14, but for 305 K, with the following results: (a) 556 (46.3%), (b) 329 (27.4%), (c) 131 (10.9%), (d) 99 (8.3%), (e) 85 (7.1%).
Because the phase transition temperature for IG(47–60) is 330.55 K [about 20 degrees higher than that of IG(48–59)], the structures of each of the five families of conformations obtained with NMR restraints recorded at 313 K have preserved the β-hairpin-like structure even at the highest temperature of the NMR measurements (313 K). As was shown for IG(48–59) and for the longer 16-residue peptide studied in our previous work,34 the thermal stability of these peptides is strongly coupled to the presence of long-range hydrophobic interactions. The results presented in this paper indicate that, in the IG(48–59) peptide, the Tyr50 - Phe57 hydrophobic interaction (“1st pair” of hydrophobic residues) determines its thermal stability and structure. In IG(47–60), the interaction within the “1st pair” is observed, and more hydrophobic interactions are also present (see Figure 10b). This observation further supports our conclusion about the importance of hydrophobic interactions in stabilizing this type of peptide structure. The larger number of hydrophobic interactions in IG(47–60) account for the significant increase of its melting temperature, compared to the smaller number of such interactions in IG(48–59) that lead to its lower melting temperature.
However, it should be noted that the pattern of long-range interactions in the IG(47–60) peptide changes very rapidly with temperature (see Figure 10b) compared to IG(48–59) and to the 16-reside long peptide studied previously.34 The DSC data (see Figure 4) indicate that IG(47–60) has a very high melting temperature (about 330 K) but the enthalpy change associated with the phase transition is much lower (by about 12.11 kcal/mol) compared to other peptides [ΔH = 34.85 kcal/mol for IG(48–59), and ΔH = 48.01 kcal/mol for IG(46–61) studied previously34]. A possible explanation for these results is that there is a very flexible network of long-range hydrophobic interactions in IG(47–60) which persists over a wide range of temperatures, albeit with changes in the interaction pattern. This observation is in agreement with the increased width of the heat-capacity curve of IG(47–60) compared to that of IG(48–59) (Fig. 4). However, the strength of the hydrophobic interactions in IG(47–60) is diminished because of the flexibility of the hydrophobic-interaction network, which leads to a lower height of the heat-capacity peak and a lower ΔH of the conformational transition. In the case of the other peptides, which seem to be much more rigid, disruption of long-range hydrophobic interactions leads to lower transition temperatures but more energy is required to induce the phase transition.
At each temperature for IG(47–60) (283, 305 and 313 K), the “2nd pair” of hydrophobic residues (Trp48 – Val59), observed by Blanco et al.,8 Muñoz et al.,35 and others, and in the 16-amino-acid-residue peptide studied previously,34 does not appear. Thus, the removal of only two residues, one from the N- and one from the C-terminus, disrupts this interaction.
Thr54 and Thr56 have very low values of the amide-hydrogen temperature coefficient, Δδ/ΔT = −0.9 and −3.9 ppb/K, respectively (see supplemental data). Thus, the amide protons of these residues, as for the IG(48–59) peptide, could be involved in the formation of hydrogen bonds. As for the IG(48–59) peptide, we analyzed the structures from the MD runs to identify possible hydrogen-bond acceptors. The results of this analysis are shown in Table IV and in Fig. 14e–g. Also, as observed for IG(48–59), both amide protons with a low value of the temperature coefficient can form a hydrogen bond with a large number of acceptors. Some of the observed hydrogen bonds are those observed in the native crystal structure of the B3 domain29 [hydrogen bond between NHThr54 and OAsp51 observed at 313 K (see Table IV)]. The general number of possible hydrogen bonds for IG(47–60) is smaller than those observed for IG(48–59) (see Table III, IV and Fig. 17). This suggests that flexibility and conformational dynamics of IG(47–60) is reduced compared to IG(48–59), which is in general agreement with all of the data presented here.
Table IV.
Percentage of possible hydrogen bonds at 283, 305 and 313 K for IG(47–60).
| Donor | Acceptor | % Occupancy | ||
|---|---|---|---|---|
| 283 K | 305 K | 313 K | ||
| NT54 | Oδ2D52 | 38.6 | 9.0 | |
| NT54 | Oδ1D52 | 36.95 | 31.7 | |
| NT56 | Oδ2D52 | 21.75 | 24.05 | |
| NT56 | Oδ1D52 | 15.5 | 12.85 | |
| NT56 | OY50 | 18.8 | ||
| NT56 | OT54 | 17.25 | 9.9 | |
| NT56 | Oγ1T54 | 12.75 | 27.65 | |
| NT54 | OD52 | 41.5 | ||
| NT54 | OD51 | 31.9 | ||
| NT56 | Oδ2D51 | 10.25 | ||
CONCLUSIONS
Extensive conformational studies of two peptides (12 and 14 residue long), excised from the C-terminal β-hairpin of the B domain of the immunoglobulin binding bacterial protein G were carried out. Our study shows that both of the investigated peptides can form structures similar in shape to a β-hairpin in solution, and the structure is stabilized by hydrophobic interactions. Both of the investigated peptides display the following common structural feature: part of the sequence from residue Asp52 to Lys55 always has a shape resembling that of a β-turn at all temperatures, regardless of the length of the sequence. Since this part of the sequence is strictly conserved in all known sequences of the B domain of the immunoglobulin binding bacterial proteins,28 our results suggest that this small part of the protein can be considered as a nucleation site because, regardless of external conditions, it always displays the same structural features in solution. Within the Asp52 – Lys55 fragment, we also observed a few amide protons for which the temperature coefficients are very low. This supports our hypothesis that the turn region has a defined structure which is capable of shielding amide protons efficiently from the solvent environment. This shielding effect is usually associated with hydrogen-bond formation. Our data suggest that, if hydrogen-bond formation is possible, it is very dynamic; a single amide proton with a low temperature coefficient can form hydrogen bonds with several different acceptors. Nevertheless, formation of such dynamic hydrogen bonds can contribute to the overall stability of the turn region. Our results are in general agreement with the suggestion proposed by Muñoz et al.35 that the hydrogen bonds in the turn region are formed initially and are responsible for initiation of hairpin formation.
From the NMR data, it follows that the hydrophobic contact between Tyr50 and Phe57 (the “1st pair” of hydrophobic residues) persists until the melting temperature determined from DSC measurements for both peptides. Moreover, for IG(48–59), for which, the NMR spectra at a temperature higher than the melting temperature were recorded in this study, the signals corresponding to the hydrophobic contacts between these side chains vanish. These data confirm our earlier results, obtained for the 16-residue peptide, that formation/breaking of long-range hydrophobic interactions are responsible for the appearance of the heat capacity peak on the thermal unfolding/folding curve obtained from DSC measurements.34 Our results show that the DSC method is a very convenient method for determining the folding temperatures of peptides. Usually, two other methods (beside DSC) are used for determining melting points. One method is based on observation of ellipticity changes at selected wavelengths as a function of temperature,64 and another one is based on observation of changes of chemical shifts in NMR spectra as a function of temperature32,36–37. As seen clearly from the ellipticity data in Fig. 6, it is not possible to determine the transition temperature because the ellipticity changes almost linearly with temperature. Similarly for the chemical shifts of tyrosine protons, which were used in many previous studies on similar peptides to determine melting temperatures;32,34,36,37 the ellipticity and chemical shift data change linearly with temperature for both peptides (data not shown). For both of our peptides, ellipticity or chemical shifts do not serve as indicators of a phase transition. The results presented here also confirm our previous observation that DSC-, CD-, and NMR-based folding temperature measurements do not agree because they depend on different features of the conformational changes that occur during heating/cooling of the system34 under investigations.
For both peptides, the number of contacts between the atoms of hydrophobic side chains is usually higher at T = 305 K than at T = 283 K which is in agreement with the fact that the strength of hydrophobic interactions increases with increasing temperature; the number of hydrophobic contacts decreases at higher temperatures because of increased conformational entropy which drives the chain to more disorder structures. This suggests that hydrophobic interactions are one of the major factors stabilizing the structure of both peptides under study. The importance of hydrophobic interactions suggests that the general folding mechanism for the investigated peptides is as follows. Initially, the turn region is formed and stabilized by dynamic hydrogen bond(s). Formation of the turn can bring hydrophobic residues (Tyr50 and Phe57) close to each other and zip-up the hairpin structure. Formation of the Tyr50 - Phe57 (“1st pair”) hydrophobic residues can facilitate formation of the 2nd hydrophobic pair composed of Trp48 and Val59, which is observed clearly in the longer 16-residue peptide34.
Muñoz and coworkers35,76,77 proposed the following general mechanism for formation of this kind of β-hairpin (an Ising model). In the first step the turn region is formed and then cross-strand interactions are subsequently formed (hydrogen bonds and hydrophobic interactions) beginning from the turn region.35,76,77 Our study supports their Ising model in which the turn region forms first and is stabilized by a hydrogen-bond network, but these hydrogen bonds are in most cases not native ones (Muñoz et al. assume that only native hydrogen bonds are present). From our study, we find that only hydrophobic interactions stabilize growing β-hairpins and, contrary to the proposal of Muñoz et al., we are not able to identify any stable hydrogen bonds beyond the turn region.
To investigate the mechanism of β-hairpin formation further, we are currently carrying out studies on even shorter sequences (eight and six residues long) to demonstrate the concept of the importance of hydrophobic interactions in stabilizing structure, formation, and stability of the turn region as the folding initiation site.
ACKOWLEDGEMENTS
This research was supported by the Polish Ministry of Science and Higher Education grant 1696/H03/2007/32, the U.S. National Institutes of Health (GM-14312), and the U.S. National Science Foundation (MCB05-41633). This research was conducted by using the resources of (a) our 880-processor Beowulf cluster at the Baker Laboratory of Chemistry and Chemical Biology, Cornell University, (b) the National Science Foundation Terascale Computing System at the Pittsburgh Supercomputer Center, (c) the John von Neumann Institute for Computing at the Central Institute for Applied Mathematics, Forschungszentrum Juelich, Germany, (d) the Beowulf cluster at the Department of Computer Science, Cornell University, (e) the resources of the Center for Computation and Technology at Louisiana State University, which is supported by funding from the Louisiana legislature (f) our 45-processor Beowulf cluster at the Faculty of Chemistry, University of Gdańsk, (g) the Informatics Center of the Metropolitan Academic Network (IC MAN) in Gdańsk, and (h) the Interdisciplinary Center of Mathematical and Computer Modeling (ICM) at the University of Warsaw.
REFERENCES
- 1.Matheson RR, Jr, Scheraga HA. A method for predicting nucleation sites for protein folding based on hydrophobic contacts. Macromolecules. 1978;11:819–829. [Google Scholar]
- 2.Matheson RR, Jr, Scheraga HA. Steps in the pathway of the thermal unfolding of ribonuclease A. A nonspecific surface-labeling study. Biochemistry. 1979;12:2437–2445. doi: 10.1021/bi00579a001. [DOI] [PubMed] [Google Scholar]
- 3.Honig B. Protein folding: From the Levinthal paradox to structure prediction. J Mol Biol. 1999;293:283–293. doi: 10.1006/jmbi.1999.3006. [DOI] [PubMed] [Google Scholar]
- 4.Baldwin RL, Rose GD. Is protein folding hierarchic? I. Local structure and peptide folding. Trends Biochem Sci. 1999;24:26–33. doi: 10.1016/s0968-0004(98)01346-2. [DOI] [PubMed] [Google Scholar]
- 5.Baldwin RL, Rose GD. Is protein folding hierarchic? II. Folding intermediates and transition states. Trends Biochem Sci. 1999;24:77–83. doi: 10.1016/s0968-0004(98)01345-0. [DOI] [PubMed] [Google Scholar]
- 6.Brockwell DJ, Smith DA, Radford SE. Protein folding mechanisms: new methods and emerging ideas. Curr Opin Struct Biol. 2000;10:16–25. doi: 10.1016/s0959-440x(99)00043-3. [DOI] [PubMed] [Google Scholar]
- 7.Dyson HJ, Wright PE, Scheraga HA. The role of hydrophobic interactions in initiation and propagation of protein folding. PNAS. 2006;103:13057–13061. doi: 10.1073/pnas.0605504103. [DOI] [PMC free article] [PubMed] [Google Scholar]
- 8.Blanco FJ, Rivas G, Serrano L. A short linear peptide that folds into a native stable β-hairpin in aqueous solution. Nat Struct Biol. 1994;1:584–590. doi: 10.1038/nsb0994-584. [DOI] [PubMed] [Google Scholar]
- 9.Searle MS, Williams DH, Packman LC. A short linear peptide derived from the N-terminal sequence of ubiquitin folds into a water-stable non-native β-hairpin. Nat Struct Biol. 1995;2:999–1006. doi: 10.1038/nsb1195-999. [DOI] [PubMed] [Google Scholar]
- 10.Dill KA. Dominant forces in protein folding. Biochemistry. 1990;29:7133–7155. doi: 10.1021/bi00483a001. [DOI] [PubMed] [Google Scholar]
- 11.Kim PS, Baldwin RL. Intermediates in the folding reactions of small proteins. Annu Rev Biochem. 1990;59:631–660. doi: 10.1146/annurev.bi.59.070190.003215. [DOI] [PubMed] [Google Scholar]
- 12.Karplus M, Weaver DL. Protein folding dynamics: the diffusion-colision model and experimental data. Protein Sci. 1994;3:650–668. doi: 10.1002/pro.5560030413. [DOI] [PMC free article] [PubMed] [Google Scholar]
- 13.Brown JE, Klee WA. Helix-coil transition of the isolated amino terminus of ribonuclease. Biochemistry. 1971;10:470–476. doi: 10.1021/bi00779a019. [DOI] [PubMed] [Google Scholar]
- 14.Silverman DN, Kotelchuck D, Taylor GT, Scheraga HA. Nuclear Magnetic-Resonance study of the N-terminal fragment of bovine pancreatic ribonuclease. Arch Biochem Biophys. 1972;150:757–766. doi: 10.1016/0003-9861(72)90095-1. [DOI] [PubMed] [Google Scholar]
- 15.Jiménez MA, Herranz J, Nieto JL, Rico M, Santoro J. 1H-NMR and CD evidence of folding of the isolated ribonuclease 50–61 fragment. FEBS Lett. 1987;221:320–324. doi: 10.1016/0014-5793(87)80948-1. [DOI] [PubMed] [Google Scholar]
- 16.Jiménez MA, Rico M, Herranz J, Santoro J, Nieto JL. 1H-NMR assignment and folding of the isolated ribonuclease 21–42 fragment. Eur J Biochem. 1988;175:101–109. doi: 10.1111/j.1432-1033.1988.tb14171.x. [DOI] [PubMed] [Google Scholar]
- 17.Dyson HJ, Merutka G, Waltho JP, Lerner RA, Wright PE. Folding of peptide fragments comprising the complete sequence of proteins. Models for initiation of protein folding II. Myohemerytrhin. J Mol Biol. 1992;226:795–817. doi: 10.1016/0022-2836(92)90633-u. [DOI] [PubMed] [Google Scholar]
- 18.Kuroda Y. Residual helical structure in the C-terminal fragment of cytochrome C. Biochemistry. 1993;32:1219–1224. doi: 10.1021/bi00056a004. [DOI] [PubMed] [Google Scholar]
- 19.Muñoz V, Serrano L, Jiménez MA, Rico M. Structural analysis of peptides encompassing all α-helices of three α/β parallel proteins: Che-Y, flavodoxin and P21-Ras: Implications for α-Helix stability and the folding of α/β parallel proteins. J Mol Biol. 1995;4:648–669. doi: 10.1016/s0022-2836(05)80145-7. [DOI] [PubMed] [Google Scholar]
- 20.Hill R, Degrado W. Solutions structure of alpha D-2, a nativelike de novo designed protein. J Am Chem Soc. 1998;120:1138–1145. [Google Scholar]
- 21.Dyson HJ, Wright P. Defining solution conformations of small linear peptides. A Rev Biophys biophys Chem. 1991;20:519–538. doi: 10.1146/annurev.bb.20.060191.002511. [DOI] [PubMed] [Google Scholar]
- 22.Cox JPL, Evans PA, Packman LC, Williams DH, Woolfson DN. Dissecting the structure of a partially folded protein - circular-dichroism and nuclear-magnetic-resonance studies of peptides from ubiquitin. J Mol Biol. 1993;234:483–492. doi: 10.1006/jmbi.1993.1600. [DOI] [PubMed] [Google Scholar]
- 23.Blanco FJ, Jiménez MA, Herranz J, Rico M, Santoro J, Nieto J. NMR evidence of a short linear peptide that folds into a beta-hairpin in aqueous-solution. J Am Chem Soc. 1993;115:5887–5888. [Google Scholar]
- 24.Blanco FJ, Jiménez MA, Pineda A, Rico M, Santoro J, Nieto JL. NMR solution structure of the isolated N-terminal fragment of protein-G B-1 domain - evidence of trifluoroethanol induced native-like β-hairpin formation. Biochemistry. 1994;33 doi: 10.1021/bi00185a041. 60004-6014. [DOI] [PubMed] [Google Scholar]
- 25.Searle MS, Zerella R, Williams DH, Packman LC. Native-like beta-hairpin structure in an isolated fragment from ferredoxin: NMR and CD studies of solvent effects on the N-terminal 20 residues. Protein Eng. 1996;9:559–565. doi: 10.1093/protein/9.7.559. [DOI] [PubMed] [Google Scholar]
- 26.Doig AJ, Errington N, Iqbalsyah TM. In: Protein Folding Handbook. Part I. Buchner J, Kiefhaber T, editors. Weinhem: WILEY-VCH Verlag; 2005. pp. 247–313. [Google Scholar]
- 27.Alexander P, Fahnestock S, Lee T, Orban J, Bryan P. Thermodynamic analysis of the folding of the streptococcal protein G IgG-binding domains B1 and B2: Why small proteins tend to have high denaturation temperatures. Biochemistry. 1992;31:3597–3603. doi: 10.1021/bi00129a007. [DOI] [PubMed] [Google Scholar]
- 28.Tashiro M, Montelione GT. Structures of bacterial immunoglobulin-binding domains and their complexes with immunoglobulins. Curr Opin Struct Biol. 1995;5:471–481. doi: 10.1016/0959-440x(95)80031-x. [DOI] [PubMed] [Google Scholar]
- 29.Derrick JP, Wigley DB. The 3rd IgG-binding domain from Streptococcal protein-G - an analysis by X-ray crystallography of the structure alone and in a complex with Fab. J Mol Biol. 1994;243:906–918. doi: 10.1006/jmbi.1994.1691. [DOI] [PubMed] [Google Scholar]
- 30.Alexander P, Orban J, Bryan P. Kinetic analysis of folding and unfolding the 56 amino acid IgG-binding domain of Strptoccocal protein G. Biochemistry. 1992;31:7243–7248. doi: 10.1021/bi00147a006. [DOI] [PubMed] [Google Scholar]
- 31.Viguera AR, Martinez JC, Filimonov VV, Mateo PL, Serrano L. Thermodynamic and kinetic analysis of the SH3 domain of Spectrin shows a two-state folding transition. Biochemistry. 1994;33:2142–2150. doi: 10.1021/bi00174a022. [DOI] [PubMed] [Google Scholar]
- 32.Honda S, Kobayashi N, Munekata E, Uedaira H. Fragment reconstitution of a small protein: folding energetics of the reconstituted immunoglobulin binding domain B1 of streptococcal protein G. Biochemistry. 1999;38:1203–1213. doi: 10.1021/bi982271g. [DOI] [PubMed] [Google Scholar]
- 33.Ding K, Louis JM, Gronenborn AM. Insight into conformation and dynamics of protein GB1 during folding and unfolding by NMR. J Mol Biol. 2004;335:1299–1307. doi: 10.1016/j.jmb.2003.11.042. [DOI] [PubMed] [Google Scholar]
- 34.Skwierawska A, Ołdziej S, Liwo A, Scheraga HA. Conformational studies of the C-terminal 16 amino acid residues fragment of the B3 domain of the immunoglobulin binding protein G from Streptococcus. Biopolymers. 2008 doi: 10.1002/bip.21080. in press. [DOI] [PMC free article] [PubMed] [Google Scholar]
- 35.Muñoz V, Thompson PA, Hofrichter J, Eaton WA. Folding dynamics and mechanism of β-hairpin formation. Nature. 1997;390:196–199. doi: 10.1038/36626. [DOI] [PubMed] [Google Scholar]
- 36.Huyghues-Despointes BM, Qu X, Tsai J, Scholtz JM. Terminal ion pairs stabilize the second β-hairpin of the B1 domain of protein G. Proteins Struct. Funct. Bioinf. 2006;63:1005–1017. doi: 10.1002/prot.20916. [DOI] [PubMed] [Google Scholar]
- 37.Wei Y, Huyghues-Despointes BM, Tsai J, Scholtz M. NMR study and molecular dynamics simulations of optimized β-hairpin fragments of protein G. Proteins Struct. Funct. Bioinf. 2007;69:258–296. doi: 10.1002/prot.21494. [DOI] [PubMed] [Google Scholar]
- 38.Alexander PA, Rozak DA, Orban J, Bryan PN. Direct evolution of highly homologous proteins with different folds by phage display: implication for protein folding code. Biochemistry. 2005;44:14045–14054. doi: 10.1021/bi051231r. [DOI] [PubMed] [Google Scholar]
- 39.He YN, Yeh DC, Alexander P, Bryan PN, Orban J. Solution NMR structures of IgG binding domains with artificially evolved high levels of sequence identity but different folds. Biochemistry. 2005;44:14055–14061. doi: 10.1021/bi051232j. [DOI] [PubMed] [Google Scholar]
- 40.Alexander PA, He Y, Chen Y, Orban J, Bryan PN. The design and characterization of two proteins with 88% sequence identity but different structure and function. Proc Natl Acad Sci USA. 2007;104:11963–11968. doi: 10.1073/pnas.0700922104. [DOI] [PMC free article] [PubMed] [Google Scholar]
- 41.Liwo A, Czaplewski C, Pillardy J, Scheraga HA. Cumulant-based expressions for the multibody terms for the correlation between local and electrostatic interactions in the united-residue force field. J Chem Phys. 2001;115:2323–2347. [Google Scholar]
- 42.Liwo A, Khalili M, Czaplewski C, Kalinowski S, Ołdziej S, Wachucik K, Scheraga HA. Modification and optimization of the united-residue (UNRES) potential energy function for canonical simulations. I. Temperature dependence of the effective energy function and tests of the optimization method with single training proteins. J Phys Chem B. 2007;111:260–285. doi: 10.1021/jp065380a. [DOI] [PMC free article] [PubMed] [Google Scholar]
- 43.Provencher SW, Glockner J. Estimation of globular protein secondary structure from circular-dichroism. Biochemistry. 1981;20:33–37. doi: 10.1021/bi00504a006. [DOI] [PubMed] [Google Scholar]
- 44.Plotnikov V, Rochalski A, Brandts M, Brandts JF, Williston S, Frasca V, Lin LN. An autosampling differential scanning calorimeter instrument for studying molecular interactions. Assay Drug Dev Technol. 2002;1:83–90. doi: 10.1089/154065802761001338. [DOI] [PubMed] [Google Scholar]
- 45.Piantini U, Sørensen OW, Ernst RR. Multiple quantum filters for elucidating NMR coupling networks. J Am Chem Soc. 1982;104:6800–6801. [Google Scholar]
- 46.Bax A, Freeman R. Enhanced NMR resolution by restricting the effective sample volume. J Magn Reson. 1985b;65:355–360. [Google Scholar]
- 47.Bax A, Davis DG. Practical aspects of two-dimensional transverse NOE spectroscopy. J Magn Reson. 1985a;63:207–213. [Google Scholar]
- 48.Bartels C, Xia T, Billeter M, Güntert P, Wüthrich K. The program XEASY for computer-supported NMR spectral-analysis of biological macromolecules. J Biomol NMR. 1995;6:1–10. doi: 10.1007/BF00417486. [DOI] [PubMed] [Google Scholar]
- 49.Tiers GVD, Coon RI. Preparation of sodium 2,2-dimethyl-2-silapentane-5-sulfonate, a useful internal reference for NSR spectroscopy in aqueous and ionic solutions. J Org Chem. 1961;26:2097–2098. [Google Scholar]
- 50.Güntert P, Braun W, Wüthrich K. Efficient computation of three-dimensional protein structures in solution from nuclear-magnetic-resonance data using the program DIANA and the supporting programs CALIBA, HABAS and GLOSMA. J Mol Biol. 1991;217:517–530. doi: 10.1016/0022-2836(91)90754-t. [DOI] [PubMed] [Google Scholar]
- 51.Güntert P, Mumenthaler C, Wüthrich K. Torsion angle dynamics for NMR structure calculation with the new program DYANA. J Mol Biol. 1997;273:283–298. doi: 10.1006/jmbi.1997.1284. [DOI] [PubMed] [Google Scholar]
- 52.Bystrov VF. Spin-spin coupling and the conformational states of peptide systems. Progr NMR Spectrosc. 1976;10:41–81. [Google Scholar]
- 53.Güntert P, Wüthrich K. Improved efficiency of protein structure calculation from NMR data using program DIANA with redundant dihedral angle constraints. J Biomol NMR. 1991;1:447–456. doi: 10.1007/BF02192866. [DOI] [PubMed] [Google Scholar]
- 54.Torda AE, Scheek RM, van Gunsteren WF. Time-dependent distance restraints in molecular-dynamics simulations. Chem Phys Lett. 1989;157:289–294. [Google Scholar]
- 55.Pearlman DA, Kollman PA. Are time-averaged restraints necessary for nuclear-magnetic-resonance refinement - a model study for DNA. J Mol Biol. 1991;220:457–479. doi: 10.1016/0022-2836(91)90024-z. [DOI] [PubMed] [Google Scholar]
- 56.Case DA, Darden TA, Cheatham TE, III, Simmerling CL, Wang J, Duke RE, Luo R, Merz KM, Pearlman DA, Crowley M, et al. AMBER8. San Francisco: Univ. of California; 2004. [Google Scholar]
- 57.Weiner SJ, Kollman PA, Nguyen DT, Case DA. An all atom force-field for simulations of proteins and nucleic-acids. J Comput Chem. 1987;7:230–252. doi: 10.1002/jcc.540070216. [DOI] [PubMed] [Google Scholar]
- 58.Mahoney MW, Jorgensen WL. A five-site model for liquid water and the reproduction of the density anomaly by rigid, nonpolarizable potential functions. J Chem Phys. 2000;112:8910–8922. [Google Scholar]
- 59.Ewald PP. The calculation of optical and electrostatic grid potential. Ann Phys. 1921;64:253–287. [Google Scholar]
- 60.Darden T, York D, Pedersen L. Particle Mesh Ewald - an n.log(n) method for Ewald sums in large systems. J Chem Phys. 1993;98:10089–10092. [Google Scholar]
- 61.Ryckaert JP, Ciccotti G, Berendsen HJC. Numerical-integration of cartesian equations of motion of a system with constraints - molecular-dynamics of n-alkanes. J Comput Phys. 1977;23:327–341. [Google Scholar]
- 62.Koradi R, Billeter M, Wüthrich K. MOLMOL: A program for display and analysis of macromolecular structures. J Mol Graphics. 1996;14:51–55. doi: 10.1016/0263-7855(96)00009-4. [DOI] [PubMed] [Google Scholar]
- 63.Dzwolak W, Ravindra R, Lendermann J, Winter R. Aggregation of bovine insulin probed by DSC/PPC calorimetry and FTIR spectroscopy. Biochemistry. 2003;42:11347–11355. doi: 10.1021/bi034879h. [DOI] [PubMed] [Google Scholar]
- 64.Cochran AG, Skelton NJ, Starovasnik MA. Tryptophan zippers: stable monomeric β-hairpins. Proc. Natl. Acad. Sci. USA. 2001;98:5578–5583. doi: 10.1073/pnas.091100898. [DOI] [PMC free article] [PubMed] [Google Scholar]
- 65.Fasman GD. Circular dichroism and the conformational analysis of biomolecules. New York: Plenum Press; 1996. p. 738. [Google Scholar]
- 66.Greenfield NJ. Methods to estimate the conformation of proteins and Polypeptides from Circular dichroism data. Anal Biochem. 1996;235:1–10. doi: 10.1006/abio.1996.0084. [DOI] [PubMed] [Google Scholar]
- 67.Baxter NJ, Williamson MP. Temperature dependence of 1H chemical shifts in proteins. J Biomol NMR. 1997;9:359–369. doi: 10.1023/a:1018334207887. [DOI] [PubMed] [Google Scholar]
- 68.Wüthrich K. NMR of Proteins and Nucleic Acids. New York: John Wiley Press; 1986. p. 292. [Google Scholar]
- 69.Kauzmann W. In: The Mechanism of Enzyme Action. McElroy WD, Glass B, editors. Baltimore, MD: Johns Hopkins Press; 1954. pp. 70–120. [Google Scholar]
- 70.Kauzmann W. Some factors in the interpretation of protein denaturation. Adv Protein Chem. 1959;14:1–63. doi: 10.1016/s0065-3233(08)60608-7. [DOI] [PubMed] [Google Scholar]
- 71.Némethy G, Scheraga HA. Structure of water and hydrophobic bonding in proteins .3. Thermodynamic properties of hydrophobic bonds in proteins. J Phys Chem. 1962;66:1773–1789. [Google Scholar]
- 72.Wertz DH, Scheraga HA. Influence of water on protein-structure - analysis of preferences of amino-acid residues for inside or outside and for specific conformations in a protein molecule. Macromolecules. 1978;11:9–15. doi: 10.1021/ma60061a002. [DOI] [PubMed] [Google Scholar]
- 73.Meirovitch H, Scheraga HA. Empirical-studies of hydrophobicity .2. Distribution of the hydrophobic, hydrophilic, neutral, and ambivalent amino-acids in the interior and exterior layers of native proteins. Macromolecules. 1980;13:1406–1414. [Google Scholar]
- 74.Guy HR. Amino-acid side-chain partition energies and distribution of residues in soluble-proteins. Biophys J. 1985;47:61–70. doi: 10.1016/S0006-3495(85)83877-7. [DOI] [PMC free article] [PubMed] [Google Scholar]
- 75.Scheraga HA. Theory of hydrophobic interactions. J Biomol Struct Dyn. 1998;16:447–460. doi: 10.1080/07391102.1998.10508260. [DOI] [PubMed] [Google Scholar]
- 76.Muñoz V, Henry ER, Hofrichter J, Eaton WA. A statistical mechanical model for β-hairpin kinetics. Proc Natl Acad Sci USA. 1998;95:5872–5879. doi: 10.1073/pnas.95.11.5872. [DOI] [PMC free article] [PubMed] [Google Scholar]
- 77.Muñoz V, Ghirlando R, Blanco JF, Jas GS, Hofrichter J, Eaton WA. Folding and aggregation kinetics of a β-hairpin. Biochemistry. 2006;45:7023–7035. doi: 10.1021/bi052556a. [DOI] [PubMed] [Google Scholar]


