Abstract
This paper presents a semiautomatic method for the registration of images acquired during surgery with a tracked laser range scanner (LRS). This method, which relies on the registration of vessels that can be visualized in the pre- and the postresection images, is a component of a larger system designed to compute brain shift that occurs during tumor resection cases. Because very large differences between pre- and postresection images are typically observed, the development of fully automatic methods to register these images is difficult. The method presented herein is semiautomatic and requires only the identification of a number of points along the length of the vessels. Vessel segments joining these points are then automatically identified using an optimal path finding algorithm that relies on intensity features extracted from the images. Once vessels are identified, they are registered using a robust point-based nonrigid registration algorithm. The transformation computed with the vessels is then applied to the entire image. This permits establishment of a complete correspondence between the pre- and post-3-D LRS data. Experiments show that the method is robust to operator errors in localizing homologous points and a quantitative evaluation performed on ten surgical cases shows submillimetric registration accuracy.
Index Terms: Brain shift, feature extraction, image-guided neurosurgery (IGNS), image registration, laser range scan (LRS)
I. Introduction
How to measure and compensate for brain shift during surgical procedures is an active area of research in image-guided neurosurgery (IGNS). Studies have shown that the brain could deform more than 2 cm during surgery due to a number of reasons ranging from the procedure itself (e.g., resection), loss of cerebrospinal fluid (CSF), or the administration of drugs. Deformations of this magnitude greatly reduce the usefulness of standard IGNS navigation systems, which are based on preoperative images. To address these issues, approaches have been proposed that rely on biomechanical models to predict the deformation of intraoperative images during the procedure [1]–[7]. But, all of these methods require some type of intraoperative brain movement measurements as input.
Methods that have been proposed to estimate brain movement intraoperatively, include intraoperative MR images [8], [9], ultrasound (US) [10]–[12], stereoimages [13], [14], or laser range scanners (LRSs) [15]–[21]. Intraoperative MR images can either be acquired with interventional scanners, which are in the operation room [8], [9], or by moving the patient to an adjacent room in which the scanner is located [22]. Large fixed-coil interventional MRs are expensive, require special equipment, and limit surgeons' access to the operating field [10]. Smaller open magnets typically suffer from poor resolution and geometric distortions. Because of this, it is unlikely that this type of intraoperative imaging will become widely available. An alternative is to build operating rooms (ORs) adjacent to the scanning room. During the procedure, the patient can be moved back and forth between the rooms and scans acquired. However, this complicates the procedure and can add up to 10 min for each scan [22]. US is a cheaper solution but it suffers from relatively poor image quality. Nevertheless, it has been used by several groups to register pre- and intraoperative images (see, for instance, [10]–[12], [23], and [24]). The authors in [10] estimate brain shift around the tumor by computing a rigid-body registration between the tumor delineated in the preoperative MR volume and the 3-D US volumes acquired before and after opening of the dura but prior to resection. Reinertsen et al. [12] rely on vessels segmented in preoperative MR angiography volumes and vessels visible in intraoperative Doppler US images. The authors state that two US volumes are acquired. The first one prior to opening of the dura and the second one during the procedure but no details are provided on whether or not these images were acquired after resection. The authors compare registration results obtained with: 1) a rigid-body transformation computed with points selected manually; 2) a rigid-body transformation computed with vessel points extracted automatically in the MR and US images; and 3) a nonrigid transformation computed with the vessel points. To compute the nonrigid transformation, they use a modified iterative closest point approach [25], in which outliers are eliminated through a trimmed least squares approach. Once correspondence is established, thin-plate splines are used to compute the transformation. Results show that the nonrigid transformation improves things only marginally over the rigid-body transformation computed with manually selected points, thus suggesting that in the dataset used in that study, little deformation happened between the pre- and intraoperative images. Video images have been proposed to register pre- and intraoperative data as early as 1997 by Nakajima et al. [26]. In this paper, vessels segmented in preoperative MR images were registered to surface vessels visible in the intraoperative video images and the system was tested on images acquired after opening of the dura. This approach was extended by Sun et al. [13], who used a pair of cameras. They demonstrate their ability to track the shape of the cortical surface after the opening of the dura on two neurosurgical cases. A similar approach is followed by Skrinjar et al. [27]. More recently, DeLorenzo et al. [14], [28] have used a pair of stereoimages and they register preoperative images with intraoperative video images using a combination of sulcal and intensity features. They propose a method by which registration and camera calibration are performed simultaneously and show that this approach permits to correct calibration errors. In this paper, sulcal grooves were segmented by hand and the system was applied to patients undergoing stage 1 epilepsy surgery. This is a procedure that requires the opening of the dura for the placement of an array of intracranial electrode on the surface of the brain but it does not require resection. At our institution, a tracked LRS with an integrated high-resolution digital camera is utilized to capture the visual appearance as well as the 3-D geometry of the brain surface during surgery. Briefly described (more detailed information is provided in [21]), the tracked LRS captures a 2-D picture of the field of view and a 3-D point cloud (i.e., a set of surface points for which the x-, y-, and z-coordinates are known). The scanner also provides a mapping between the two such that a textured point cloud can be generated. The 3-D coordinates of any point and its corresponding coordinates in the field of view 2-D image can thus be computed. The scanner is also tracked, which means that the 3-D coordinates of a point acquired at time t1 can be related to the coordinates of a point acquired at time t2 even if the scanner position changes in the t1–t2 interval, as happens often during surgical cases. Tracking brain motion thus requires only establishing a correspondence between points acquired at times t1 and t2. If this correspondence is established, the 3-D spatial coordinates of a point at time t1 and its spatial coordinates at time t2 can be obtained, which permits computing its 3-D displacement.
As discussed earlier, a number of methods have been proposed to measure brain shift during surgery but, to the best of our knowledge, none of these methods have been extensively evaluated on datasets acquired before and after tumor resection. Clinical evaluation has been largely limited to measuring cortical or tumor shift following craniotomy or opening of the dura. Although difficult, this is considerably less challenging than attempting to measure shift during the case after resection because resection creates a void, which, in turn, substantially alters the shape of the brain. Because parts of the brain sag to fill in the void, portions of the brain not visible in the preresection images can enter the field of view and become visible in the postresection images. Parts of the brain visible in the preresection images can also slide under the skull and become invisible in the postresection images. Bleeding, which changes the contrast of the images, further complicates the task. Due to these difficulties, methods proposed so far to measure intraoperative brain movement are unlikely to succeed. For instance, simply tracking the surface of the cortex to measure sagging or bulging does not provide information on the displacement of the points parallel to the cortical surface. The resolution of US images permits only identifying relatively large vessels. As discussed by Reinertsen et al. [11], [12], this leads to transformations that are accurate close to these large vessels but less so further away from the vessels, thus suggesting the need for intraoperative imaging techniques, which have the spatial resolution required to visualize small cortical vessels. Intensity-based methods as the ones we have proposed in earlier work [16], [18] are also not robust enough to deal with the very large differences observed in clinical images.
To address these issues, we have proposed a method in [19] that is based on manually delineated vessels, and its potential was shown on a limited number of cases. Here, we expand on this work. As others have done [11], [12], [26], we use vessels to register the images but our research differs in several important ways. First, we use a tracked LRS that provides us with simultaneous high-resolution 2-D and 3-D information. DeLorenzo et al. [28] have shown the importance of online calibration when using stereocameras. The algorithm they propose achieves this but is time-consuming (more than 20 min on a modern PC). Our approach does not require online calibration. Second, we use a semiautomatic method for the extraction of the vessels in the image. This method is inspired by the work of Wink et al. [35]. In this approach, vessels are enhanced using the vesselness filter proposed by Frangi et al. [31]. A minimum cost path is then found between starting and ending points given by users. Wink et al. used a multiscale search method to follow vessels with a constant width. We use a scalar cost function based on maximal filter response but we add a term that favors paths, which are in the center of the vessels, as suggested by Bitter et al. [36]. This method is fast, robust to user input error, and permits identifying large and small vessels over the entire field of view. Speed and robustness are important because the system will need to be used by surgeons under time pressure in the operating room (OR). Third, we use the robust point matching (RPM) algorithm proposed by Chui et al. [29] to match the vessels as opposed to a modified iterative closest point approach proposed in [12]. Finally, we validate our approach on ten intraoperative tumor resection datasets. This is a unique dataset in which optically tracked pre- and postresection 2-D and 3-D information has been acquired.
The rest of the paper is organized as follows. Section II, which describes the method, first presents the data used in the study. The method used to find the vessel centerlines is then described and an introduction to the RPM algorithm used to register the images is provided. This section concludes with a description of the validation methods used to evaluate our approach. Results obtained on ten tumor resection cases are presented in Section III. Conclusions and suggestions for future work are detailed in Section IV.
II. Method
A. Data and Data Acquisition Protocol
A high-resolution commercial LRS (RealScan3D USB, 3D Digital, Inc., Bethel, CT) system is used in this study. The device is capable of generating 500 000 points with a resolution of 0.15–0.2 mm at the approximate range used during neurosurgery. This resolution varies slightly according to the distance between the camera and the patient. The 3-D position of each point on the scan is calculated via triangulation. At the same time, a digital camera (Canon Optix 400) acquires a texture image with a resolution up to 2592 × 1944 pixels. The texture image and the 3-D point cloud are registered. A complete dataset thus includes a set of image pixels with coordinates (u, v) and a series of points with coordinates (x, y, z). The (u, v) coordinates of any (x, y, z) point can be computed and vice versa.
The following protocol, which was approved by the Vanderbilt Institutional Review Board, was used to acquire data from consented patients. After opening of the dura, the LRS system, which is mounted on the adjustable arm or a monopod, is placed within 20–30 cm of the patient. A preresection scan is taken that takes on the order of 1 min. This includes moving into the field and collecting the data. The system is removed from the field and the procedure proceeds normally. After tumor extraction, a postresection scan is acquired by moving the scanner back into place above the craniotomy. Because the scanner is tracked, the pre- and postresection positions do not need to be exactly the same. More details about the data acquisition procedure can be found in [21]. The first image in Fig. 1 shows a patient (B) in the OR with the tracked LRS (A) positioned on the top of the craniotomy. The traditional IGNS (C) can be seen on the opposite side of the scanner. The second image in Fig. 1 shows the panel we have developed (D) in house for data collection and processing.
Fig. 1.
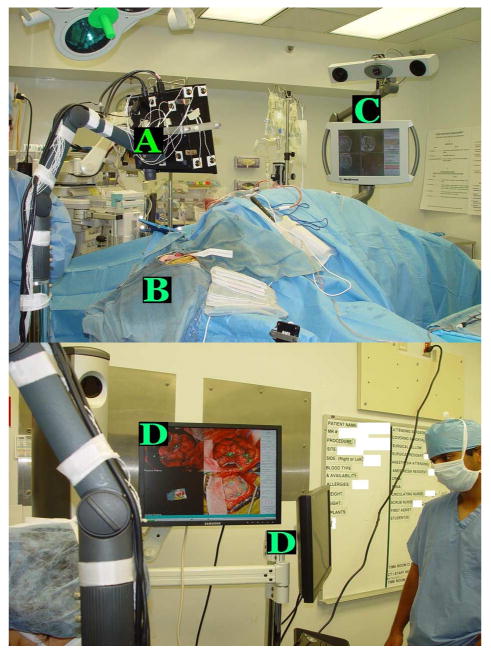
Top panel shows the tracked LRS (A) positioned on top of the patient (B). The traditional IGNS system (C) can be seen on the right of the image. The bottom panel shows the user interface (D) developed in house to permit data collection.
Fig. 2, which shows typical preresection (left panels) and postresection (right panels) images, illustrates the complexity of the task at hand. In this figure, the top panels are the 2-D images of patient #2 acquired with the camera and the bottom panels are the textured point clouds, i.e., 3-D surfaces acquired with the laser scanner. Pre- and postresection images are acquired with the scanner in a different position and orientation, and the resection has created a large hole in the middle of the image, which induces substantial brain deformation. Blood and the lighting conditions also change the appearance of the images. Additionally, the brain shifts with respect to the craniotomy during the procedure. As a consequence, parts of the brain visible in the first image slide under the skull and are hidden in the second image. The same phenomenon makes parts of the brain hidden under the skull in the first image appear in the second.
Fig. 2.
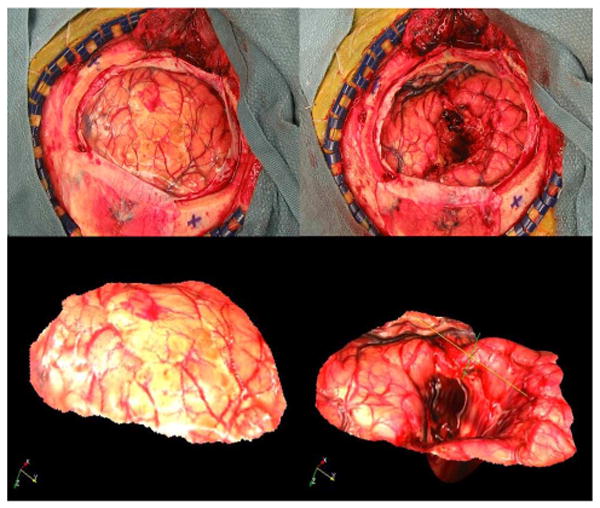
Representative example of a pre- and postresection image pair. The top panels are the 2-D images, the bottom panels are the textured point clouds of patient #2 reported in the study.
B. Extraction of Vessel Centerlines
Fig. 2 suggests that the most reliable features that can be extracted from the pre- and postresection images are the center-lines of the vessels. Preliminary results presented in [20] also suggest that registration based on these features leads to accurate results. But centerlines were extracted manually in [20]. This is both lengthy and inaccurate. Here, the process is largely automated with a method based on a minimum cost path algorithm [30]. This algorithm requires the computation of a cost matrix, which is automated, and the selection of one starting and one ending point for each vessel segment to be used for registration, which is done manually. The next section describes the method used to create the cost matrix.
1) Creation of Cost Matrix
The cost matrix used to find our minimum cost path is computed using two terms derived from the images. The first one is related to the vesselness of a point in the image as defined by Frangi et al. [31]. The second one is based on a distance map computed on an edge image. In their work, Frangi et al. propose a multiscale filter based on the hessian of the image, which can be used to enhance tubular structures. The approach they propose is to: 1) convolve the image with Gaussian filters with various standard deviations; 2) compute the hessian of the smoothed images, defined as
| (1) |
in which Iij is the second spatial derivative of the image in the i- and then j-directions; and 3) compute the eigenvalues of the hessian. An analysis of the values of these eigenvalues permits to determine the type of structure a particular pixel belongs to. Pixels that pertain to tubular-like structures that are bright on a dark background will satisfy the following conditions:
| (2) |
Based on this observation, the vesselness filter Frangi et al. proposed is shown at the bottom of this page as (3).
| (3) |
The first term in this equation is large when λ1 is small and λ2 is large. The second term, which is called the “second-order structureness,” is large for nonbackground pixels. To detect vessels of various dimensions, the filter is applied to images that have been convolved with Gaussian filters whose standard deviation is changed from small to large. The vesselness filter responds to small vessels in an image blurred with a Gaussian filter with a small standard deviation. It responds to large vessels in an image blurred with a Gaussian filter with a large standard deviation. The coefficients β and c are chosen experimentally. Here, these were chosen as 0.5 and 0.05 of the maximum intensity value in the image, respectively. In this application, six standard deviations are used, ranging from one pixel to six pixels, and the cost term associated with the vesselness feature is defined as
| (4) |
in which the value of the weight wk is −0.5 for the standard deviation that produces the largest response and zero for all the others.
Fig. 3 shows typical results obtained with this approach. The input image is shown in the top left panel; the cost image is shown in the top right panel. While the vesselness filter clearly enhances the vessels, the figure also shows that the centerline of the vessels is not localized precisely. The filter also responds to structures that are not vessels. To address this issue, a second term is added to the cost matrix. First, an edge image is computed using a canny edge detector, then a distance map is computed from the edge image. In this distance map, intensity values are zero on the edges and increase when moving away from the edges. The middle left panel in Fig. 3 shows the edge image. The distance map image is shown in the middle right panel; in this image, darker intensity values correspond to larger distances. To better visualize the distance term of the cost function, the bottom left panel shows the distance map masked by a binary map obtained by thresholding the vesselness image using a threshold equal to 0.96. The overall cost matrix is computed as
Fig. 3.
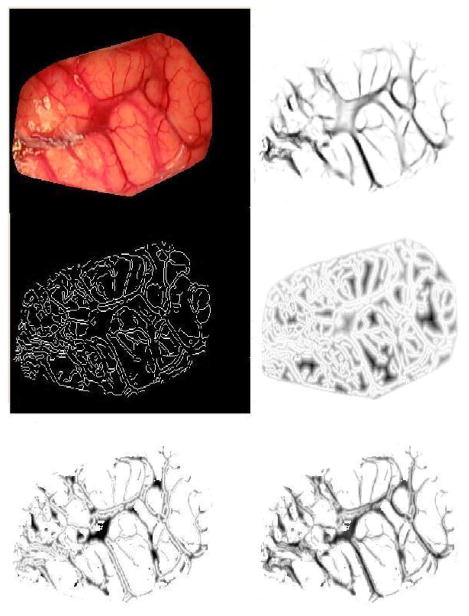
Illustration of the cost matrix used to find vessels. The top left panel shows the original image of patient #7 reported in the study. The top right panel shows the vesselness image. The middle left panel is the edge map. The middle right panel shows the distance map computed from the edge map. The bottom left panel shows the distance map masked by a vessel mask obtained by thresholding the vesselness image using a threshold equal to 0.96. The bottom right panel shows the final cost matrix.
| (5) |
in which wd is equal to −0.5. The canny edge detector of Matlab 7.0 (MathWorks, Inc., Natick, MA) was used in which the high threshold is selected automatically depending on image characteristics. The low threshold is set to 0.4 times the high threshold. The overall cost matrix thus weighs equally the vesselness and the distance features. The resulting cost image is shown in the bottom right panel of Fig. 3. As this image shows, the centerline of the vessels tends to correspond to pixels with the lowest intensity values.
2) Centerline Extraction
Vessel segmentation is then achieved semiautomatically. A graphical user interface has been developed that permits visualizing pre- and postresection images side-by-side. Roughly, homologous starting and ending points are localized for vessel segments visible in these images by the end user. When a pair of starting and ending points has been identified, the minimum cost path between these points is computed automatically using Dijkstra's shortest path algorithm [30]. Fig. 4 illustrates the process. The left panel shows one of the images acquired with the system (the cortical surface has been manually extracted from the original images). The selected starting and ending points are shown in yellow and white, respectively, on the left panel. The vessels extracted by the minimum cost path algorithm are shown on the right. In its current state, the system requires the user to select one pair of starting and ending points at a time. When the pair is selected, the vessel segment that joins them is computed. Computation of an optimal path between a starting and an ending points takes less than 1 s on a 3-GHz Pentium Duo-Core Machine. The process is repeated until vessel segments that cover the useable portion of the image are segmented. This figure also shows that the method can be used to segment large or small vessels. Experiments have shown that vessels as small as 0.175 mm in diameter can be extracted.
Fig. 4.
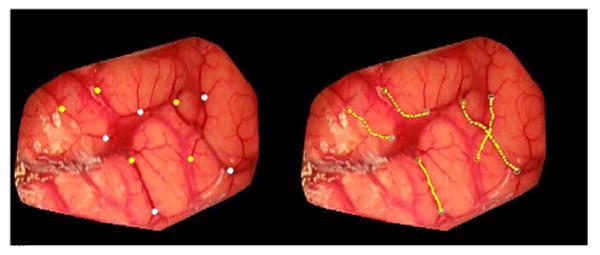
Example of centerlines extraction from a preresection image of patient #7. Yellow and white point on the left image are starting and ending points, respectively. The computed centerlines are shown in yellow on the right panels.
C. Vessel Registration
Once vessels have been segmented, they are nonrigidly registered. This is done with the RPM proposed by Chui et al. [29], and their Matlab implementation (http://noodle.med.yale. edu/∼chui/tps-rpm.html) was used. The basic idea in this algorithm is to alternate between a fuzzy assignment step and a registration step. Here, all the vessel centerlines detected in the previous step form two sets of points (one set of points in the preresection image and the other in the postresection image). Each point in one of the sets, say set 2, is assigned to one or several points in the other set. Once the assignment is done, a transformation that registers the points in set 2 to the corresponding points in set 1 is computed. If a point in set 2 is assigned to more than one point in set 1, a virtual point computed as the weighted centroid of these points is used to compute the transformation. The fuzzy assignment is computed with the soft assign algorithm proposed by Gold et al. [32]
| (6) |
in which V: {va, a = 1, 2,…, K} and X : {xi, i = 1, 2,…, N} are the two sets of points, f is the transformation used to register the two sets of points, and T is called the temperature parameter, which is introduced to simulate physical annealing. Following the recommendations given in [32], an initial value of 0.5, which is reduced from iteration to iteration, is used here. Thus, (6) establishes a fuzzy correspondence between points in set V and points in set X. Because the value of T decreases over time, the fuzziness of the assignment decreases as the algorithm progresses. The major advantage of this fuzzy assignment is that it permits handling datasets with different cardinality and it also permits to handle outliers. At each iteration, after the correspondence is determined, a thin-plate spline-based nonrigid transformation f is computed, which solves the following least squares problem:
| (7) |
in which
can be considered as a virtual correspondence for va. λ is a regularization parameter, the value of which is changed over time. The algorithm starts with a transformation that is very smooth (heavily regularized). As the algorithm evolves and correspondence improves, the regularization constrain λ is progressively relaxed.
D. Overall Registration Procedure
Fig. 5 illustrates the overall process used to register the pre- and postresection images and compute the brain shift that has occurred during the procedure. In this figure, the top panels show the images, as acquired with the LRS. As seen before, these images contain more than the cortical surfaces. The four points visible on the skull (black crosses) are fiducial points drawn on the skull by the neurosurgeon. These are used to compute a projective transformation to initialize the process; this transformation is called T1. The cortical surfaces are then extracted manually and shown in (c) and (d). Next, the feature maps are computed on the pre- and postresection cortical images, as shown in (e) and (f). Starting and ending points are identified manually, and vessel centerlines are extracted, as shown in (g) and (h). Using the centerlines, the transformation that registers the two cortical images is computed; this transformation is called T2. Panel (i) shows the preresection image registered to the postresection image. A group of vessels was drawn in (i) and copied to (j), which show a good correspondence with the vessels in image (j).
Fig. 5.
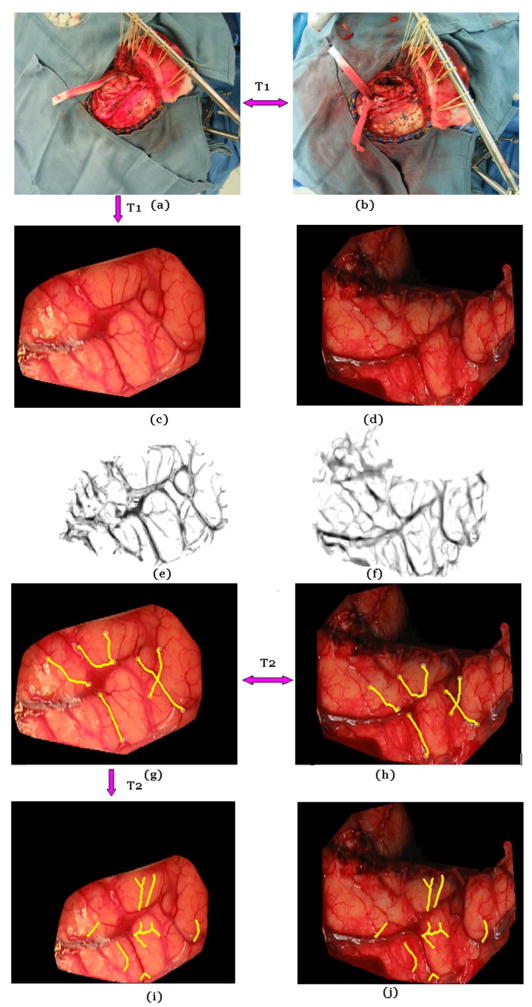
Illustration of the various steps involved in the registration process. Panels (a) and (b) show the pre- and postresection image for patient #7. These are registered with a projective transformation T1. (c) and (d) The brain surface is extracted from the original images manually. (e) and (f) Feature maps are computed. (g) and (h) Corresponding vessels are detected, and the nonrigid transformation T2 is computed. (i) and (j) T2 is applied to the image in panel (g) to generate the registered images.
An additional transformation T3 (see [20]) not shown here relates a point in the image to a 3-D coordinate. The shift at any point in the image is computed as the difference in the 3-D coordinates of this point in the preresection scan and its corresponding 3-D coordinates in the postresection scan.
E. Validation Strategy
The method that has been used to validate the approach relies on the selection of homologous points. A number of points have been selected manually on the pre- and postresection images. These are points that are relatively easy to identify in both images, which include vessel intersections, end points, etc. The number of homologous points varies from case to case, depending on what is visible in the images. Using the registration transformations described earlier, the points in the preresection images are projected onto the postresection image and a registration error that is called target registration error (TRE) [34] is computed as
| (8) |
in which xi and yi are the points selected in the preresection and postresection images, respectively. The transformation T is the transformation obtained by concatenating all the elementary transformations discussed previously.
III. Results
A. Vessel Centerline Extraction With and Without Distance Term
Fig. 6 illustrates the effect of the distance term in the cost function used to detect the vessel centerlines. The top left panel shows the entire image and the top right panel shows a zoomed version of the region within the box. In the right panel, the white points are the path obtained with the vesselness feature alone. The green points are the path obtained when both the vesselness and the distance term are used. Clearly, the additional distance term favors points that are on the centerline. The effect of this term is more important for large vessels than for small ones.
Fig. 6.
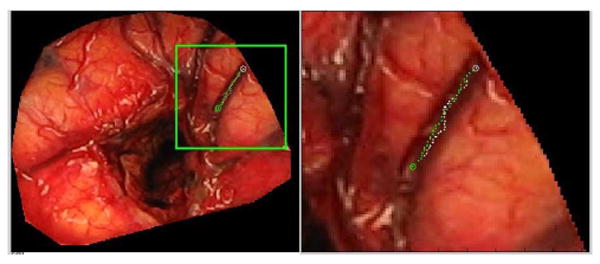
Difference in centerline extraction without (green points) and with (white points) the distance term using patient #3 data.
B. Sensitivity of Process to Selection of Points
The main manual input required by the algorithm is the selection of the starting and ending points in the pre- and postresection images. To test the sensitivity of the algorithm to the selection of these points, the following experiment was performed. One typical pre- and postresection set of images was selected. In these images, a series of starting and ending points was manually picked. The position of the starting and ending points was then perturbed using random numbers drawn from Gaussian distributions with zero mean and standard deviation ranging from 2 to 5 pixels. For each standard deviation, the process was repeated 100 times. For each set of points, the transformation that registers the pre- and postresection images was computed. An additional registration in which the position of the points was not perturbed was computed and used as a baseline. The difference between the baseline displacement and the displacement obtained with each of the transformations was computed pixel by pixel and averaged for each standard deviation. Fig. 7 shows average difference maps obtained for the various standard deviations used in this sensitivity study.
Fig. 7.
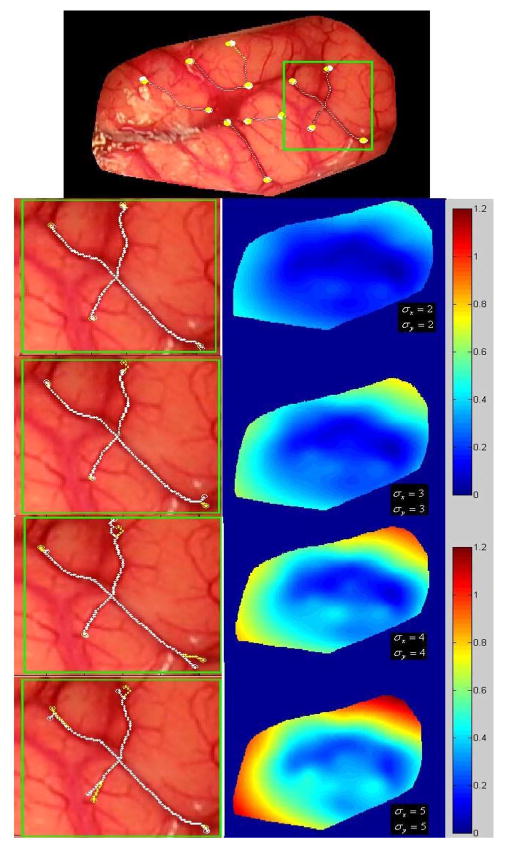
Effect of starting and ending points displacement on the registration. Top panel: original image of patient #7. The other panels show the region within the green square magnified (on the left) and the difference maps on the right. From top to bottom, the standard deviation used to perturb the points was increased from 2 to 5 pixels.
These results show submillimetric differences for standard deviations up to 3 pixels. When the standard deviation increases, some parts of the image experience an error that reaches 1 mm over regions that are far away from any vessels. This is because the transformation is not constrained over these regions. In practice, it is therefore important to select vessels, which cover as much of the field of view as possible.
The left panels in this figure show displacements that correspond to 2–5 pixels. It illustrates the fact that a displacement of 3 pixels in the x- and y-direction is easily noticeable. It also shows that even if the starting and ending points are not selected correctly, most of the trajectory between the points is the same. Thus, only a few of the feature points used for registration are different, which makes the process robust to operator error.
C. Qualitative Results
Fig. 8 shows a pre- and a postresection surface. In this figure, white and green homologous points have been selected on the pre- and postresection images, respectively. The tip of the arrows is the position to which the white dots have been moved using the registration transformations. As can be seen, these are close to the corresponding green points.
Fig. 8.
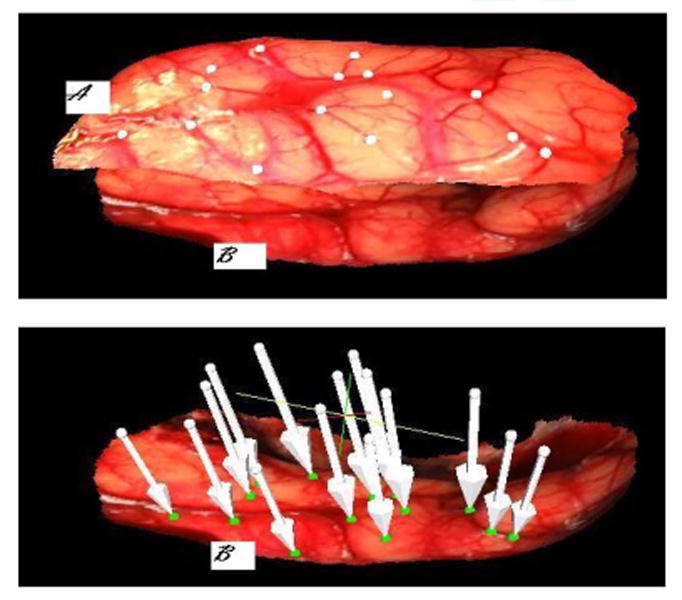
Top panel. (A) Texture surface obtained before resection. (B) Texture surface obtained after resection of patient #7. The white points on the preresection scan and the green points in the postresection scan were selected manually as corresponding points. On the bottom panel, the white arrows show where each white point has been mapped onto the postresection scan.
Fig. 9 presents another set of results in which the pre- and postresection-textured surfaces are shown. The color-coded surface (A) and gray-level surface (B) are the preresection and postresection scans, respectively. The top left panel shows these surfaces before registration. After registration, (A) is deformed as (C) and is shown together with (B) in the top right and bottom left panel. The bottom right panel shows a checkerboard image of the registered pre- and postresection images indicating, at least visually, the quality of the registration. Interaction time to select homologous points varies between 30 and 60 s, depending on the number of line segments being selected. Computation of optimal paths, which, as discussed before, takes about 1 s per path, can be computed while manual selection for new vessel segments is ongoing. As currently implemented, the computation of the registration transformations takes between 1 and 5 min, depending on the number of points in each of the two points sets used by the RPM algorithm.
Fig. 9.
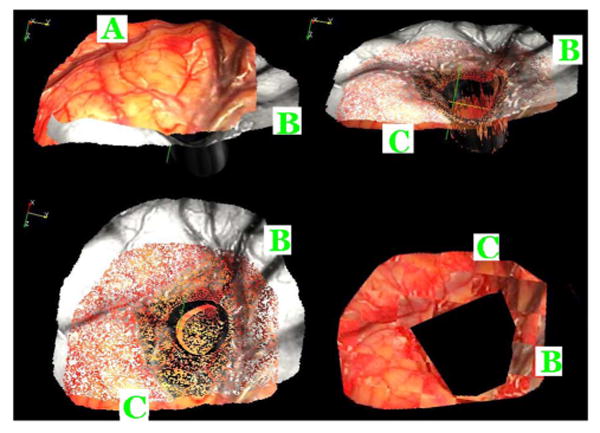
Top left panel shows the (A) preresection (color) and (B) postresection (gray) textured surface of patient #3. The top right panel shows these two surfaces registered to each other using the proposed method. (C) Deformed preresection surface. The bottom left panel shows the same but from a different angle. The bottom right panel shows a checkerboard image generated with the registered pre- and postresection textured images, which indicates a good registration between the two.
D. Quantitative Results
Table I presents quantitative results obtained with ten patients (four men and six women).
Table I.
Average TREs and Estimated Brain Surface Shift for Ten Tumor Resection Cases
| Patient # | Age (yr)/Sex | Craniotomy Diameter (cm) | Lesion Size (cm3) | Number of targets | Maximal TRE (mm) | Mean TRE (mm) | Maximal shift (mm) | Mean shift (mm) |
|---|---|---|---|---|---|---|---|---|
| 1 | 22/F | 7.7 | 5.2 × 6.2 × 6.0 | 15 | 2.79 | 1.13 | 27.51 | 23.57 |
| 2 | 52/M | 8.3 | 4.9 × 5.6 × 5.0 | 15 | 2.24 | 1.06 | 20.68 | 15.13 |
| 3 | 58/M | 4.7 | 3.7 × 3.5 × 4.1 | 9 | 1.77 | 0.75 | 10.34 | 8.50 |
| 4 | 77/M | 5.0 | 3.4 × 3.6 × 2.0 | 6 | 2.73 | 1.28 | 10.81 | 9.15 |
| 5 | 57/F | 3.5 | 1.0 × 1.4 × 2.0 | 6 | 0.84 | 0.44 | 3.45 | 1.89 |
| 6 | 56/F | 4.5 | 4.7 × 3.2 × 4.0 | 18 | 2.49 | 0.92 | 5.59 | 2.72 |
| 7 | 75/F | 6.1 | 5.0 × 5.0 × 5.0 | 15 | 2.92 | 0.62 | 15.27 | 13.01 |
| 8 | 23/F | 6.4 | 4.0 × 3.0 × 3.0 | 18 | 2.02 | 0.88 | 3.92 | 2.97 |
| 9 | 46/F | 4.3 | 3.0 × 3.0 × 3.0 | 9 | 1.94 | 0.70 | 9.40 | 8.07 |
| 10 | 26/M | 9.0 | 6.9 × 4.0 × 4.0 | 15 | 1.97 | 0.91 | 12.45 | 8.99 |
| Average | 49 | 5.95 ± 1.87 | 76.96±61.37 | 13±5 | 2.17±0.62 | 0.87±0.25 | 11.94±7.58 | 9.40±6.60 |
In addition to the mean and max TRE values for each case, it lists the volume of the tumor, the size of the craniotomy, and the measured surface shift. Lesion size was measured from preoperative MR images acquired for each subject. The mean cortical surface shift was calculated as the average distance between human-selected homologous target points on textured laser range scans. These results show an average TRE, which is submillimetric, and an average surface displacements on the order of 1 cm with a maximum value of 2.7 cm.
Homologous points used to validate the results are selected on vessels or at the intersection of vessels because these are the only easily discernible features in the images. Some of these points may also be included or are in close proximity to points that have been used for the registration. In this application, this problem is difficult to avoid because of the difficulty of selecting homologous points in uniform areas. But, because the RPM algorithm is used: 1) a strict correspondence between points in the two images is not established and 2) the thin-plate spline transformation does not match the point pairs exactly. There is thus a nonzero registration error, even for points included in the set used for the computation of the transformation itself. Furthermore, in practice, care is taken to select vessel segments that cover the useable portion of the image, thus constraining the transformation. It is therefore reasonable to assume that the error values that are being reported are representative of the errors over the entire image but that a slightly larger error could be observed over regions in which feature points are not selected. Fig. 10 plots the TRE value for 126 points versus their distance to the closest point included in the set of points used to compute the transformations. This figure shows a weak but nevertheless significant (r = 0.35) correlation between TRE and distance to feature.
Fig. 10.
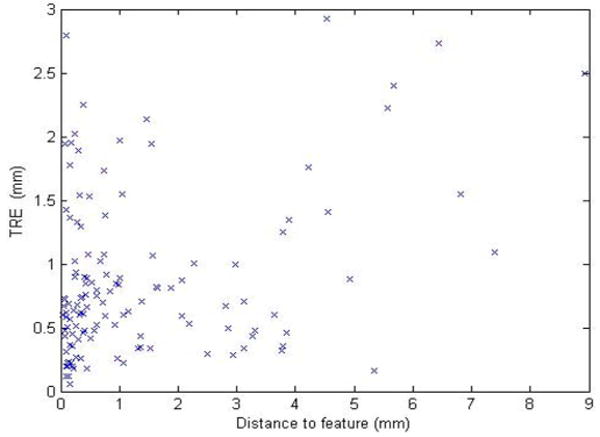
Plot of TRE versus the distance to closest feature point used to compute the registrations.
IV. Discussion and Conclusion
Accurate estimation of brain shift occurring during surgery is critical for IGNS. Mathematical models capable of predicting shift occurring away from the surface are currently being developed [33] but these models need intraoperative brain measurements as input. A number of methods have been proposed over the years to measure brain shift, which occurs when the dura is opened, but this is the first study that extensively reports on measurements made after tumor resection. Tracked probes are a possible solution to acquire this information but this method often leads to sparse information as homologous points need to be identified on the cortical surface before and after resection. Furthermore, drastic changes in the appearance of the brain surface between pre- and postresection make the selection of homologous points a challenging task. The tracked LRS approach presented in this article is minimally disruptive as it requires only moving the scanner in and out of the field to acquire datasets, which takes on the order of 1 min. The LRS also generates dense datasets, potentially providing the model with displacement values over the entire exposed surface. The key issue to accurate estimation of surface displacements is the registration of the LRS datasets. Because the 3-D point clouds are registered to high resolution 2-D images, this problem can be solved by registering the 2-D images. It has been shown [18], [20] that registering the 3-D datasets via the 2-D images does, in fact, produce results that are superior to those obtained when registering the 3-D point clouds directly. The major difficulty to be addressed is the difference observed in the images before and after resection in most clinical cases. Except when tumors are very small, resection produces differences in the images that are such that intensity-based methods are ineffectual. Preliminary results published earlier on a smaller dataset [20] have shown that a promising alternative is to register images using vessels delineated in the images. But identifying vessels in pre- and postresection images is relatively difficult, time-consuming, prone to errors, and not practical in the OR. In this paper, a practical solution is proposed. The feature maps can be computed rapidly, pre- and postresection images presented to the physicians and starting and ending points identified. Because the system computes a minimum cost path between starting and ending points, very accurate selection of the points is not critical. The results that have been obtained on tumor resection cases demonstrate the accuracy of the process with an overall TRE, which is submillimetric. The data gathered from the ten patients included in the study also show significant brain shift. The average observed brain shift is about 1 cm with a standard deviation of 6.6 mm. Large shifts superior to 1 cm have been observed in three of the ten cases, thus corroborating the need for intraoperative updating of preoperative information.
The method described in this paper will be part of the user interface of a comprehensive system designed for intraoperative brain shift correction. Several improvements need to be made to the current method before it can be used clinically. First, the craniotomy needs to be extracted automatically from the complete images shown in Fig. 2. Second, tradeoffs between speed and accuracy need to be studied. With the current implementation of the RPM algorithm, computing the transformation that registers the images and applying that transformation to the image takes between 1 and 5 min, depending on the number of points used and the size of the images. This algorithm is currently being reimplemented in the C++ programming language and the effect of sample sized is being analyzed. Our algorithm currently uses all the points on the vessel centerlines. Downsampling these may speed things up substantially while not having a major impact on accuracy. Finally, it would greatly facilitate the process if the starting and ending points of vessel segments could be also identified automatically. Work is currently ongoing to localize these and develop methods that will automatically link them to form vessel trees. If this can be achieved, a fully automatic method for intraoperative brain shift estimation will have been developed.
Acknowledgments
The authors thank the Department of Neurosurgery at Vanderbilt University and the OR staff for their support of the data collection.
This work was supported by the National Institutes of Health (NIH)–National Institute for Neurological Disorders and Stroke under Grant R01 NS049251-01.
Biographies
Siyi Ding (S'08) received the M.S. degree in pattern recognition and intelligence system from the Pattern Recognition and Image Processing Institute, Shanghai Jiaotong University, Shanghai, China. She is currently working toward the Ph.D. degree at Vanderbilt University, Nashville, TN.
She is currently a Research Assistant in the Medical Image Processing Laboratory and the Biomedical Modeling Laboratory, Vanderbilt University. She was involved in the field of rocket tracking, texture analysis, and medical image segmentation. Her current research interests include medical image registration, vessel segmentation, motion tracking, and their applications in image-guided neurosurgery.

Michael I. Miga (M'99) received the B.S. and M.S. degrees in mechanical engineering from the University of Rhode Island, Kingston, in 1992, and 1994, respectively, and the Ph.D. degree in biomedical engineering from Dartmouth College, Hanover, NH, in 1998.
In 2000, he joined the Department of Biomedical Engineering, Vanderbilt University, Nashville, TN, where he is currently an Associate Professor and also the Director of the Biomedical Modeling Laboratory, which focuses on developing new paradigms in detection, diagnosis, characterization, and treatment of disease through the integration of computational models into research and clinical practice.
Jack H. Noble received the M.S. degree in electrical engineering in 2008 from Vanderbilt University, Nashville, TN, where he is currently working toward the Ph.D. degree at the Medical Image Processing Laboratory.
His primary research areas include medical image processing, image segmentation, registration, statistical modeling, and image-guided surgery techniques.

Aize Cao (M'08) received the B.E. and M.S. degrees from China, and the Ph.D. degree from Singapore in 2005.
She is currently a member of the research staff at Vanderbilt University Institute of Imaging Science and the Department of Psychiatry, Vanderbilt University Medical Center, Nashville, TN. Her research interests include image registration, segmentation, and pattern recognition. Her current research work includes functional MRI quality assurance, motion tracking of subjects inside MRI scanner, and looking at the brain structure and functional activities in drug abused study, child obesity, and bipolar and schizophrenia patients.
Prashanth Dumpuri received the B.Eng. degree in civil engineering from the College of Engineering, Chennai, India, in 2000, and the M.S. degree in civil engineering and the Ph.D. degree in biomedical engineering from Vanderbilt University, Nashville, TN, in 2002 and 2007, respectively.
He is currently a Research Associate Scientist in the Department of Biomedical Engineering and the Department of Electrical Engineering and Computer Science, Vanderbilt University. His research interests include computational modeling in biomedicine, image-guided therapeutic procedures, inverse problems, image segmentation and registration, and biomechanics.

Reid C. Thompson is the Director of the Vanderbilt Brain Tumor Center, Nashville, TN, where he is also the Vice Chairman of the Department of Neurological Surgery. He is a neurosurgeon and clinician scientist with expertise in the surgical treatment of patients with complex brain and spinal cord tumors. He treats both adults and children and performs over 250 complex intracranial operations a year. His clinical practice includes the entire spectrum of brain tumors including low-grade gliomas, malignant gliomas, metastatic brain tumors, and benign tumors such as meningiomas and acoustic neuromas. In addition, he has special expertise in treating complex tumors involving the most critical parts of the brain such as the brain stem and skull base.

Benoit M. Dawant (SM'03) received the M.S.E.E. degree from the University of Louvain, Leuven, Belgium, in 1983, and the Ph.D. degree from the University of Houston, Houston, TX, in 1988.
Since 1988, he has been on the faculty of the Electrical Engineering and Computer Science Department, Vanderbilt University, Nashville, TN, where he is a Professor. His main research interests include medical image processing and analysis. His current areas of interest include the development of algorithms and systems to assist in the placement of deep brain stimulators used for the treatment of Parkinson's disease and other movement disorders, the placement of cochlear implants used to treat hearing disorders, or the creation of radiation therapy plans for the treatment of cancer.
Footnotes
Color versions of one or more of the figures in this paper are available online at http://ieeexplore.ieee.org.
Contributor Information
Siyi Ding, Department of Electrical Engineering, Vanderbilt University, Nashville, TN 37212 USA (siyi.ding@vanderbilt.edu).
Michael I. Miga, Department of Biomedical Engineering, Vanderbilt University, Nashville, TN 37212 USA (michael.i.miga@vanderbilt.edu).
Jack H. Noble, Department of Electrical Engineering, Vanderbilt University, Nashville, TN 37212 USA (jack.h.noble@vanderbilt.edu).
Aize Cao, Department of Psychiatry, Vanderbilt University, Nashville, TN 37212 USA (aize.cao@vanderbilt.edu).
Prashanth Dumpuri, Department of Biomedical Engineering, Vanderbilt University, Nashville, TN 37212 USA (prashanth.dumpuri@vanderbilt.edu).
Reid C. Thompson, Department of Neurological Surgery, Vanderbilt University, Nashville, TN 37212 USA (reid.c.thompson@vanderbilt.edu).
Benoit M. Dawant, Department of Electrical Engineering, Vanderbilt University, Nashville, TN 37212 USA (benoit.dawant@vanderbilt.edu).
References
- 1.Hagemann A, Rohr K, Stiehl HS, Spetzger U, Gilsbach JM. Biomechanical modeling of the human head for physically based, non-rigid image registration. IEEE Trans Med Imag. 1999 Oct;18(10):875–884. doi: 10.1109/42.811267. [DOI] [PubMed] [Google Scholar]
- 2.Miga MI, Roberts DW, Hartov A, Eisner S, Lemery J, Kennedy FE, Paulsen KD. Updated neuroimaging using intraoperative brain modeling and sparse data. Stereostact Funct Neurosurg. 1999;72:103–106. doi: 10.1159/000029707. [DOI] [PubMed] [Google Scholar]
- 3.Paulsen KD, Miga MI, Kennedy FE, Hoopes PJ, Hartov A, Roberts DW. A computational model for tracking subsurface tissue deformation during stereotactic neurosurgery. IEEE Trans Biomed Eng. 1999 Feb;46(2):213–225. doi: 10.1109/10.740884. [DOI] [PubMed] [Google Scholar]
- 4.Miga MI, Paulsen KD, Hoopes PJ, Jr, Kennedy FE, Hartov A, Roberts DW. In vivo quantification of a homogeneous brain deformation model for updating preoperative images during surgery. IEEE Trans Biomed Eng. 2000 Feb;47(2):266–273. doi: 10.1109/10.821778. [DOI] [PubMed] [Google Scholar]
- 5.Miga MI, Paulsen KD, Kennedy FE, Hoopes PJ, Hartov A, Roberts DW. In vivo analysis of heterogeneous brain deformation computations for model-updated image guidance. Comput Methods Biomech Biomed Eng. 2000;3:129–146. doi: 10.1080/10255840008915260. [DOI] [PubMed] [Google Scholar]
- 6.Davatzikos C, Shen D, Mohamed A, Kyriacou SK. A framework for predictive modeling of anatomical deformations. IEEE Trans Med Imag. 2001 Aug;20(8):836–843. doi: 10.1109/42.938251. [DOI] [PubMed] [Google Scholar]
- 7.Ferrant M, Nabavi A, Macq B, Jolesz FA, Kikinis R, Warfield SK. Registration of intraoperative MR images of the brain using a finite-element biomechanical model. IEEE Trans Med Imag. 2001 Dec;20(12):1384–1397. doi: 10.1109/42.974933. [DOI] [PubMed] [Google Scholar]
- 8.Clatz O, Delingette H, Talos I, Golby AJ, Kikinis R, Jolesz FA, Ayache N, Warfield SK. Robust non-rigid registration to capture brain shift from intra-operative MRI. IEEE Trans Med Imag. 2005 Nov;24(11):1417–1427. doi: 10.1109/TMI.2005.856734. [DOI] [PMC free article] [PubMed] [Google Scholar]
- 9.Archip N, Clatz O, Whalen S, Kacher D, Fedorov A, Kot A, Chrisochoides N, Jolesz F, Golby A, Black PM, Warfield SK. Non-rigid alignment of pre-operative MRI, fMRI, and DT-MRI with intra-operative MRI for enhanced visualization and navigation in image-guided neurosurgery. NeuroImage. 2007 Apr;35:609–624. doi: 10.1016/j.neuroimage.2006.11.060. [DOI] [PMC free article] [PubMed] [Google Scholar]
- 10.Letteboer MMJ, Willems PWA, Viergever MA, Niessen WJ. Brain shift estimation in image-guided neurosurgery using 3-D ultrasound. IEEE Trans Med Imag. 2005 Feb;52(2):268–276. doi: 10.1109/TBME.2004.840186. [DOI] [PubMed] [Google Scholar]
- 11.Reinertsen I, Descoteaux M, Siddiqi K, Collins DL. Validation of vessel-based registration for correction of brain shift. Med Image Anal. 2007 Aug;11:374–684. doi: 10.1016/j.media.2007.04.002. [DOI] [PubMed] [Google Scholar]
- 12.Reinertsen I, Lindseth F, Unsgaard G, Collins DL. Clinical validation of vessel-based registration for correction of brain-shift. Med Image Anal. 2007 Dec;11:673–684. doi: 10.1016/j.media.2007.06.008. [DOI] [PubMed] [Google Scholar]
- 13.Sun H, Lunn KE, Farid H, Wu Z, Hartov A, Paulsen KD. Stereopsis-guided brain shift compensation. IEEE Trans Med Imag. 2005 Feb;24(8):1039–1052. doi: 10.1109/TMI.2005.852075. [DOI] [PubMed] [Google Scholar]
- 14.DeLorenzo C, Papademetris X, Vives KP, Spencer D, Duncan JS. Combined feature/intensity-based brain shift compensation using stereo guidance. Proc 3rd IEEE Int Symp Biomed Imag: Nano to Macro. 2006 Apr;:335–338. [Google Scholar]
- 15.Audette MA, Siddidqi K, Ferrie FP, Peters TM. An integrated range-sensing, segmentation and registration framework for the characterization of intra-surgical brain deformations in image-guided surgery. Comput Vis Image Understanding. 2003;89:226–251. [Google Scholar]
- 16.Sinha TK, Duay V, Dawant BM, Miga MI. Lecture Notes in Computer Science: Springer-Verlag, 2003, Medical Image Computing and Computer Assisted Intervention. Vol. 2879. New York: Springer-Verlag; 2009. Cortical shift tracking using laser range scanner and deformable registration methods; pp. 166–174. [DOI] [PMC free article] [PubMed] [Google Scholar]
- 17.Miga MI, Sinha TK, Cash DM, Galloway RL, Weil RJ. Cortical surface registration for image-guided neurosurgery using laser-range scanning. IEEE Trans Med Imag. 2003 Aug;22(8):973–985. doi: 10.1109/TMI.2003.815868. [DOI] [PMC free article] [PubMed] [Google Scholar]
- 18.Sinha TK, Dawant BM, Duay V, Cash DM, Weil RJ, Thompson RC, Weaver KD, Miga MI. A method to track cortical surface deformations using a laser range scanner. IEEE Trans Med Imag. 2005 Jun;24(6):767–781. doi: 10.1109/TMI.2005.848373. [DOI] [PMC free article] [PubMed] [Google Scholar]
- 19.Cao A, Dumpuri P, Miga MI. Tracking cortical surface deformations based on vessel structure using a laser range scanner. Proc 3rd IEEE Int Symp Biomed Imag: Nano to Macro. 2006 Apr;:522–525. [Google Scholar]
- 20.Ding S, Miga MI, Thompson RC, Dumpuri P, Cao A, Dawant BM. Estimation of intra-operative brain shift using a laser range scanner. Proc IEEE Eng Med Biol Soc. 2007:848–851. doi: 10.1109/IEMBS.2007.4352423. [DOI] [PubMed] [Google Scholar]
- 21.Cao A, Thompson RC, Dumpuri P, Dawant BM, Galloway RL, Ding S, Miga MI. Laser range scanning for image-guided neurosurgery: Investigation of image-to-physical space registrations. Med Phys. 2008 Apr;35:1593–1605. doi: 10.1118/1.2870216. [DOI] [PMC free article] [PubMed] [Google Scholar]
- 22.Pamir MN, Peker S, Özek MM, Dinçer A. Intraoperative MR imaging: Preliminary results with 3 tesla MR system. Acta Neurochir Suppl. 2006;98:97–100. doi: 10.1007/978-3-211-33303-7_13. [DOI] [PubMed] [Google Scholar]
- 23.Comeau RM, Sadikot AF, Fenster A, Peters TM. Intraoperative ultrasound for guidance and tissue shift correction in image-guided neurosurgery. Med Phys. 2000 Apr;27:787–800. doi: 10.1118/1.598942. [DOI] [PubMed] [Google Scholar]
- 24.Bucholz RD, Yeh DD, Trobaugh J, McDurmont LL, Sturm CC, Baumann C, Henderson JM, Levy A, Kessman P. Lecture Notes in Computer Science vol 1205 Proc 1st Joint Conf CVRMed and MRCAS. Berlin, Germany: Springer-Verlag; 1997. The correction of stereotactic inaccuracy caused by brain shift using and intraoperative ultrasound device; pp. 459–466. [Google Scholar]
- 25.Besl PJ, McKay ND. A method for registration of 3-d shapes. IEEE Trans Pattern Anal Mach Intell. 1992 Feb;14(2):239–256. [Google Scholar]
- 26.Nakajima S, Atsumi H, Kikinis R, Moriarty TM, Metcalf DC, Jolesz FA, Black PM. Use of cortical surface vessel registration for image-guided neurosurgery. Neurosurgery. 1997;40(6):1201–1210. doi: 10.1097/00006123-199706000-00018. [DOI] [PubMed] [Google Scholar]
- 27.Skrinjar OM, Duncan JS. Stereo-guided volumetric deformation recovery. Proc IEEE Int Symp Biomed Imag. 2002:863–866. [Google Scholar]
- 28.DeLorenzo C, Papademetris X, Wu K, Vives KP, Spencer D, Duncan JS. Lecture Notes in Computer Science: Springer-Verlag 2006, Medical Image Computing and Computer Assisted Intervention. New York: Springer-Verlag; Nonrigid 3D brain registration using intensity/feature information; pp. 932–939. [DOI] [PMC free article] [PubMed] [Google Scholar]
- 29.Chui H, Rangarajan A. A new point matching algorithm for nonrigid registration. Comput Vis Image Understanding. 2003;89:114–141. [Google Scholar]
- 30.Dijkstra EW. A note on two problems in connexion with graphs. Numer Math. 1959;1:269–271. [Google Scholar]
- 31.Frangi AF, Niessen WJ, Vincken KL, Viergever MA. Lecture Notes in Computer Science: Springer-Verlag, 1998, Medical Image Computing and Computer Assisted Intervention. Vol. 1496. New York: Springer-Verlag; Multiscale vessel enhancement filtering; pp. 130–137. [Google Scholar]
- 32.Gold S, Rangarajan A, Lu CP, Pappu S, Mjolsness E. New algorithm for 2-D and 3-D point matching: Pose estimation and correspondence. Pattern Recognit. 1998;31:1019–1031. [Google Scholar]
- 33.Dumpuri P, Thompson RC, Dawant BM, Cao A, Miga MI. An atlas-based method to compensate for brain shift: Preliminary results. Med Image Anal. 2007 Apr;11:128–145. doi: 10.1016/j.media.2006.11.002. [DOI] [PMC free article] [PubMed] [Google Scholar]
- 34.Fitzpatrick JM, West JB, Maurer CR. Predicting error in rigid body point-based registration. IEEE Trans Med Imag. 1998 Oct;17(5):692–702. doi: 10.1109/42.736021. [DOI] [PubMed] [Google Scholar]
- 35.Wink O, Niessen WJ, Viergever MA. Multiscale vessel tracking. IEEE Trans Med Imag. 2004 Jan;23(1):130–133. doi: 10.1109/tmi.2003.819920. [DOI] [PubMed] [Google Scholar]
- 36.Bitter I, Kaufman AE, Sato M. Penalized-distance volumetric skeleton algorithm. IEEE Trans Vis Comput Graphics. 2001 Jul;7(3):195–206. [Google Scholar]


