Abstract
The peridinin-chlorophyll a-protein (PCP) of dinoflagellates is unique among the large variety of natural photosynthetic light-harvesting systems. In contrast to other chlorophyll protein complexes, the soluble PCP is located in the thylakoid lumen, and the carotenoid pigments outnumber the chlorophylls. The structure of the PCP complex consists of two symmetric domains, each with a central chlorophyll a (Chl-a) surrounded by four peridinin molecules. The protein provides distinctive surroundings for the pigment molecules, and in PCP, the specific environment around each peridinin results in overlapping spectral line shapes, suggestive of different functions within the protein. One particular Per, Per-614, is hypothesized to show the strongest electronic interaction with the central Chl-a. We have performed an in vitro reconstitution of pigments into recombinant PCP apo-protein (RFPCP) and into a mutated protein with an altered environment near Per-614. Steady-state and transient optical spectroscopic experiments comparing the RFPCP complex with the reconstituted mutant protein identify specific amino acid-induced spectral shifts. The spectroscopic assignments are reinforced by a determination of the structures of both RFPCP and the mutant by x-ray crystallography to a resolution better than 1.5 Å. RFPCP and mutated RFPCP are unique in representing crystal structures of in vitro reconstituted light-harvesting pigment-protein complexes.
Keywords: light harvesting, peridinin, protein crystallography, refolding, transient absorption spectroscopy
Many naturally occurring light-harvesting pigment-protein complexes use chlorophyll (Chl) to collect incoming photons, and most of these systems rely on carotenoids to supplement light-capture in the spectral region of maximal solar irradiance from 420 to 550 nm. Carotenoids function as energy donors in many different natural antenna systems and operate with an efficiency that ranges from 30% to nearly 100%. Carotenoids also fulfill a crucial photoprotective role that preserves the structural and functional integrity of the photosynthetic apparatus. A detailed knowledge of the controlling features of energy transfer in natural light-harvesting systems is critical for designing efficient artificial mimics (1).
Structural determinations of several antenna complexes have lead to theoretical treatments of the photophysical processes undergone by the bound pigments and which control photosynthetic light harvesting (2). An effective approach to explore light-harvesting is mutagenesis of specific residues in conjunction with pigment substitutions or incorporations, as shown for the bacterial LH2 complex (3, 4). This approach has also been applied to the membrane-bound light-harvesting complex II (LHCII) from higher plants, for which a robust in vitro reconstitution system has been developed (5). While high-resolution x-ray-derived structures exist for both native LH2 (6–8) and LHCII (9, 10), three-dimensional (3D) crystallization of modified complexes has not been possible, although 2D crystals of reconstituted LHCII have been reported (11).
As noted above, a wide variety of light-harvesting complexes is found in nature, but the soluble peripheral antenna peridinin-chlorophyll a-protein (PCP) is unique in that it is the only system where the bound carotenoids stochiometrically outnumber the Chls. The peridinin (Per)-to-Chl ratio is 4:1 in the minimal functional unit. A high-resolution (2.0 Å) structural determination of the main form of PCP (MFPCP) revealed a trimeric quaternary structure, with each monomer consisting of two domains connected by a loop. The domains are related by a twofold pseudosymmetry axis and each encloses a central chlorophyll a (Chl-a) surrounded by four Pers (12).
Peridinin, along with other carotenoids possessing a carbonyl group, exhibits the anomalous photophysical behavior of a strong polarity-induced solvent effect on its excited-state lifetime. This effect has been attributed to the presence of an intramolecular charge transfer (ICT) state that acts in conjunction with the lowest excited singlet state S1 (13). In PCP the dominant energy transfer pathway from peridinin to Chl-a is via this S1/ICT state, whose lifetime is ≈2.5 ps in the PCP complex, corresponding to an efficiency of 80% for this preferred route (14–16). The dominance of the S1/ICT-mediated pathway may be due to the unique properties of a state that can induce coupling to Chl-a while maintaining an energy high enough for efficient transfer to Chl-a (17).
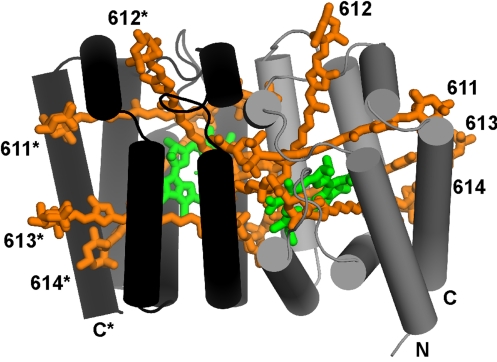
Studies on native forms of PCP have shown that the bound Pers possess distinct spectral absorption features because of differences in their immediate protein environment (18–20). A notable case is Per-612 (Fig. 1), whose environment has been postulated to result in a dramatic blue shift of its absorption spectrum, leading to less efficient direct energy transfer to Chl-a, compared to that from the other bound Pers (19–23). Another prominent example is Per-614, which has been assigned the strongest electronic interaction with Chl-a (19, 21, 24–28). This enhanced interaction was identified from transient absorption measurements of the onset of bleaching of a Per absorption band following Chl-a excitation (25). Per-614 is also presumed to be the main quencher of long-lived Chl-a triplet states (26–28). Although these investigations suggest a special role for individual peridinins, none has been directly assigned so far.
Fig. 1.
Structure of RFPCP. Two protein subunits (black and gray) form a dimer enclosing the pigment molecules (Chl-a in green and Per in orange). N- and C-terminus and Per numbers of the subunits are labeled.
The goal of the present study is to correlate the structure of the PCP complex with the spectroscopic features of the bound pigments, and in particular to assign an absorbance signature to a single peridinin, Per-614. We performed site-directed mutagenesis on the PCP apo-protein changing asparagine-89, which is close to the conjugated π-system of Per-614, to leucine, and have refolded the modified (N89L) protein in the presence of Per and Chl-a. Through a comparative study of the spectroscopic properties of the reconstituted PCP (RFPCP) and the N89L mutant, we have identified the steady-state and transient absorption spectra associated with the single Per postulated to have enhanced interaction with Chl-a. The structural details of the site-directed mutagenesis are revealed by high-resolution x-ray analyses of RFPCP and the N89L mutant. These 3D crystal structures are unique in being an in vitro reconstituted light-harvesting pigment-protein complex.
Results
Structural Model of RFPCP—Comparison with MFPCP.
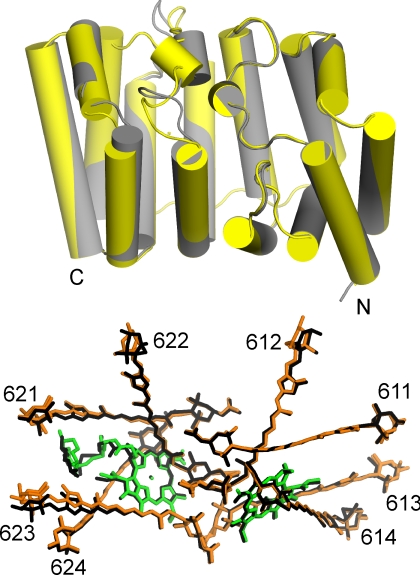
The crystals of RFPCP diffracted to 1.4 Å; the structural model was solved by molecular replacement and could be refined to an R-factor of 15.2 and a Rfree-factor of 18.7 (crystallographic statistics are given in Table S1). Investigation of the symmetry mates of crystallized RFPCP shows that two N-domain MFPCP monomers form a homodimer (see Fig. 1). The quaternary structure of the RFPCP complex is virtually identical to each monomer of the MFPCP trimer (Fig. 2), as the positions of the Cα-atoms of RFPCP deviate by only 0.81 Å [292 Cαs, aligned with SSM superimpose in Coot (29)] from those of MFPCP. The deviation in RFPCP from the N-domain of MFPCP is only 0.28 Å (150 Cαs), whereas the deviation from the C-domain of MFPCP is 0.97 Å (137 Cαs).
Fig. 2.
Superimposition of the protein helices of RFPCP (gray) and MFPCP (yellow) and the pigments of RFPCP (colored) and MFPCP (black). N- and C-terminus of the MFPCP protein, as well as MFPCP Per numbers, are labeled.
The tertiary structures of native PCP complexes are analogous to a ship transporting cargo in its interior (12, 22). The bow, sides, stern, and deck are made of alpha-helices, creating an interior hydrophobic cargo compartment for the pigments. The ship has bow and stern halves, which are related by a crystallographic twofold symmetrical axis in RFPCP (see Fig. 1). In the PCPs from Amphidinium carterae, these halves are related by a pseudosymmetric twofold axis (12, 22). Each half encloses a pigment cluster as cargo consisting of four Per molecules, one Chl-a, and one lipid molecule (see Fig. 1 and Fig. S1). The high consensus in the protein scaffold causes the pigments in RFPCP to be arranged in exactly the same way as in MFPCP (see Fig. 2). The rmsd [calculated with lsqman (30)] of the atomic positions of the Pers and Chls are rather low (overall rmsd ≈0.5 Å: see Tables S2–S4). The lipid in RFPCP is found at the same position as in MFPCP, but its exact coordination is changed (rmsd of 1.5 Å) (see Table S2). This change is mainly caused by the first head group of the lipid, which is more fixed in MFPCP because of intermonomer contacts in the trimer. Additionally, the aliphatic chains of the lipid show some variations in their exact location. In contrast to the crystal structure of MFPCP, trimerization of the homodimeric RFPCP is not observed because of the identical amino acid sequence of both domains. In MFPCP, the sequences of the two domains are not identical, causing local differences that provide the binding patches for trimerization.
N89L Mutant Structure: Probing the Binding Site of a Single Peridinin.
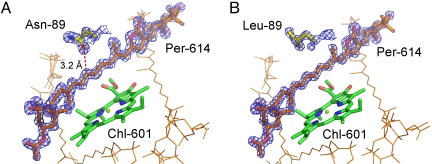
The primary reason for making the N89L mutation of RFPCP was to alter the environment of Per-614 without affecting the overall pigment arrangement. After purification, the N89L mutant was crystallized under the same conditions used for “native” RFPCP, and the crystals were found to have the same space group and similar unit-cell constants (see Table S1). The resulting structure modeled at 1.45 Å resolution (R-factor of 15.5 and a Rfree-factor of 17.6) superimposed on RFPCP shows that the overall fold and pigment arrangement is not changed when compared to RFPCP (rmsd of Cαs: 0.09 Å) (see Fig. S1). The atom positions of the Chl-a and Per molecules deviate by only ≈0.1 Å, which is less than the deviation between the pigment positions in RFPCP and in the N-domain of the M-monomer of MFPCP (0.5 Å) (see Table S2). The omit electron-density maps (Fig. 3) clearly show the mutation from Asn to Leu and confirm that the location and structure of Per-614 is not affected by the mutation.
Fig. 3.
Binding site of Per-614 in (A) RFPCP and (B) N89L mutant. Per-614, Chl-601, and the mutated residue are shown as thick lines; other Pers are shown as thin lines. Omit electron-density maps are shown for Per-614 and the mutated residue in RFPCP (contoured at 5σ) and the N89L mutant (4σ).
10-K Absorption Spectroscopy of RFPCP and the N89L Mutant.
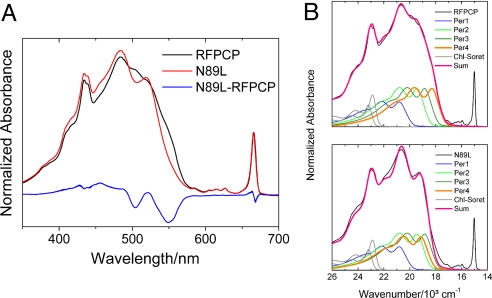
The 10-K absorption spectra of RFPCP and its mutant N89L are shown in Fig. 4. Both, RFPCP and N89L display a narrow absorption band at 666 nm, representing the well-known Qy absorption band of Chl-a. In the Soret region of Chl-a absorption at ≈450 nm, a double peak is evident as previously reported for RFPCPs refolded with Chl-a or Chl-b (31). This feature was not expected because RFPCP is a homodimer enclosing two Chls in exactly the same protein environment. However, our structural model of RFPCP clearly reveals the vinyl substituent of Chl-a must be modeled in two conformations (Fig. S2), confirming the presence of two Chl-a populations. Per contributes to the absorption spectrum of RFPCP as a broad absorption ranging from 400 to 575 nm. In the N89L mutant, the shape of the broad absorption is remarkably different from the one in the RFPCP spectrum. As indicated by the N89L-RFPCP difference spectrum (see Fig. 4), a significant part of the absorption intensity on the long wavelength (red) side of the broad absorption is shifted to shorter wavelength (to the blue).
Fig. 4.
(A) Absorption spectra of RFPCP and N89L mutant taken at 10 K. Both spectra were normalized at Qy band. The N89L-RFPCP absorption difference steady-state spectrum (10 K) indicates the most prominent spectral shifts. (B) Reconstruction of the RFPCP and N89L 10-K absorption spectra. RFPCP and N89L are fitted with the same parameters except for Per-4, which is shifted by ≈24 nm and decreased in intensity by ≈8% in the N89L mutant. See text and Origin of the absorption shift in the N89L 10-K absorption spectrum in the SI Text for further details.
To correlate the observed absorption shifts with specific Per molecules, we have reconstructed both spectra (see Fig. 4) by linearly combining on an energy scale the 10-K absorption spectra of Per and Chl-a taken in 2-MTHF, as described previously (20, 31) (for further details on the spectral reconstruction procedure see the SI Text, Origin of the absorption shift in the N89L 10-K absorption spectrum and Table S3). The following Per spectral origins (± fitting standard error) were obtained for the fit of the RFPCP spectral line shape (coefficient of determination R2 = 99.8%): Per-1 = 481 (± 0.2) nm; Per-2 = 515 (± 0.1) nm; Per-3 = 531 (± 0.1) nm; Per-4 = 547 (± 0.1) nm. The spectral line shape of the N89L absorption spectrum was reconstructed starting from the parameters used for the RFPCP fit. A reasonable reconstruction (R2 = 98.8%) could be achieved by varying the position and intensity of a single Per spectrum. The spectrum of Per-4 was varied by decreasing the absorption intensity by ≈8% and shifting the spectral origin by ≈24 nm to the blue. Overlays of the 1-T and fluorescence excitation spectra of both complexes indicate that the spectral shift of Per-4 does not alter the overall energy transfer efficiency, which remains high at ≈90% (Fig. S3).
Transient Absorption Spectroscopy.
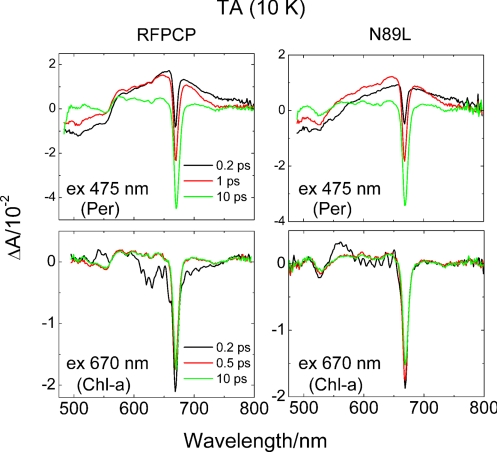
Excited-state and energy-transfer dynamics were investigated by transient absorption (TA) spectroscopy. TA spectra of the RFPCP and N89L PCP complexes taken at 10 K at various delay times after excitation of Per and Chl-a are shown in Fig. 5(see also Fig. S4). For Per excitations at 475 and 530 nm, all spectra at 0.2 ps show an immediate onset of a bleaching of the S0→S2 Per absorption band between 480 and 570 nm, accompanied by a broad and weak positive TA band between 570 and 800 nm. In addition, a bleaching of the Chl-a Qy band centered at 670 nm is observed even at 0.2 ps, which indicates ultrafast energy transfer from the Per S2 state to Chl-a. The strong and broad TA band associated with an S1/ICT→Sn transition has a maximum at ≈650 nm for both PCP complexes, regardless of the excitation wavelength. However, for N89L the band spectral shape appears flatter, in the 580 to 620 nm range, compared to the spectrum from the RFPCP complex. This S1/ICT→Sn transition decays in a few picoseconds. Simultaneously, additional bleaching of the Chl-a Qy band is observed. At longer delays, a negative signal centered at 553 nm for RFPCP and at 526 nm for the N98L mutant is clearly visible. The same negative signal is also observed in the TA spectra recorded upon excitation of the Qy band of Chl-a (see Fig. 5), confirming that this band appears when Chl-a is in an excited state.
Fig. 5.
TA spectra of RFPCP and N89L measured at 10 K. The samples were excited in the Per absorption region at 475 nm and into the Qy band of Chl-a at 670 nm.
All transient spectral features broaden when the excitations are repeated at 293 K (see Fig. S4). However, the overall band shapes remain consistent with the results obtained at 10 K and only small shifts in the positions of some of the spectral features are observed. The Chl-a Qy bleaching/stimulated emission band shifts from 666 to 673 nm in both RFPCP and N89L. The most significant change with increasing temperature is that the longer-lived bleaching signal shifts from 553 to 540 nm in RFPCP, but remains unchanged at 526 nm in the N89L mutant.
The TA spectral and temporal datasets were globally fit using a model corresponding to a sequential path of de-excitation. This type of fitting gives spectral profiles, termed “evolution associated difference spectra” (EADS). The fitting results are consistent with recently published data reported for PCP (24, 25) and are discussed in detail in the SI Text (Fig. S5).
Discussion
Per-614 Has a Red-Shifted Absorption Spectrum and Shifts Substantially in Response to Chl-a Excitation.
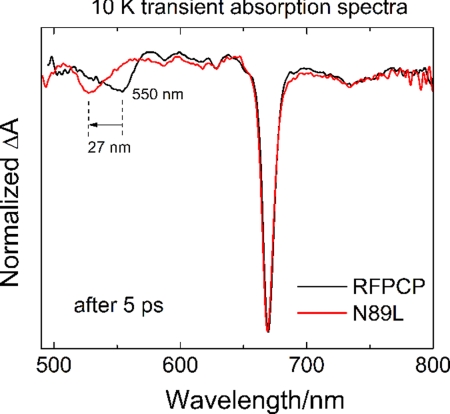
The crystal structure of RFPCP (see Fig. 1) is unique in representing the crystal structure of an in vitro-reconstituted light-harvesting system, and it is indistinguishable from the structure of a monomer of native MFPCP (see Fig. 2). The mutation from Asn-89 to Leu-89 affects the electrostatics of the immediate environment of Per-614 (see Fig. 3), but besides changing the mutated residue, neither the local nor the global structural arrangement of RFPCP is altered (see Fig. S1 and Table S2). Thus, any absorption differences observed between the N89L and RFPCP spectral line shapes (see Fig. 4 and Table S3) can be directly attributed to the electrostatic effect of the mutation. From the reconstruction of the spectral line shapes (see Fig. 4), we identify a ≈24-nm blue shift from 547 to 523 nm of the Per-614 S0→S2 transition to be the main cause of the absorption difference. MNDO-PSCDI calculations were carried out on the protein-bound Per-614 to better understand the nature of the observed blue shift in the N89L mutant. The electrostatic effect of the N89L mutation is predicted to shift the two lowest lying energy levels of Per-614 to higher energies (see Origin of the absorption shift in the N89L 10-K absorption spectrum in the SI Text and Table S4). Consistent with recent studies on PCP (16, 24, 25), we also observe a small bleaching signal (a downward dip in the line shape) in TA measurements on both RFPCP and the N89L mutant at delay times after Per has relaxed back to the ground state, but while Chl-a is still excited (see Fig. S4 and Fig. 5). This dip is blue-shifted by ≈27 nm (Fig. 6) in the N89L mutant, compared to RFPCP, which is very similar to the ≈24 nm shift in the steady-state absorption band (see Fig. 4). This agreement is direct evidence for assigning the TA bleaching signal (dip) to Per-614 as suggested previously by Stokkum et al. (25) based on analysis of polarized pump-probe measurements. Undoubtedly the structural proximity of Per-614 to Chl-a gives rise to the enhanced interaction between the two pigments. Both electrochromic effects (32) and excitonic interactions (33) have been suggested by Stokkum et al. (25) to be responsible for the dip. The origin of the effect is suggested from a closer examination of the spectral line shapes.
Fig. 6.
Overlay of the 10-K TA spectra of N89L and RFPCP taken 5 ps after Chl-a Qy excitation.
Origin of the TA Bleaching Signal (Dip): Excitonic Coupling or Electrochromic Shift?
If the dip is the result of an excitonic interaction between Chl-a and Per-614, it should occur if either Chl-a or Per is excited. The TA signal after Per excitation is difficult to analyze in this spectral region because it is close to a zero-crossing point (see Fig. 5). However, the bleaching signal is shifted for the N89L mutant, and a close inspection of the TA data taken using excitation at 475 nm indicates that the dip is not present at very early times after excitation (see e.g., the 100-fs EADS obtained at 10 K in Fig. S5). Moreover, because exciton-coupled molecules have a common ground state, excitation of the pair should generate a bleaching that mirrors the absorption spectrum. This is not the case, because the dip is spectrally narrow and about an order of magnitude weaker than the Chl-a bleaching (see Fig. S4 and Fig. 5).
Electrochromic shifts of the S0→S2 transition of carotenoids in light-harvesting systems are usually identified via characteristic wavy shapes of TA spectra in the region of carotenoid absorption (32). The absence of this type of TA line shape in PCP has been taken as an argument against the signal being of electrochromic origin. However, it is important to note that in PCP, contrary to other light-harvesting complexes, four different Pers will respond individually to the generation of a nearby excited Chl-a. This combination of different electrochromic responses of the four Pers, with the response of Per-614 being the largest, may disrupt the expected wavy line shape. Moreover, if the observed dip is the result of an electrochromic response of the Pers in PCP to the local electric field of the excited Chl-a, the signal should be consistent with that predicted from a simplified form of the Liptay expression (34) for the Stark absorbance shift:
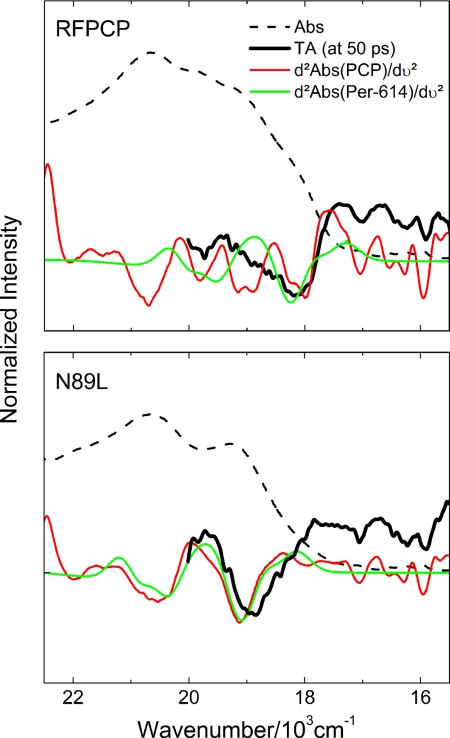
The Stark effect on the absorption spectrum can be calculated from the above expression, which contains three terms corresponding to the zero-order absorption spectrum, and its first and second derivatives. In the case of the Stark signal for Per, it has been shown that the third term, whose coefficient a2 includes the induced change in the transition dipole moment, is the dominant component (35). Because it is difficult to estimate the contribution of each Per to the observed dip formed upon Chl-a photo-excitation, the second derivative spectra were computed for two cases: (i) complete RFPCP and N89L mutant absorption spectra; and (ii) the Per-614 absorption spectrum taken from the fits shown in Fig. 4. These second derivative line shapes were then overlaid with the TA spectra (Fig. 7). As is evident from the figure, there is good agreement between the calculated second derivatives and the measured TA bleaching signals (dips), even for the second derivative of the fitted Per-614 spectrum. It is concluded that the TA bleaching signal (dip) arises from an electrochromic response predominantly from Per-614 to the photo-excited Chl-a.
Fig. 7.
Calculation of the second derivatives of the full 10-K absorption spectra of RFPCP and N89L as well as of the 10-K Per-614 spectra of RFPCP and N89L. The calculated spectra are overlaid with the dip from TA measurements measured 50 ps after Chl-a excitation. The 10-K absorption spectra of RFPCP and N89L are included for better identification of the spectral region.
Energy Transfer in PCP.
It is important to ask what role Per-614 plays in energy transfer to Chl-a. Several studies, including the present work, have suggested that Per-614 has the strongest interaction with Chl-a (19, 21, 24–28). In the N89L mutant, the large spectral shift of the Per-614 S0→S2 transition (see Fig. 4) reduces the overlap integral between the S2 emission of Per and the Qx absorption of Chl-a by ≈20% and between Per and the Qy absorption by ≈30%, yet essentially no change in the overall energy transfer efficiency is observed (see Fig. S3). This apparent discrepancy can be rationalized if the major energy transfer route is not via the Per S2→Chl-a Qx pathway, but by the Per S1/ICT→Chl-a Qy route (21, 24, 36). Although the shape of the broad TA transition associated with the S1/ICT state changes to some extent, the lifetime stays roughly the same (see Fig. S4, Fig. S5, and Fig. 5) and, overall, the S1/ICT state is only marginally affected.
Maintenance of the Per-to-Chl-a energy transfer efficiency in the mutant shows that PCP is a very robust antenna system, which is almost insensitive to local changes of the protein environment. If the S1/ICT state were also insensitive to changes in the pigment binding site it would be advantageous for using the S1/ICT state as the major energy transfer channel. The wavelength range for light absorption could be broadened by the organism simply by changing the spectral position of the S0→S2 transition of the Pers without affecting the efficiency of energy transfer to Chl-a. A caveat is that it should not produce too many Pers having the same high-energy spectral features as Per-612, which appears not to transfer energy to Chl-a very effectively.
Conclusions
The reconstituted amino-terminal domain of RFPCP assembles to form a homodimer that is virtually structurally indistinguishable from the MFPCP monomer previously reported. The structural and spectroscopic properties of the RFPCP and N89L mutant complexes were used to identify a single peridinin molecule, Per-614, within the pigment clusters that shows enhanced interaction with Chl-a. This enhanced Per-614-Chl-a interaction is identified from the observation of an electrochromic response of the Per to the local electric field of the excited Chl-a. The response arises because Per-614 is positioned very close to the central Chl-a, where it senses the formation of its excited singlet state. Close proximity facilitates light-harvesting via the S1/ICT state of Per, but the function of the carotenoid/chlorophyll interactions in dinoflagellates may very well be photoprotection: When the number of Chl-a excited singlet states is too numerous and unable to be transferred to the membrane-bound antenna complexes, Chl-a triplet states may form, which may then sensitize the formation of deleterious singlet oxygen (37). Per-614 is in an ideal position to quench these harmful Chl-a triplet states efficiently, thereby protecting the apparatus from light-induced oxidative damage (27, 28).
Experimental Procedures
Mutagenesis, Protein Expression, and Purification.
The N89L mutant of the N-domain construct of MFPCP, N-MFPCP, was generated with the QuikChange site-directed mutagenesis kit (Stratagene). N-MFPCP apo protein and its N89L mutant were expressed heterologously in Escherichia coli JM109 and purified according to the protocol of Miller et al. (38). Reconstitution of RFPCP was performed as described (38), but for crystallization experiments the purification procedure was extended by adding a gel-filtration step after the anion exchange column. For spectroscopic measurements, the protein was used purified by the anion exchange step alone. For all experiments, RFPCP was dissolved in 5 mM Tricine, 2 mM KCl, pH 7.6.
Structure Determination of RFPCP and the N89L Mutant.
Final crystals of both RFPCP and N89L were grown by the hanging-drop vapor-diffusion method using optimized conditions of the Qiagen Classics screening suit solution number 134075 [0.1 M cadmium chloride; 0.1 M sodium acetate; pH 4.6; 30% (vol/vol) PEG 400]. Crystals grew within 7 to 14 days and were harvested in cryoloops and flash frozen in liquid nitrogen. Oscillation data of the RFPCP crystal were collected at 100 K at the Swiss Light Source at beamline PXI using a MarCCD-225 detector. The crystal of N89L was measured at the European Synchrotron Radiation Facility (Grenoble, France) at beamline ID14–1 using an ADSC Quantum Q210 detector. All data were processed and scaled using the XDS package (39). Data statistics are listed in Table S1. The RFPCP structure was solved by molecular replacement using Phaser (40), as implemented in CCP4 (41), with the N-domain (Cut at K147) of Monomer M of the MFPCP trimer (Protein Data Bank code: 1PPR) as search model. Initial refinement steps were done with Crystallography and NMR system (CNS) (42); later steps were done with Refmac (43). Model building was performed in Coot (44). In the case of the N89L mutant, the phase problem was solved with MOLREP (45) using the RFPCP structural model, and the model was refined in Refmac.
Spectroscopy.
Steady-state absorption and fluorescence excitation spectroscopy.
The 10-K absorption spectra were recorded using a Cary 50 UV-visible spectrometer equipped with Janis STVP100 helium cryostat. The 10-K fluorescence excitation profiles were carried out using a Jobin-Yvon Horiba Fluorolog-3 model FL3–22 set to right-angle detection mode with respect to the excitation beam. Spectra were monitored at the maximum of the Chl-a emission band and corrected for the excitation lamp profile with emission and excitation band passes set to 5 nm.
TA spectroscopy.
TA spectroscopy was carried out using Helios-fs TA spectrometer from Ultrafast Systems LLC attached with a fs laser system from Spectra-Physics, as described previously (23). The white-light continuum probe pulses were generated on a 3-mm Sapphire plate. TA spectra were recorded using a charge-coupled Ocean Optics S2000 detector with a 2,048 pixel array. The pump and probe beams were overlapped at the sample at the magic-angle (54.7°) polarization and signals were averaged over 5 s (average of 500 single TA spectra). The pump beam was set to 1 μJ energy and focused in a 1-mm spot at the sample to give an intensity of 3.1 × 10¹⁴ to 4.3 × 10¹⁴ photons per square centimeter, depending on the excitation wavelength. The samples were excited at 475, 530, and 670 nm. The optical density of the samples was adjusted to ≈0.2 in a 2 mm path-length quartz cuvette at the maximum of the Chl-a Qy band for room temperature measurements, or to ≈0.4 in a 4 mm path-length plastic cuvette for measurements at 10 K, using a helium cryostat (Janis STVP100). Instrument response times τs were obtained from global fitting analysis and are given in Fig. S5. Sample integrity was checked by taking absorption spectra before and after every TA experiment. Surface Explorer (v.1.0.6), a 3D time-resolved data analysis package from Ultrafast Systems LLC was used to correct dispersion in the TA spectra, and ASUFit 3.0 program, provided by E. Katilius at Arizona State University, was used for global fitting of the datasets.
Further details about the methods used are given in the SI Text.
Supplementary Material
Acknowledgments.
We thank the beamline staff at ID14–1 at the European Synchrotron Radiation Facility and at PX-I at the Swiss Light Source for assistance during data collection. This work was supported in part by Sonderforschungsbereich 480 from the Deutsche Forschungsgemeinschaft (Teilprojekt C6) and by a grant from the Helmholtz Society in the framework of the Virtual Institute for Biological Structure Research (VH-VI-157) (to E.H. and T.S.), the Research School of the Ruhr-University Bochum (T.S.), the Macquarie University research development office (R.G.H.), and Grants MSM6007665808, AV0Z50510513, and project KONTAKT ME09037 from the Czech Ministry of Education (to T.P.). The work in the laboratory of H.A.F. was supported by Grant GM-30353 from the National Institutes of Health, and the National Science Foundation and the University of Connecticut Research Foundation. The theoretical calculations were supported by the National Institutes of Health (GM-34548).
Footnotes
The authors declare no conflict of interest.
This article is a PNAS Direct Submission.
Data deposition: The coordinates and structure factors have been deposited in the Protein Data Bank, www.pdb.org [PDB ID codes 3IIS (RFPCP) and 3IIU (N89L mutant)].
This article contains supporting information online at www.pnas.org/cgi/content/full/0908938106/DCSupplemental.
References
- 1.Frank HA, Young AJ, Britton G, Cogdell RJ, editors. The Photochemistry of Carotenoids. Dordrecht: Kluwer Academic Publishers; 1999. [Google Scholar]
- 2.Green BR, Parson WW. Advances in Photosynthesis and Respiration Vol. 13: Light Harvesting Antennas. 1st Ed. Dordrecht: Kluwer academic publishers; 2003. [Google Scholar]
- 3.Cogdell RJ, Gall A, Köhler J. The architecture and function of the light-harvesting apparatus of purple bacteria: From single molecules to in vivo membranes. Q Rev Biophys. 2006;39:227–324. doi: 10.1017/S0033583506004434. [DOI] [PubMed] [Google Scholar]
- 4.Desamero RZB, et al. Mechanism of energy transfer from carotenoids to bacteriochlorophyll: Light-harvesting by carotenoids having different extents of π-electron conjugation incorporated into the B850 antenna complex from the carotenoidless bacterium rhodobacter sphaeroides R-26.1. J Phys Chem B. 1998;102:8151–8162. [Google Scholar]
- 5.Paulsen H, Hobe S. Pigment-binding properties of mutant light-harvesting chlorophyll-a/b-binding protein. Eur J Biochem. 1992;205:71–76. doi: 10.1111/j.1432-1033.1992.tb16752.x. [DOI] [PubMed] [Google Scholar]
- 6.McDermott G, et al. Crystal structure of an integral membrane light-harvesting complex from photosynthetic bacteria. Nature. 1995;374:517–521. [Google Scholar]
- 7.Papiz MZ, Prince SM, Howard T, Cogdell RJ, Isaacs NW. The structure and thermal motion of the B800–850 LH2 complex from Rps.acidophila at 2.0A resolution and 100K: New structural features and functionally relevant motions. J Mol Biol. 2003;326:1523–1538. doi: 10.1016/s0022-2836(03)00024-x. [DOI] [PubMed] [Google Scholar]
- 8.Koepke J, Hu X, Muenke C, Schulten K, Michel H. The crystal structure of the light-harvesting complex II (B800–850) from Rhodospirillum molischianum. Structure. 1996;4:581–597. doi: 10.1016/s0969-2126(96)00063-9. [DOI] [PubMed] [Google Scholar]
- 9.Liu Z, et al. Crystal structure of spinach major light-harvesting complex at 2.72 A resolution. Nature. 2004;428:287–292. doi: 10.1038/nature02373. [DOI] [PubMed] [Google Scholar]
- 10.Standfuss J, Terwisscha van Scheltinga AC, Lamborghini M, Kühlbrandt W. Mechanisms of photoprotection and nonphotochemical quenching in pea light-harvesting complex at 2.5 A resolution. EMBO J. 2005;24:919–928. doi: 10.1038/sj.emboj.7600585. [DOI] [PMC free article] [PubMed] [Google Scholar]
- 11.Hobe S, Prytulla S, Kühlbrandt W, Paulsen H. Trimerization and crystallization of reconstituted light-harvesting chlorophyll a/b complex. EMBO J. 1994;13:3423–3429. doi: 10.1002/j.1460-2075.1994.tb06647.x. [DOI] [PMC free article] [PubMed] [Google Scholar]
- 12.Hofmann E, et al. Structural basis of light harvesting by carotenoids: Peridinin-chlorophyll-protein from Amphidinium carterae. Science. 1996;272:1788–1791. doi: 10.1126/science.272.5269.1788. [DOI] [PubMed] [Google Scholar]
- 13.Frank HA, et al. Effect of the solvent environment on the spectroscopic properties and dynamics of the lowest excited states of carotenoids. J Phys Chem B. 2000;104:4569–4577. [Google Scholar]
- 14.Bautista JA, et al. Singlet and triplet energy transfer in the peridinin-chlorophyll a-protein from Amphidinium carterae. J Phys Chem A. 1999;103:2267–2273. [Google Scholar]
- 15.Zigmantas D, Hiller RG, Sundstrom V, Polivka T. Carotenoid to chlorophyll energy transfer in the peridinin-chlorophyll-a-protein complex involves an intramolecular charge transfer state. Proc Natl Acad Sci USA. 2002;99:16760–16765. doi: 10.1073/pnas.262537599. [DOI] [PMC free article] [PubMed] [Google Scholar]
- 16.Krueger BP, et al. Energy transfer in the peridinin chlorophyll-a protein of Amphidinium carterae studied by polarized transient absorption and target analysis. Biophys J. 2001;80:2843–2855. doi: 10.1016/S0006-3495(01)76251-0. [DOI] [PMC free article] [PubMed] [Google Scholar]
- 17.Zigmantas D, et al. Effect of a conjugated carbonyl group on the photophysical properties of carotenoids. Phys Chem Chem Phys. 2004;6:3009–3016. [Google Scholar]
- 18.Kleima FJ, et al. Peridinin chlorophyll a protein: Relating structure and steady-state spectroscopy. Biochemistry. 2000;39:5184–5195. doi: 10.1021/bi992427s. [DOI] [PubMed] [Google Scholar]
- 19.Carbonera D, Giacometti G, Segre U, Hofmann E, Hiller RG. Structure-based calculations of the optical spectra of the light-harvesting peridinin-chlorophyll-protein complexes from Amphidinium carterae and Heterocapsa pygmaea. J Phys Chem B. 1999;103:6349–6356. [Google Scholar]
- 20.Ilagan RP, et al. Spectroscopic properties of the main-form and high-salt peridinin-chlorophyll a proteins from Amphidinium carterae. Biochemistry. 2004;43:1478–1487. doi: 10.1021/bi0357964. [DOI] [PubMed] [Google Scholar]
- 21.Damjanović A, Ritz T, Schulten K. Excitation transfer in the peridinin-chlorophyll-protein of Amphidinium carterae. Biophys J. 2000;79:1695–1705. doi: 10.1016/S0006-3495(00)76422-8. [DOI] [PMC free article] [PubMed] [Google Scholar]
- 22.Schulte T, Sharples FP, Hiller RG, Hofmann E. X-ray structure of the high-salt form of the peridinin-chlorophyll a-protein from the dinoflagellate Amphidinium carterae: Modulation of the spectral properties of pigments by the protein environment. Biochemistry. 2009;48:4466–4475. doi: 10.1021/bi802320q. [DOI] [PubMed] [Google Scholar]
- 23.Ilagan RP, et al. Femtosecond time-resolved absorption spectroscopy of main-form and high-salt peridinin-chlorophyll a-proteins at low temperatures. Biochemistry. 2006;45:14052–14063. doi: 10.1021/bi061217u. [DOI] [PubMed] [Google Scholar]
- 24.Polívka T, Pascher T, Sundström V, Hiller RG. Tuning energy transfer in the peridinin-chlorophyll complex by reconstitution with different chlorophylls. Photosynth Res. 2005;86:217–227. doi: 10.1007/s11120-005-1447-x. [DOI] [PubMed] [Google Scholar]
- 25.Stokkum IHV, et al. Inter-pigment interactions in the peridinin chlorophyll protein studied by global and target analysis of time resolved absorption spectra. Chem Phys. 2009;357:70–78. [Google Scholar]
- 26.Alexandre MTA, et al. Triplet state dynamics in peridinin-chlorophyll-a-protein: A new pathway of photoprotection in LHCs? Biophys J. 2007;93:2118–2128. doi: 10.1529/biophysj.107.106674. [DOI] [PMC free article] [PubMed] [Google Scholar]
- 27.Di Valentin M, Ceola S, Salvadori E, Agostini G, Carbonera D. Identification by time-resolved EPR of the peridinins directly involved in chlorophyll triplet quenching in the peridinin-chlorophyll a-protein from Amphidinium carterae. Biochim Biophys Acta. 2008;1777:186–195. doi: 10.1016/j.bbabio.2007.09.002. [DOI] [PubMed] [Google Scholar]
- 28.Niklas J, et al. Spin-density distribution of the carotenoid triplet state in the peridinin-chlorophyll-protein antenna. A Q-band pulse electron-nuclear double resonance and density functional theory study. J Am Chem Soc. 2007;129:15442–15443. doi: 10.1021/ja077225v. [DOI] [PubMed] [Google Scholar]
- 29.Krissinel E, Henrick K. Secondary-structure matching (SSM), a new tool for fast protein structure alignment in three dimensions. Acta Crystallogr D Biol Crystallogr. 2004;60:2256–2268. doi: 10.1107/S0907444904026460. [DOI] [PubMed] [Google Scholar]
- 30.Kleywegt GJ, Jones TA. A super position. CCP4/ESF-EACBM Newsletter on Protein Crystallography. 1994;31:9–14. [Google Scholar]
- 31.Ilagan RP, et al. Optical spectroscopic studies of light-harvesting by pigment-reconstituted peridinin-chlorophyll-proteins at cryogenic temperatures. Photosynth Res. 2006;90:5–15. doi: 10.1007/s11120-006-9090-8. [DOI] [PMC free article] [PubMed] [Google Scholar]
- 32.Herek JL, et al. Ultrafast carotenoid band shifts: Experiment and theory. J Phys Chem B. 2004;108:10398–10403. [Google Scholar]
- 33.Gradinaru CC, van Grondelle R, van Amerongen H. Selective interaction between xanthophylls and chlorophylls in LHCII probed by femtosecond transient absorption spectroscopy. J Phys Chem B. 2003;107:3938–3943. [Google Scholar]
- 34.Liptay W. In: Excited States. Lim EC, editor. New York: Academic; 1974. p. 129. [Google Scholar]
- 35.Premvardhan L, Papagiannakis E, Hiller RG, van Grondelle R. The charge-transfer character of the S0→S2 transition in the carotenoid peridinin is revealed by Stark spectroscopy. J Phys Chem B. 2005;109:15589–15597. doi: 10.1021/jp052027g. [DOI] [PubMed] [Google Scholar]
- 36.Kleima FJ, et al. Förster excitation energy transfer in peridinin-chlorophyll-a-protein. Biophys J. 2000;78:344–353. doi: 10.1016/S0006-3495(00)76597-0. [DOI] [PMC free article] [PubMed] [Google Scholar]
- 37.Krinsky N. In: Carotenoids. Isler O, Gutman H, Solms U, editors. Basel: Birkhauser Verlag; 1971. [Google Scholar]
- 38.Miller DJ, et al. Reconstitution of the peridinin-chlorophyll a protein (PCP): Evidence for functional flexibility in chlorophyll binding. Photosynth Res. 2005;86:229–240. doi: 10.1007/s11120-005-2067-1. [DOI] [PubMed] [Google Scholar]
- 39.Kabsch W. Automatic processing of rotation diffraction data from crystals of initially unknown symmetry and cell constants. J Appl Crystallogr. 1993;26:795–800. [Google Scholar]
- 40.McCoy AJ. Solving structures of protein complexes by molecular replacement with Phaser. Acta Crystallogr D Biol Crystallogr. 2007;63:32–41. doi: 10.1107/S0907444906045975. [DOI] [PMC free article] [PubMed] [Google Scholar]
- 41.The CCP4 suite: Programs for protein crystallography. Acta Crystallogr D Biol Crystallogr. 1994;50:760–763. doi: 10.1107/S0907444994003112. [DOI] [PubMed] [Google Scholar]
- 42.Brünger AT, et al. Crystallography & NMR system: A new software suite for macromolecular structure determination. Acta Crystallogr D Biol Crystallogr. 1998;54:905–921. doi: 10.1107/s0907444998003254. [DOI] [PubMed] [Google Scholar]
- 43.Murshudov GN, Vagin AA, Dodson EJ. Refinement of macromolecular structures by the maximum-likelihood method. Acta Crystallogr D Biol Crystallogr. 1997;53:240–255. doi: 10.1107/S0907444996012255. [DOI] [PubMed] [Google Scholar]
- 44.Emsley P, Cowtan K. Coot: Model-building tools for molecular graphics. Acta Crystallogr D Biol Crystallogr. 2004;60:2126–2132. doi: 10.1107/S0907444904019158. [DOI] [PubMed] [Google Scholar]
- 45.Vagin A, Teplyakov A. MOLREP: An automated program for molecular replacement. J Appl Crystallogr. 1997;30:1022–1025. [Google Scholar]
Associated Data
This section collects any data citations, data availability statements, or supplementary materials included in this article.


