

Abstract
The main objective of this study was to evaluate the correlation between the Environmental Relative Moldiness Index (ERMI) values in the Department of Housing and Urban Development American Healthy Homes Survey (AHHS) homes and an alternative analysis frequently used in mold investigations, i.e., the inspector’s “walk-through” assessment of visual or olfactory evidence of mold combined with occupant’s answers to a questionnaire about mold odors and moisture. Homes in the highest ERMI quartile were in agreement with visual inspection and/or occupant assessment 48% of the time but failed to detect the mold in 52% of the fourth quartile homes. In about 7% of lowest ERMI quartile homes, the inspection and occupant assessments overestimated the mold problem. The ERMI analysis of dust from homes may be useful in finding hidden mold problems. An additional objective was to compare the ERMI values in inner city east-Baltimore homes, where childhood asthma is common, to the AHHS randomly selected homes.
Keywords: Mold, Moisture, MSQPCR, ERMI, Inner city, Questionnaire
Introduction
The Institute of Medicine’s expert committee concluded that exposure to moldy, damp indoor environments was associated with respiratory tract symptoms.1 A meta-analysis of studies associating mold contamination with adverse health effects demonstrated that building dampness and mold were associated with approximately a 30% to 50% increase in a variety of respiratory and asthma-related health outcomes.2 Other studies have shown that remediating the water damage and mold in asthmatics’ homes resulted in improvements in their health.3,4 Therefore, accurate assessment of the molds in homes may be critical in evaluating asthma trigger concentrations.
In 2007, ASTM International promulgated the standard D 7297 “Practice for Evaluating Residential Indoor Air Quality Concerns”.5 The first phase of this Standard is based on a “walk-through” examination of the home. A “walk-through” examination had also been promulgated in the 2006 ASTM standard E 2418 “Guide for Readily Observable Mold and Conditions Conducive to Mold in Commercial Buildings: Baseline Survey Protocol”.6 The use of a “walk-through” and/or questioning of the occupants about water and mold is frequently the initial method(s) in a mold investigation. Taking samples for mold analysis have generally not been recommended because of the lack of standardization in the sampling procedure, the analysis, or interpretation of the results.7 Johnson et al.8 reached a similar conclusion regarding air sampling by noting that “professional judgment in the evaluation of airborne mold sampling data leads to inconsistent conclusions regarding the presence of an indoor mold source.”
This present report describes and contrasts the methods for estimating water damage and mold-burden assessments that were used in the HUD American Healthy Homes Survey (AHHS).9 The AHHS was a random sampling of about 1,100 homes across the US and analysis of their environmental conditions. One of the conditions evaluated was mold. An inspector investigated the living room and bedroom of each home for visible mold and/or musty smell. In addition, the home’s occupants answered two questions about water damage and/or musty smells. At the same time, a combined dust sample from the living room and bedroom was obtained from each home by the inspector using a standard protocol. These dust samples were analyzed for 36 molds using a DNA-based technology called mold-specific quantitative PCR (MSQPCR).9
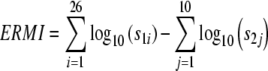
The 36 species in the analysis are based on the 26 group 1 species which we have shown to be associated with homes with water damage and the ten group 2 species which are found in homes independent of water damage.10–14 Analysis of these molds and mathematical treatment of the data resulted in the creation of the Environmental Relative Moldiness Index (ERMI) scale which describes the mold burden in a home with a single numeric value.9 The homes in the lowest quartile have the lowest mold burden. Each higher quartile indicates more mold present in the home, until the fourth quartile which indicates homes with the most mold.
Thus, the main objective of this study was to evaluate the correlation between the ERMI values in the AHHS homes and an alternative, i.e., the inspector’s report of visual or olfactory evidence of mold during a “walk-through” combined with occupant’s answers to a questionnaire about mold odors and moisture problems.
Methods
The American Healthy Homes Survey (AHHS)9 “targeted a nationally representative sample of permanently occupied homes or housing units”. A housing unit is defined as a house, apartment, mobile home, a group of rooms, or a single room that is occupied as separate living quarters. Separate living quarters are those in which the occupants live and eat separately from any other persons in the building and which have direct access from the outside or through a common hall.
The first stage of the selection process was to choose 100 clusters called “primary sampling units” (PSUs) which covered the entire U.S. The PSUs were selected with probability proportional to population in the 2000 Census. The second stage of the selection process was to choose five “segments” in each PSU with probability proportional to the total number of housing units in the segment. A segment consists of a Census block or a group of geographically contiguous blocks, and in most cases is similar to a city block. The third stage in selection of a sample of housing units required the use of a “sampling frame”. A sampling frame is a list of all units in the segments from which the sample of housing units were drawn. A frame of housing units was created by a variation of a process called “listing”. Listing is the process of identifying and recording the addresses of households (or their descriptions and locations, if they do not have addresses) on listing sheets. In this way, all of the places where people live, or might live, within the boundaries of the segment are eligible for inclusion in the study.
For this survey, lists of households in the sampled segments were acquired from commercially available sources. A sample of 4 residential addresses, plus 2 backup addresses, was randomly selected from the list in a typical segment to determine which households were eligible to be included in the sample. These lists were validated by a modified listing process in which interviewers visited the sampled segments with the acquired lists to compare them with the housing units actually present to validate a list for each designated segment within each PSU. This comparison resulted in some housing units being added to the lists and others being deleted from the lists. The result was the ultimate selection of 1,144 homes for sampling of which sufficient dust was collected in 1,096, which were the subjects of this present study (for more detailed information about the selection process, go to www.hud.gov).
As part of the survey, the inspector evaluated the living room and bedroom (a child’s bedroom, if there was a child, or any bedroom, if not) for either visual or olfactory evidence of mold. The “walk-through” did not include searches, like moving furniture or instrument measurements. In addition, the occupants were asked two questions related to mold or water damage. Question 1: “During the past twelve months, have there been water problems or dampness in your home from broken pipes, leaks, heavy rain, or floods.” Question 2: “Does your home frequently have a mildew odor or musty smell.” The response for each question was recorded as a “yes” or “no”.
The collection and analysis of the dust by mold-specific quantitative PCR (MSQPCR) was described previously.15–17 Dust is collected from the child’s bedroom (or any bedroom if there is no child) and the living room to produce a single sample of dust from the home.9 The ERMI was calculated as shown in Eq. 1, by taking the sum of the logs of the concentrations of the 26 group 1 species (s1) and subtracting the sum of the logs of the concentrations of ten group 2 species (s2).9
 |
1 |
For computation of the ERMI, the concentrations in cell equivalents per mg of dust (CE mg-1 dust) of fungal species not detected in the dust sample were set to the minimum detection limit (MDL) of one (1) CE mg-1 dust before log transformation. Statistical analyses for two group comparisons of mold concentrations (CE mg-1 dust) estimated by MSQPCR set the value of non-detected species to one half the MDL and treated them as left-censored data, using the Wilcoxon rank-sum statistical test.18
The correlation between ERMI values for homes in the highest (fourth quartile) and lowest (first quartile) mold burdens on the scale and the mold inspector’s observations combined with the occupant’s answers about mold and moisture questions were tested. The highest ERMI quartile homes which had at least one positive response to a mold assessment or question were compared on individual mold concentration to those with all “no” assessments using the Wilcoxon rank-sum test. A similar comparison was made between the first quartile homes, which had a musty smell or visible mold, and the mold concentrations in the fourth quartile homes. All statistical analyses were performed using the SAS software system (version 9.1, SAS Institute Inc., Cary, NC, USA) and the R Software environment for statistical computing and graphics (version 2.5).
Dust samples (n = 233) from an earlier inner city east-Baltimore study were kindly provided by the team from Johns Hopkins University.19 Dust was collected from the child’s bedroom, sieved to a pore size of 300 μm and 5 mg of dust analyzed by MSQPCR. The ERMI value for each home was calculated as described above.
Results
In Table 1, the ERMI quartile is shown in conjunction with the occupants’ answers to the survey questions and the inspectors’ observations for the AHHS homes (n = 1,084 to 1,088, since some information was not obtained). Table 1A shows an overall average of 28% of the occupants reported having water problems in their homes in the past 12 months with the highest percentage (34%) in the fourth ERMI quartile, and lowest (24%) in the first quartile. In Table 1B, 16% of occupants reported a musty smell in their homes, with the highest percentage (24%) again in the fourth quartile, and lowest (11%) in the both the first and second ERMI quartiles.
Table 1.
Questionnaire responses by occupants about water damage or musty smell in home or inspector observations of mold or musty smell in living room (LR) or bedroom (BR)a
| ERMI quartile | Yes | No | % Yes | % No | |
|---|---|---|---|---|---|
| Occupant questions | |||||
| A. Water problems | 1 | 64 | 208 | 24 | 76 |
| 2 | 74 | 198 | 27 | 73 | |
| 3 | 68 | 201 | 25 | 75 | |
| 4 | 93 | 178 | 34 | 66 | |
| Total | 299 | 785 | 28 | 72 | |
| B. Musty smell | 1 | 29 | 242 | 11 | 89 |
| 2 | 30 | 241 | 11 | 89 | |
| 3 | 52 | 219 | 19 | 81 | |
| 4 | 66 | 205 | 24 | 76 | |
| Total | 177 | 907 | 16 | 84 | |
| Inspector observations | |||||
| C. Musty smell | 1 | 16 | 256 | 6 | 94 |
| 2 | 10 | 262 | 4 | 96 | |
| 3 | 15 | 256 | 6 | 94 | |
| 4 | 28 | 245 | 10 | 90 | |
| Total | 69 | 1,019 | 6 | 94 | |
| D. Visible mold | 1 | 3 | 269 | 1 | 99 |
| 2 | 2 | 270 | 1 | 99 | |
| 3 | 4 | 267 | 1 | 99 | |
| 4 | 7 | 266 | 3 | 97 | |
| Total | 16 | 1,072 | 1 | 99 | |
aTotal homes varied between 1,084 and 1,088 due to missing values in responses
The geometric mean (GM) in cell equivalent units per mg dust (CE mg-1) and detection rate for each of the 36 molds that make up the ERMI are given in Table 2 for the 273 homes in the fourth quartile of the ERMI scale. Of these 273 homes, 132 (48%) had at least one positive assessment/observation of mold, while the remaining 141 homes (52%) had a “no” response to all four questions/observations. This would suggest the possibility that significant mold contamination may have existed in some homes that went undetected by either the home occupants or inspector. To test this hypothesis, we compared these two groups on the CE concentrations of the 36 index species using the Wilcoxon rank-sum test (Table 3). In all cases where at least 20% of homes were measured at or above minimum detection levels (MDL), there was no statistical difference between the two groups.
Table 2.
Geometric mean (GM) in cell equivalent units per mg dust (CE mg-1) and detection rate in the fourth or highest quartile of the 1,096 AHHS homes
| Mold species | GM | Detection |
|---|---|---|
| CE mg-1 | % | |
| Group 1 | ||
| Aspergillus flavus | 3 | 46.7 |
| Aspergillus fumigatus | 4 | 72.3 |
| Aspergillus niger | 7 | 83.2 |
| Aspergillus ochraceus | 5 | 54.4 |
| Aspergillus penicillioides | 936 | 98.9 |
| Aureobasidium pullulans | 416 | 97.8 |
| Aspergillus restrictus | 4 | 29.9 |
| Aspergillus sclerotiorum | 3 | 49.6 |
| Aspergillus sydowii | 8 | 52.2 |
| Aspergillus unguis | 3 | 44.2 |
| Aspergillus versicolor | 7 | 56.2 |
| Chaetomium globosum | 5 | 72.6 |
| Cladosporium sphaerospermum | 48 | 97.1 |
| Eurotium group | 624 | 98.5 |
| Penicillium brevicompactum | 11 | 61.7 |
| Penicillium corylophilum | 3 | 33.6 |
| Penicillium group 2 | 1 | 10.9 |
| Penicillium purpurogenum | 1 | 21.5 |
| Penicillium spinulosum | 2 | 32.1 |
| Penicillium variabile | 11 | 76.6 |
| Paecilomyces variotii | 5 | 67.2 |
| Scopulariopsis brevicaulis | 4 | 65.3 |
| Scopulariopsis chartarum | 3 | 59.1 |
| Stachybotrys chartarum | 4 | 51.8 |
| Trichoderma viride | 2 | 56.2 |
| Wallemia sebi | 119 | 91.6 |
| Group 2 | ||
| Alternaria alternata | 28 | 89.1 |
| Acremonium strictum | 4 | 65.3 |
| Aspergillus ustus | 3 | 56.9 |
| Cladosporium cladosporioides Type 1 | 409 | 99.3 |
| Cladosporium cladosporioides Type 2 | 5 | 73.7 |
| Cladosporium herbarum | 16 | 79.2 |
| Epicoccum nigrum | 105 | 92.3 |
| Mucor group | 27 | 97.1 |
| Penicillium chrysogenum Type 2 | 11 | 74.5 |
| Rhizopus stolonifer | 2 | 37.6 |
Table 3.
The Wilcoxon test results to detect systematic trends in the proportions of yes/no responses across the fourth ERMI quartile
| Mold | Mediana CE mg-1 dust | % <MDL | Wilcoxon p valueb | ||
|---|---|---|---|---|---|
| All no | Some yes | All no | Some yes | ||
| N = 141 | N = 132 | N = 141 | N = 132 | ||
| Group 1 | |||||
| Aspergillus flavus | <1 | <1 | 53% | 52% | 0.677 |
| Aspergillus fumigatus | 3 | 3 | 31% | 22% | 0.432 |
| Aspergillus niger | 5 | 5 | 16% | 18% | 0.985 |
| Aspergillus ochraceus | 2 | 5 | 49% | 42% | 0.574 |
| Aspergillus penicillioides | 750 | 757 | 1% | 2% | 0.935 |
| Aureobasidium pullulans | 404 | 408 | 2% | 2% | 0.957 |
| Aspergillus restrictus | <1 | <1 | 72% | 67% | 0.446 |
| Aspergillus sclerotiorum | 2 | <1 | 45% | 55% | 0.193 |
| Aspergillus sydowii | 6 | 5 | 46% | 49% | 0.657 |
| Aspergillus unguis | <1 | <1 | 54% | 58% | 0.390 |
| Aspergillus versicolor | 3 | 4 | 48% | 38% | 0.223 |
| Chaetomium globosum | 3 | 4 | 28% | 27% | 0.873 |
| Cladosporium sphaerospermum | 46 | 43 | 3% | 3% | 0.185 |
| Eurotium group | 700 | 510 | 2% | 1% | 0.507 |
| Penicillium brevicompactum | 6 | 6 | 40% | 35% | 0.642 |
| Penicillium corylophilum | <1 | <1 | 67% | 67% | 0.985 |
| Penicillium group 2 | <1 | <1 | 94% | 86% | 0.031 |
| Penicillium purpurogenum | <1 | <1 | 81% | 77% | 0.379 |
| Penicillium spinulosum | <1 | <1 | 70% | 64% | 0.151 |
| Penicillium variabile | 14 | 12 | 27% | 20% | 0.714 |
| Paecilomyces variotii | 3 | 3 | 33% | 33% | 0.480 |
| Scopulariopsis brevicaulis | 2 | 2 | 33% | 36% | 0.333 |
| Scopulariopsis chartarum | 2 | 1 | 36% | 43% | 0.427 |
| Stachybotrys chartarum | 1 | 1 | 49% | 48% | 0.875 |
| Trichoderma viride | 1 | 1 | 46% | 42% | 0.888 |
| Wallemia sebi | 90 | 153 | 11% | 6% | 0.264 |
| Group 2 | |||||
| Alternaria alternata | 37 | 37 | 11% | 10% | 0.939 |
| Acremonium strictum | 3 | 3 | 35% | 33% | 0.597 |
| Aspergillus ustus | 1 | 1 | 43% | 44% | 0.409 |
| Cladosporium cladosporioides 1 | 470 | 439 | 1% | 1% | 0.908 |
| Cladosporium cladosporioides 2 | 4 | 3 | 28% | 24% | 0.631 |
| Cladosporium herbarum | 12 | 15 | 18% | 22% | 0.471 |
| Epicoccum nigrum | 140 | 86 | 9% | 6% | 0.797 |
| Mucor racemosus | 29 | 22 | 4% | 2% | 0.654 |
| Penicillium chrysogenum 2 | 7 | 10 | 27% | 23% | 0.371 |
| Rhizopus stolonifer | <1 | <1 | 62% | 62% | 0.662 |
aMedian values reported were computed using a Kaplan–Meier survival model with data modified to account for left-censored data (% <MDL percentage of homes with occurrence less than the minimum detection limit)
bStatistical comparisons are not recommended when either or both groups show >80% non-detections. The only mold that appears to show a statistical difference between the two groups (Penicillium group 2) had >80% non-detections in both groups. Therefore, it is an unreliable statistical test.
On the other hand, is it possible that the ERMI underestimated mold contamination that the inspectors observed? Of 16 homes in the ERMI first quartile with a musty smell by inspection, there was only one that also had visible mold. (The other two with visible mold did not have a musty smell.) Therefore, a total of 18 homes in the first quartile had a musty smell and/or visible mold. The populations of molds in these 18 homes were compared to the 273 in the fourth quartile (Table 4). Using the Wilcoxon test and reporting the sample medians, only 26 of 36 molds were common. (Those with fewer than 20% detections were not included in the analysis.) None of the group 1 species was higher in concentration in these 18 first quartile homes than in the fourth quartile homes.
Table 4.
The Wilcoxon test was used in this study to detect systematic trends in the proportions of yes/no responses across the ERMI quartile 4 (Q4) and ERMI quartile 1 (Q1) homes in which visible mold or musty smell was detected by inspection
| Mold | Mediana CE mg-1 dust | % <MDL | Wilcoxon p value | ||
|---|---|---|---|---|---|
| Q4 | Q1 | Q4 | Q1 | ||
| n = 273 | n = 18 | N = 273 | n = 18 | ||
| Group 1 | |||||
| Aspergillus flavus | <1 | <1 | 53 | 67 | 0.160 |
| Aspergillus fumigatus | 3 | <1 | 27 | 56 | <0.001 |
| Aspergillus niger | 5 | 1 | 17 | 44 | 0.005 |
| Aspergillus penicillioides | 757 | 8 | 1 | 11 | <0.001 |
| Aureobasidium pullulans | 408 | 150 | 2 | 0 | 0.016 |
| Aspergillus sydowii | 5 | <1 | 48 | 72 | 0.043 |
| Chaetomium globosum | 3 | <1 | 27 | 78 | <0.001 |
| Cladosporium sphaerospermum | 44 | 1 | 3 | 44 | <0.001 |
| Eurotium group | 590 | 33 | 1 | 11 | <0.001 |
| Penicillium brevicompactum | 6 | <1 | 38 | 61 | 0.011 |
| Penicillium variabile | 13 | <1 | 23 | 72 | <0.001 |
| Paecilomyces variotii | 3 | <1 | 33 | 72 | <0.001 |
| Scopulariopsis brevicaulis | 2 | <1 | 34 | 78 | <0.001 |
| Scopulariopsis chartarum | 1 | <1 | 40 | 78 | <0.001 |
| Stachybotrys chartarum | 1 | <1 | 48 | 61 | 0.030 |
| Trichoderma viride | 1 | <1 | 44 | 67 | 0.025 |
| Wallemia sebi | 117 | 3 | 9 | 39 | <0.001 |
| Group 2 | |||||
| Alternaria alternata | 37 | 76 | 11 | 11 | 0.048 |
| Acremonium strictum | 3 | 6 | 34 | 33 | 0.426 |
| Aspergillus ustus | 1 | <1 | 43 | 67 | 0.018 |
| Cladosporium cladosporioides 1 | 460 | 301 | 1 | 6 | 0.185 |
| Cladosporium cladosporioides 2 | 4 | 3 | 26 | 22 | 0.610 |
| Cladosporium herbarum | 14 | 66 | 20 | 11 | 0.039 |
| Epicoccum nigrum | 110 | 86 | 7 | 6 | 0.558 |
| Mucor racemosus | 25 | 11 | 3 | 17 | 0.067 |
| Penicillium chrysogenum 2 | 9 | 3 | 25 | 28 | 0.314 |
aMedian values reported were computed using a Kaplan–Meier survival model with data modified to account for left-censored data (% <MDL percentage of homes with occurrence less than the minimum detection limit)
The national ERMI scale was compared to a set of inner city homes. The cumulative percentages of ERMI values in the homes of the 233 inner city east-Baltimore homes, where childhood asthma is very common, are shown in Figure 1, adjacent to the cumulative percentages from the AHHS national survey of homes. The Baltimore curve is shifted to the right of the US survey curve indicating a consistently increased trend of greater mold burdens among the inner city east-Baltimore study homes than found nationally.
Figure 1.

Cumulative percentages of ERMI values for a nationally representative sampling of homes in the USA (a) and for the 233 east-Baltimore inner city homes (b).
Discussion
The HUD 2006 American Health Home Survey was designed to describe the current state of environmental conditions in US housing. This survey examined or quantified parameters like pesticides, lead, asbestos, and our focus in this study, the mold burdens. Previously, the US EPA researchers had created a DNA-based method of mold analysis called MSQPCR. This method uses unique DNA sequences that provide for the identification of the molds and a florescent probe that allows for accurate quantification of the target sequence in a sample using an instrument called a Sequence Detector.17 Using MSQPCR technology to analyze the dust sample from each of the homes in the AHHS resulted in the creation of the ERMI scale. This scale estimates the mold burden in homes by identifying the diversity as well as the quantity of mold cells in the dust sample.
In the AHHS, the ERMI assessment was in agreement with the inspection and/or occupant’s answers about mold and moisture in 48% of fourth quartile homes. But neither of these human assessments indicated a moisture or mold problem in the other 52% of fourth quartile homes. Yet the population of the 26 water-damage indicator molds was statistically indistinguishable in any of these fourth quartile homes (Table 3) indicating that all of these fourth quartile homes had similar mold burdens. In these cases, the “walk-through” inspections and questionnaires missed hidden mold problems.
On the other hand, the ERMI values were low in 18 (7%) of first quartile homes where the inspector reported mold or musty smell (Table 1). But none of the 26 water-damage indicator molds in these 18 homes were similar to the population of these molds in fourth quartile homes (Table 4). In these homes, the human assessments overestimated the mold burden. This demonstrates that human assessments are hard to standardize. But many mold assessments are based on just such a visual/olfactory inspection during a “walk-through” and by questioning the occupants. These assessments cannot be carried out in an objective and quantitative manner because they rely on human perceptions.20
The collaboration of EPA and HUD researchers in the AHHS resulted in the development of the ERMI scale.9 The ERMI scale allows homes to be ranked in terms of relative water damage and mold growth and allows homes to be divided on the relative basis of rank order statistics using quartiles.9 The standard dust sample protocol combined with a DNA-based method of analysis makes this approach more objective and quantitative than the human assessment methods used in the AHHS.
What can we learn about homes in an epidemiological study using the ERMI scale? Epidemiological studies of asthmatic children’s homes have demonstrated an association between higher ERMI values and increased risk of asthma or asthma related symptoms.12,14
When the ERMI analysis was applied in east-Baltimore inner city homes of children with high rates of asthma, higher mold burdens (Figure 1) were found than in the random national sample.9 This finding is consistent with many studies of inner city housing which have demonstrated higher levels of asthma triggers, including molds, than housing in general.21–26
In conclusion, analysis of the 36 molds that make up the ERMI provided a more objective way to describe the mold burdens in homes. However, we recognize that each mold inspector has his/her own methods, years of experience, and equipment for finding mold growth. The ERMI is not designed to eliminate the investigator or inspection but to serve as another tool, like the infra-red camera or moisture meter, to help the inspector understand and describe hidden mold and moisture problems.
Acknowledgements
This research was partially supported by funding from the U.S. EPA Asthma Initiative.
Notice The U.S. EPA through its Office of Research and Development, funded and collaborated in the research described here. It has been subjected to the Agency’s peer review and has been approved as an EPA publication. Mention of trade names or commercial products, including those that embody EPA patented technology, does not constitute endorsement or recommendation by the EPA for use.
Abbreviations
- US EPA
United States Environmental Protection Agency
- MSQPCR
Mold-specific quantitative polymerase chain reaction
- ERMI
Environmental relative moldiness index
- HUD
Department of Housing and Urban Development
- AHHS
American Healthy Homes Survey
References
- 1.Institute of Medicine, National Academies of Science. Damp Indoor Spaces and Health. Washington, DC: National Academies Press; 2004. [PubMed]
- 2.Fisk WJ, Lei-Gomez Q, Mendell MJ. Meta-analyses of the associations of respiratory health effects with dampness and mold in homes. Indoor Air. 2007; 17: 284-296. [DOI] [PubMed]
- 3.Kercsmar CM, Dearborn DG, Schluchter MD, et al. Reduction in asthma morbidity in children as a result of home remediation aimed at moisture sources. Environ Health Perspec. 2006; 114: 1574-1580. [DOI] [PMC free article] [PubMed]
- 4.Burr ML, Matthews IP, Arthur RA, et al. Effects on patients with asthma of eradicating visible indoor mould: a randomized controlled trial. Thorax. 2007; 62: 767-772. [DOI] [PMC free article] [PubMed]
- 5.ASTM International, “Practice for Evaluating Residential Indoor Air Quality Concerns” D 7297-06. ASTM International, West Conshohocken, PA. 2007; 11.01: 1–28.
- 6.ASTM International, “Readily Observable Mold and Conducive to Mold in Commercial Buildings: Baseline Survey Process” E-2418. ASTM International, West Conshohocken, PA. 2006; 11.05: 1046–1060.
- 7.U.S. Environmental Protection Agency, Office of Air and Radiation, Indoor Environments Division (6609 J). “A Brief Guide to Mold, Moisture, and Your Home.” EPA 402-K-02-003, US EPA, Washington, D.C. 2002
- 8.Johnson D, Thompson D, Clinkenbeard R, Redus J. Professional judgment and the interpretation of viable mold air sampling data. J Occu Environ Hyg. 2008; 5: 656-663. [DOI] [PubMed]
- 9.Vesper SJ, McKinstry C, Haugland RA, et al. Development of an environmental relative moldiness index for homes in the U.S. J Occup Environ Med. 2007; 49: 829-833. [DOI] [PubMed]
- 10.Meklin T, Haugland RA, Reponen T, et al. Quantitative PCR analysis of house dust can reveal abnormal mold conditions. J Environ Monitor. 2004; 6: 615-620. [DOI] [PMC free article] [PubMed]
- 11.Meklin T, Reponen T, McKinstry C, et al. Comparison of mold concentrations in indoor and outdoor air sampled simultaneously and quantified by MSQPCR. Sci Total Environ. 2007; 382: 130-134. [DOI] [PMC free article] [PubMed]
- 12.Vesper SJ, McKinstry C, Haugland RA, et al. Relative moldiness index as predictor of childhood respiratory illness. J Exposure Sci Environ Epidemiol. 2007; 17: 88-94. [DOI] [PMC free article] [PubMed]
- 13.Vesper SJ, Varma M, Wymer LJ, Dearborn DG, Sobolewski J, Haugland RA. Quantitative PCR analysis of fungi in dust from homes of infants who developed idiopathic pulmonary hemorrhaging. J Occup Environ Med. 2004; 46: 596-601. [DOI] [PubMed]
- 14.Vesper S, McKinstry C, Haugland R, et al. Higher environmental relative moldiness index (ERMIsm) values measured in Detroit homes of severely asthmatic children. Sci Total Environ. 2008; 94: 192-196. [DOI] [PubMed]
- 15.Haugland RA, Brinkman NE, Vesper SJ. Evaluation of rapid DNA extraction methods for the quantitative detection of fungal cells using real time PCR analysis. J Microbiol Methods. 2002; 50: 319-323. [DOI] [PubMed]
- 16.Brinkman NE, Haugland RA, Wymer LJ, Byappanahalli M, Whitman RL, Vesper SJ. Evaluation of a rapid, quantitative real-time PCR method for cellular enumeration of pathogenic Candida species in water. Appl Environ Microbiol. 2003; 69: 1775-1782. [DOI] [PMC free article] [PubMed]
- 17.Haugland RA, Varma M, Wymer LJ, Vesper SJ. Quantitative PCR of selected Aspergillus, Penicillium and Paecilomyces species. Syst Appl Microbiol. 2004; 27: 198-210. [DOI] [PubMed]
- 18.Helsel DR. Nondetects and Data Analysis, Statistics for Censored Environmental Data. Hoboken: Wiley; 2005.
- 19.Diette GB, Hansel NN, Buckley TJ, et al. Home indoor pollutant exposures among inner-city children with and without asthma. Environ Health Perspect. 2007; 115: 1665-1669. [DOI] [PMC free article] [PubMed]
- 20.Jaakkola JJ, Hwang BF, Jaakkola N. Home dampness and molds, parental atopy, and asthma in childhood: a six-year population-based cohort study. Environ Health Perspect. 2005; 113: 357-361. [DOI] [PMC free article] [PubMed]
- 21.Gruchalla RS, Pongracic J, Plaut M, et al. Inner City Asthma Study: relationships among sensitivity, allergen exposure, and asthma morbidity. J Allergy Clin Immunol. 2005; 115: 478-485. [DOI] [PubMed]
- 22.Bonner S, Matte TD, Fagan J, Andreopoulos E, Evans D. Self-reported moisture or mildew in the homes of Head Start children with asthma is associated with greater asthma morbidity. J Urban Health. 2006; 83: 129-137. [DOI] [PMC free article] [PubMed]
- 23.Turyk M, Curtis L, Scheff P, et al. Environmental allergens and asthma morbidity in low-income children. J Asthma. 2006; 43: 453-457. [DOI] [PubMed]
- 24.Rabito FA, Iqbal S, Holt E, Grimsley LF, Islam TM, Scott SK. Prevalence of indoor allergen exposures among New Orleans Children with Asthma. J Urban Health. 2007; 84: 782-792. [DOI] [PMC free article] [PubMed]
- 25.Simons E, Curtin-Brosnan J, Buckley T, Breysse P, Eggleston PA. Indoor environmental differences between inner city and suburban homes of children with asthma. J Urban Health. 2007; 84: 577-590. [DOI] [PMC free article] [PubMed]
- 26.Matsui EC, Hansel NN, McCormack MC, Rusher R, Breysse PN, Diette GB. Asthma in the inner city and the indoor environment. Immunol Allergy Clin North Am. 2008; 28: 665-686. [DOI] [PMC free article] [PubMed]