

Abstract
Introduction
Most current animal models of hindlimb ischemia use acute arterial occlusion that does not accurately reflect the pathogenesis of gradual arterial occlusion in humans. We therefore developed the first mouse model of gradual arterial occlusion and tested the hypothesis that the mechanisms regulating blood flow recovery are critically dependent on the rate of arterial occlusion.
Methods
Gradual arterial occlusion was induced by placing ameroid constrictors on the proximal and distal left femoral artery, and ligating the femoral arterial branches (n=36). Acute arterial occlusion was accomplished by excising the left femoral artery (n=36). The blood flow recovery was studied by laser Doppler imaging. Differential gene expression between these two models was assessed by quantitative real time PCR. Inflammatory and progenitor cells recruitment were determined by immunohistochemistry.
Results
We found that hypoxia-related genes increased significantly in the calf, but not in the thigh, after gradual and acute femoral arterial occlusion (p<0.05). Shear-stress dependent genes and inflammatory genes were upregulated immediately in the thigh only after acute femoral arterial occlusion (p<0.05). These differences in gene expression were consistent with increased SDF-1α expression, recruitment of macrophages and hemangiocytes, and higher blood flow recovery after acute arterial occlusion than after gradual arterial occlusion (p<0.05).
Conclusion
This is the first study to show the mechanisms that regulate blood flow recovery are critically dependent on the rate of arterial occlusion. This novel model of gradual arterial occlusion may more closely resemble the human diseases, and may provide more accurate mechanistic insights for creating novel molecular therapies.
Keywords: recovery of blood flow, ischemia, collateral artery, hemangiocyte, gene expression
Introduction
Critical limb ischemia, the most severe clinical manifestation of peripheral arterial disease, is responsible for more than 150,000 lower limb amputations per year in the United States (1). It is caused primarily by the gradual progression of chronic atherosclerotic occlusive disease. However, most experimental animal models of critical limb ischemia utilize acute arterial occlusion, which does not replicate accurately the gradual arterial occlusion seen in humans. Although rabbit and rat models of gradual arterial occlusion have been described (2, 3), a mouse model has not. A mouse model of hindlimb ischemia due to gradual arterial occlusion would provide a more powerful platform for defining the mechanisms which mediate blood flow recovery after gradual occlusion. In addition, the experiments generated through this model would produce possible therapeutic approaches more likely to benefit patients who have chronic PAD.
Collateral artery enlargement, a form of arteriogenesis, is the primary way by which blood flow is restored to an ischemic hindlimb (4, 5, and 6). Three related major mechanisms promoting collateral artery enlargement after acute arterial occlusion have been proposed, shear stress (7, 8, 9), inflammation (10, 11), and recruitment of progenitor cells to the site of ischemia (12). Acute arterial occlusion causes a sudden pressure gradient between the proximal and distal portions of collateral arteries. This pressure gradient increases the velocity of blood through collateral arteries, which induce changes in gene expression through elements responsive to changes in shear stress (8). In addition, inflammatory cells, including monocytes and macrophages, infiltrate into the region of collateral arteries and promote arteriogenesis (10, 11). Endothelial progenitor cells, as well as hemangiocytes (13) play an important role in endothelial maintenance, and for re-endothelialization and neovascularization (12, 14). However, the mechanisms promoting collateral artery enlargement are unknown after gradual arterial occlusion, in large part due to the lack of an appropriate mouse model.
These experiments were designed to assess the molecular and cellular mechanisms regulating arteriogenesis, angiogenesis and recovery of blood flow that occur in response to gradual femoral arterial occlusion. We hypothesized that spatial and temporal changes in gene expression, blood flow recovery, as well as hemangiocyte/macrophage recruitment are dependent on the rate of arterial occlusion.
Materials and Methods
Animals
A total of 72 wild type (C57BL/6) 3–5 months old mice, were used for the acute (n=36) and gradual (n=36) arterial occlusion models, see study design in supplementary. Mice were housed in an environmentally controlled room, and fed with rodent chow and water ad libitum. The care of mice complied with the National Research Council Guide for the Care and the Use of Laboratory Animals. All protocols were approved by the Institutional Animal Care and Use Committee at the University of California, San Francisco.
Hindlimb Ischemia and Sham Operations
Mice were anesthetized using 2% isofluorane with a consistent oxygen flow of 2L/min. Acute femoral arterial occlusion was induced by excision of the left femoral artery and ligation of all femoral artery branches as described previously (15). Gradual femoral arterial occlusion was induced by ligating all branches of the left femoral artery and then placing ameroid constrictors (0.25 mm internal diameter) around the proximal and distal femoral artery as previously described (3). The ameroid constrictor consisted of a stainless steel casing surrounding a hygroscopic casein material (Research Instruments SW, Escondido, CA). The ameroid constrictors were sterilized with ethylene gas before being implanted. A sham surgical procedure (control), consisting of femoral artery isolation and branch dissection, was performed for both acute and gradual arterial occlusion groups.
Experimental Design
To determine blood flow recovery after acute and gradual femoral arterial occlusion, Laser Doppler Perfusion Image (LDPI) scanning was performed up to 42 days postoperatively. Angiograms were performed on mice in both groups. See supplementary.
To determine temporal and spatial differences in gene expression after induction of acute and gradual arterial occlusion, mice were divided into two subgroups: early and late time points. In the gradual occlusion model, the nadir of blood flow represented the time of complete arterial occlusion. In the acute arterial occlusion group, the thigh (the site of collateral artery enlargement or arteriogenesis) and calf gastrocnemius muscles (ischemic region where angiogenesis occurs) were harvested at 6 hours (early time points) and 24 hours (late time points) after femoral arterial excision. In the gradual artery occlusion group, muscles were collected at 24 hours (early time points) and 3 days (late time points) after the nadir in blood flow (as detected by LDPI) for the gradual occlusion group.
It was not possible to use identical time points since the limb blood flow could not be quantitated continuously, blood flow was measured once daily until it reached its nadir when complete arterial occlusion occurred. Give these constraints, we chose early and late time points that were proportionate to the rate of arterial occlusion. These muscle samples were analyzed by quantitative real time polymerase chain reactions (Q-RT-PCR). Pilot studies of gradual arterial occlusion revealed that the time points 24h and 3 days after the nadir of perfusion were the most critical to parallel the rate of blood flow recovery seen in the acute occlusion model.
To investigate macrophage and hemangiocyte recruitment, we studied calf gastrocnemius and thigh muscle after both gradual and acute occlusion at 3 and 7 days after arterial occlusion.
Histology and Immunohistochemistry
Capillary to myofiber ratio
The calf gastrocnemius muscle was harvested on post-operative day 35 after gradual (n=7) and acute (n=9) arterial occlusion, as well as from non-ischemic control mice (n=4). Endothelial cells were identified on cryosections by CD 31 antibody staining (PharMingen, San Jose, CA). Capillary number in each animal was calculated by counting the ratio of CD31 positive cells per muscle fiber in three sections. Mean values were calculated by averaging serial sections in each mouse.
Percent of muscle necrosis and macrophage recruitment
In order to study the extent of muscle necrosis and macrophage infiltration after acute and gradual femoral arterial occlusion, the calf muscle was harvested on day 3 in the acute model and in the gradual occlusion model. Hematoxylin and eosin (HE) staining was conducted on transverse sections of calf gastrocnemius muscle. The percentage of necrosis over whole cross section area was measured using Adobe Photoshop software. MOMA2 rat anti mouse monoclonal antibody (MCA519G, Serotec, Raleigh, NC), and a secondary antibody Cy3 conjugated donkey anti-rat antibody (Jackson Laboratories, Bay Harbor, ME) were used to detect macrophages.
Hemangiocyte recruitment and SDF-1α protein expression
Hemangiocytes were detected in thigh and calf gastrocnemius muscles from each group at post occlusion day 3 and day 7 (n=4 in each group). Consistent with the definition from Jin et al, hemangiocytes were identified by double staining with VEGFR1 and CXCR4 (BD Pharmingen) primary antibodies. The secondary antibodies were FITC conjugated donkey anti rat antibody for VEGFR1, and Cy3 conjugated donkey anti mouse antibody (both from Jackson Laboratories, Bay Harbor, ME). The quantitative analysis of hemangiocytes in thigh muscle at different time points was conducted after acute vs. gradual occlusion.
Double immunostaining of SDF-1α and CD31 was accomplished with an SDF-1α primary antibody (eBioscience) and CD31 primary antibody. The secondary antibody was Cy3 conjugated anti rabbit antibody for SDF-1α and FITC conjugated donkey anti mouse antibody for CD31 detection.
mRNA Preparation and Primer Design (see supplement)
Quantitative Real Time PCR
Quantitative assessments of mRNA levels were conducted by RT-PCR using a Q-RT-PCR Biosystem Opticon 2 (MJ Research, CA) with Invitrogen Reverse Transcription Reagents. 18s RNA was used as an internal control (16). The relative quantitative value of each target gene was normalized and expressed as ΔCt:
Statistical Analysis
Relative gene expression levels were calculated by comparing Q-RT-PCR results with an internal standard housekeeping gene using the equations outlined above. The fold increase of gene expression was determined by calculating the gene expression ratios in two different ways. First, ratios were computed by comparing the mean value of the relative gene expression in the ischemic hindlimb to that of the non-ischemic leg. Second, the genes that showed significant differences between the ischemic and the non-ischemic hindlimb were further analyzed by comparing the mean value of the relative gene expression in the operated leg of an ischemic mouse with that of a mouse that underwent a sham operation.
Differences among several groups at each time point were analyzed using one-way ANOVA (Fisher’s PLSD) for multiple comparisons. Differences between two groups were analyzed using unpaired t-tests. p values < 0.05 were considered statistically significant. Values are expressed as mean ± standard deviation, unless otherwise indicated.
Results
The Extent of Blood Flow Recovery is Dependent on the Rate of Acute vs. Gradual Femoral Arterial Occlusion
In the acute occlusion group, blood flow in the calf was reduced to its lowest level (27 ± 3% of the right leg flow) after the femoral artery was excised immediately post-operatively. On post-operative day 7, blood flow had recovered to 66 ± 10 % of pre-operation level. The extent of blood flow recovery reached a maximum of 84 ± 5% on post-operative day 35 (Figure 1A and 1C).
Figure 1. A–C. Laser Doppler images of blood flow in the calf and foot after induction of acute vs. gradual arterial occlusion.

Blood perfusion was monitored with LDPI at different time points: pre-operation (Pre), operation day (OP), post-operative day 7, 14 and 35 (PO 7, PO 14 and PO 35 respectively). White arrow and arrowhead indicate the blood perfusion in ischemic leg on the operation day after induction of acute (A) and gradual (B) arterial occlusion, respectively. The gradient color scale from white to dark blue indicates the blood perfusion level (high to low). White and black frame indicate the areas of foot and calf scanned by LDPI, respectively. The Y-axis of Figure 1C shows the ratio of the blood flow in the left (operated) over right (non-operated) calf muscle. The X-axis shows different time points of LDPI measurement. * Statistically significant (p < 0.05); M±SEM, n=14).
In the gradual occlusion group, the ratio of blood flow in the ischemic vs. non-ischemic side after ameroid placement was 96 ± 8% (Figure 1B and 1C), and gradually reached a nadir of 52 ± 3% by post-operative day 14. Over the next two weeks, blood flow increased to 68 ± 4% on post-operative day 35, which was lower than the final recovery level achieved after acute arterial occlusion (p =0.011). Similar blood flow recovery patterns were also observed in the foot (see data supplement). The differences in blood flow recovery between acute and gradual occlusion were characterized by SLOPE analysis (see supplement)
Gene Expression in the Calf Gastrocnemius Muscle is dependent on the Rate of Arterial Occlusion
The expression patterns of several genes known to be crucial for the response of the hindlimb to ischemia were significantly different after acute vs. gradual arterial occlusion. The expression of HIF-1α mRNA increased significantly at earlier time points after both acute and gradual femoral artery occlusion. However, expression levels in the calf muscle were significantly higher (~2.5 fold) after acute than after gradual occlusion (p<0.05). HIF-1α mRNA returned to baseline levels at later time points after acute and gradual occlusion (Figure 2A).
Figure 2. Gene expression in calf muscle after induction of acute or gradual arterial occlusion.

Q-RT-PCR was used to determine gene expression level of HIF-1α (A), VEGF (B), NF-κB (C), Egr-1 (D), PDGF (E), MCP-1 (F), ICAM (G), and VCAM (H) in calf muscle after induction of acute vs. gradual arterial occlusion. Gene expression values at different time points are displayed along the Y-axis as the ratio of mRNA from the left calf muscle in ischemic mouse group over mRNA from left calf in the sham control mice. * Statistically significant differences (p < 0.05) between groups were shown by linkage. The error bars represent the standard deviation in each group (n=4).
VEGF, a gene activated in response to HIF-1α, followed a similar pattern of expression of HIF1α after acute occlusion. However no significant increase in expression was noted after gradual occlusion (Figure 2B). The expression of other hypoxia-related transcription factors including NF-κB (Figure 2C), egr-1 (Figure 2D) and gene PDGF (Figure 2E) were increased significantly within 6 hours, then returned to baseline levels within 24 hours after acute occlusion (p<0.05). In contrast, gradual occlusion did not significantly affect the expression levels of these three genes. In addition, the expression of eNOS did not increase in the calf after either acute or gradual femoral arterial occlusion (Table 2).
Table 2.
Summary of gene expression in calf and thigh muscles following induction of acute and gradual femoral arterial occlusion
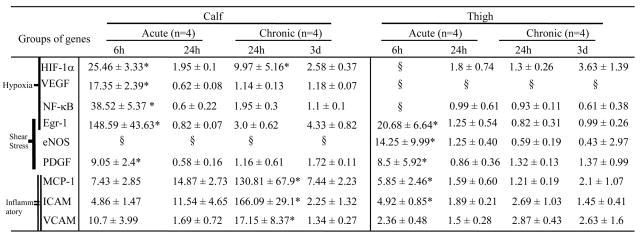 |
Values (mean ± SD) in table show the ratio (fold changed) of ischemia over sham in left hindlimb.
statistic significance (p < 0.05) between groups (see linkage in figures 2-3).
The value of mRNA did not show significant differences between ischemic side (left) and non-ischemic (right) side. Therefore the ratio of ischemia over sham was not calculated.
Other genes related to inflammatory responses such as MCP-1, ICAM, and VCAM also demonstrated distinct patterns in the acute vs. gradual models. After acute occlusion MCP-1 and ICAM expression were not increased (Figure 2F and 2G), whereas VCAM expression was increased (Figure 2H). The increase in VCAM expression seen in the acute model was less than that seen in the gradual occlusion model. After gradual femoral arterial occlusion, the inflammatory genes MCP-1, ICAM and VCAM were upregulated significantly 24 hours after the nadir of blood flow, and returned to basal levels after 3 days (Figure 2F and 2G).
Gene Expression in Collateral Artery Region (Thigh Muscle) is Dependent on the Rate of Arterial Occlusion
After acute arterial occlusion, the expression of the hypoxia-inducible genes of HIF-1α and VEGF did not increase detectably in thigh muscle (Table 2). This lack of increased expression of hypoxia-inducible genes is consistent with the relative lack of ischemia at the thigh level in these models. However, the expression of genes related to shear stress including eNOS (Figure 3A), transcription factor egr-1 (Figure 3B), and PDGF (Figure 3C) were significantly increased 6 hours after the induction of acute occlusion. By 24 hours after occlusion, expression levels of all three genes had returned to baseline levels.
Figure 3. Gene expression in thigh muscle after induction of acute or gradual arterial occlusion.
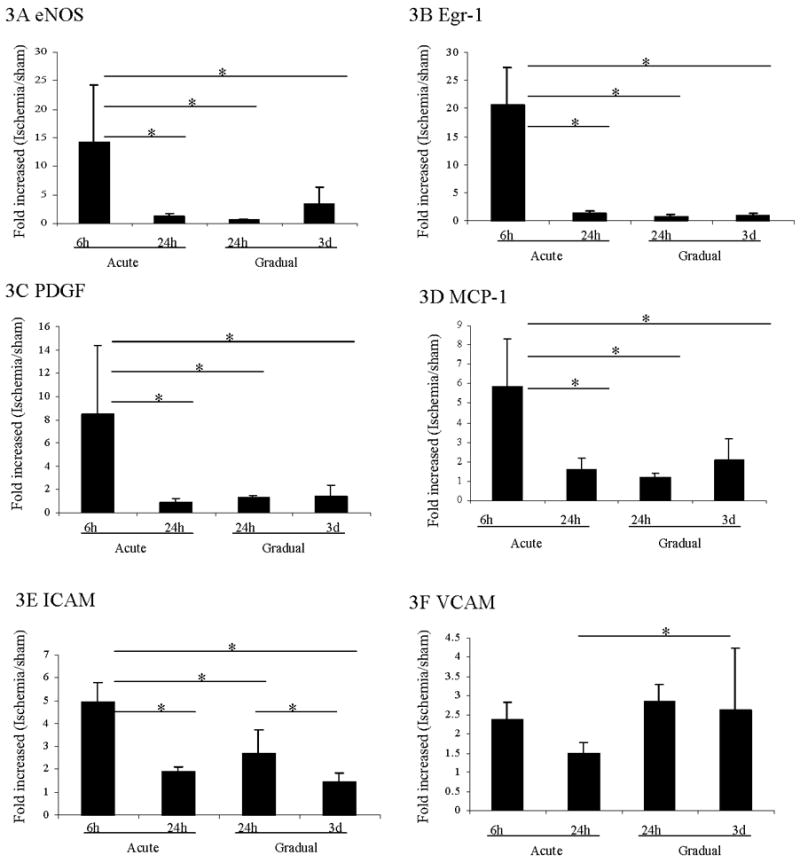
The expression of eNOS (A), Egr-1 (B), PDGF (C), MCP-1 (D), ICAM (E) and VCAM (F) in thigh muscle after induction of acute or gradual arterial occlusion was examined by Q-RT-PCR. The Y-axis shows the gene expression values expressed as the ratio of mRNA of the thigh from the side of arterial occlusion over mRNA of the thigh in sham control mice. The X-axis shows the different time points (see figure 2) in each group. * Statistically significant differences (p < 0.05) between groups were shown with linkage. The error bars represent the standard deviation in each group (n=4).
In contrast, after gradual occlusion, the expression of eNOS, egr-1 and PDGF did not change from baseline. In addition, the expression levels of NF-κB did not change after either acute or gradual occlusion (Table 2).
Unlike in the ischemic calf, the expression of the inflammatory genes MCP-1 and ICAM (Figure 3D–3E) were significantly upregulated in the thigh 6 hours after acute occlusion and returned back to baseline level after 24 hours. In contrast, after gradual arterial occlusion, MCP-1 expression levels were not significantly increased from baseline level. ICAM expression was significantly upregulated 24 hours post-nadir after gradual occlusion. This increase was lower than that seen after acute occlusion.
Lastly, VCAM showed a different pattern of expression compared to MCP-1 and ICAM (Figure 3F). VCAM was significantly upregulated 3 days post-nadir of blood flow with gradual femoral arterial occlusion (p<0.05).
Capillary Density is Increased After Acute and Gradual Occlusion, but no difference in angioscore
The ratio of capillaries to muscle fibers increased more in the acute occlusion group (Figure 4B) than after gradual occlusion (Figure 4C) or control groups (Figure 4A). The statistic analysis result was showed in Figure 4D.
Figure 4. Angiogenesis and arteriogenesis including angioscore and collateral diameter after acute vs. gradual occlusion.
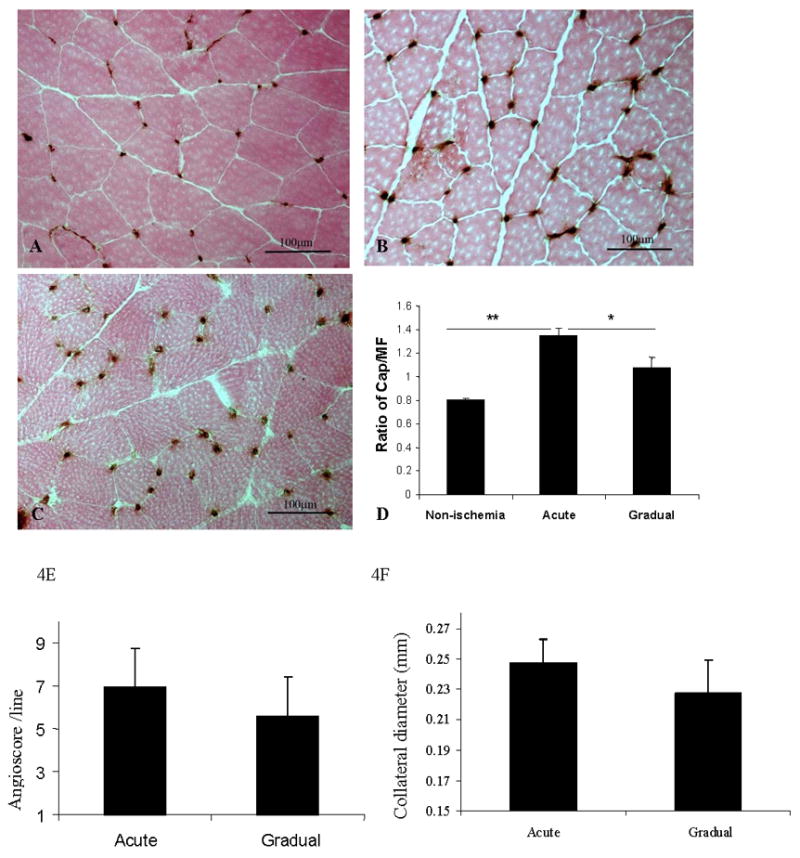
4A–4D. Capillary immunostaining (CD31) and quantitative analysis of capillary density in calf muscle on postoperative day 35.
Representative images from control (A), acute arterial occlusion (B) and gradual arterial occlusion (C) groups are shown. Capillary density, expressed by the ratio of number of capillaries over muscle fiber (Y-axis), was significantly greater in calf muscle in the acute arterial occlusion group (n=9) than in the gradual arterial occlusion group (n=7), or in normal muscle (n=4) (Figure D. ** p< 0.01 and * p<0.05.
4E–4F. Angioscore and collateral diameter in acute vs. gradual arterial occlusion.
Angiograms were performed on mice with acute vs. gradual arterial occlusion on post-operative day 35. Angioscore tended to be higher after acute arterial occlusion than after gradual arterial occlusion, although the difference between the two groups was not statistically significant (p = 0.18). (F) The diameters of the three largest collateral arteries in both the acute and gradual occlusion models were measured using Fovea Pro software. There was no statistically significant difference between the models.
Angioscores tended to be higher after acute occlusion than after gradual occlusion (p = 0.18) (Figure 4E). However, when the diameters of the three largest collateral arteries were measured in each mouse, no significant differences were detected between the acute and gradual occlusion groups (p = 0.24, Figure 4F).
The Extent of Muscle Necrosis and Macrophage Recruitment is Dependent on the Rate of Arterial Occlusion
Mice in the gradual occlusion group (Figure 5B and 5D) had better preserved muscle histological structure than in the acute occlusion group at post arterial occlusion day 3 (Figure 5A and Figure 5C). The percentage of necrosis of calf gastrocnemius muscle was significantly greater in acute group vs. gradual occlusion group (Figure 5G) (p<0.001). Essentially, no significant necrosis occurred in the gastrocnemius muscle after induction of gradual arterial occlusion.
Figure 5. A–G. Muscle necrosis detection and macrophage immunostaining in gastrocnemius 3 days after acute vs. gradual arterial occlusion.

A–D, Arrows in A and B show necrotic areas after acute and gradual occlusion. C and D show the same figure of A and B at higher magnification, respectively. Star identifies the area of necrosis in C.
Figures 5E–5F, The immunostaining of macrophages (Cy3 labeled) in gastrocnemius (white arrows) after acute arterial occlusion (E) and after gradual arterial occlusion (F).
Most macrophages were localized to the necrotic areas of the calf muscle after induction of acute occlusion (Figure 5E). Substantially fewer macrophages were seen in the calf gastrocnemius muscle after the induction of gradual occlusion, compared to acute occlusion (Figure 5F).
SDF-1α expression and Hemangiocytes Recruitment is Dependent on the Rate of Occlusion
SDF-1α was highly expressed in both calf gastrocnemius (Figure 6A) and thigh muscles (Figure 6C) at day 3 after acute occlusion. In contrast, SDF-1α expression was diminished after gradual occlusion in both calf gastrocnemius (Figure 6B) and in thigh muscles (Figure 6D).
Figure 6. Double immunostaining of SDF-1α and CD31 in gastrocnemius and thigh muscle 3 days after acute vs. gradual occlusion.
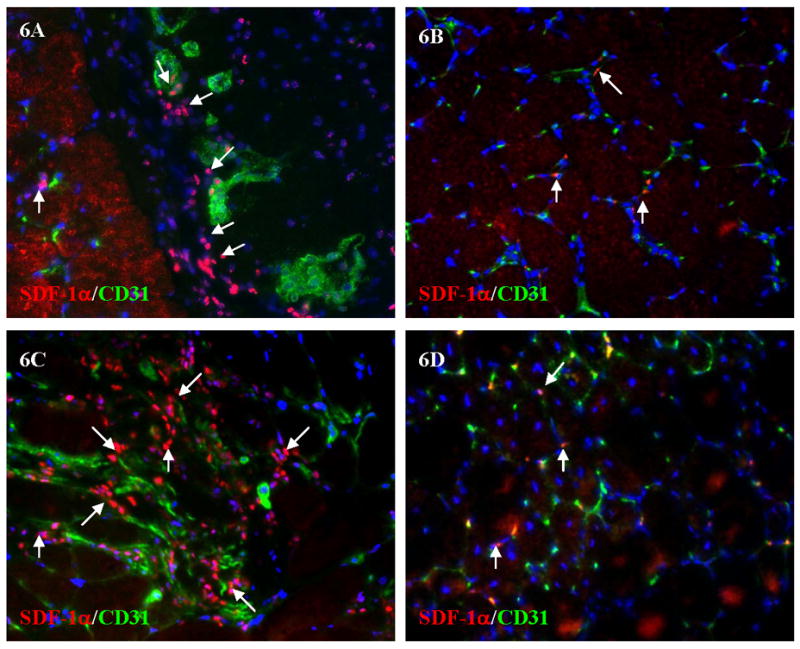
Arrows showed part of SDF-1α positive cells after acute (A) and gradual (B) occlusions in gastrocnemius. 6C and 6D showed the similar results of SDF-1α and CD31 double staining in thigh muscle after acute (6C) and gradual occlusion (6D).
Hemangiocytes, which are positive for both CXCR4 and VEGFR1, were detected in gastrocnemius and thigh muscles at 3 and 7 days after acute and gradual arterial occlusion. At 3 days after occlusion, a higher concentration of hemangiocytes was detected in gastrocnemius and thigh muscles after acute occlusion than after the gradual occlusion (Figure 7A–D). At 7 days after occlusion, in the thigh muscle, more hemangiocytes were detected after acute occlusion (Figure 8A) than after gradual occlusion (Figure 8B). The quantitative analysis of hemangiocyte infiltration was shown in Figure 8E.
Figure 7. Hemangiocyte immunostaining with VEGFR-1 and CXCR4 in gastrocnemius and thigh muscles 3 days after acute vs. gradual occlusion.
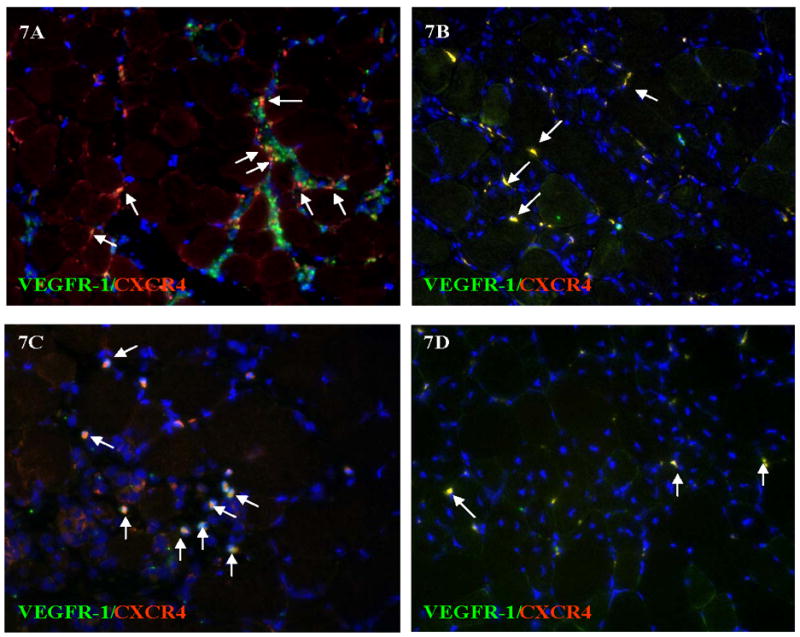
Some cells are single stained for VEGFR-1 (green) or CXCR4 (red), hemangiocytes are positive for both VEGFR1 and CXCR4, labeled by arrows. More hemangiocytes are identified after acute occlusion (7A and 7C) than after gradual occlusion (7B and 7D) in both gastrocnemius (7A and 7C) and in thigh muscle (7B and 7D).
Figure 8. More hemangiocytes are integrated into the small vessels in thigh muscle 7 days after acute occlusion.

More hemangiocytes were detected in thigh muscle at post occlusion day 7 after acute occlusion (8A) than after gradual occlusion (8B). The enlargement of images 8A and 8B are shown in 8C and 8D respectively. Asterisks show the lumen of small vessels. Arrows show the hemangiocytes, which are double positive for both VEGFR-1 and CXCR4. Hemangiocyte line along the endothelium of a small vessel. The quantitative analysis of hemangiocytes in each field at different time points post occlusion is shown in Figure 8E. * indicates p<0.01
Of note, some hemangiocytes were localized along the outer boarder of small arterioles (arrow heads in Figure 8A, 8C) 7 days after arterial occlusion.
Discussion
The mechanisms regulating blood flow recovery are distinct after acute and gradual arterial occlusion. Gradual arterial occlusion caused changes in blood flow recovery patterns, spatio-temporal gene expression, skeletal muscle histology, macrophage infiltration and hemangiocyte recruitment that were distinctly different than after acute arterial occlusion. In the gradual arterial occlusion model, no muscle necrosis occurred. In contrast, extensive muscle necrosis in gastrocnemius muscle occurred after acute arterial occlusion (Figures 5A–5F). This extensive muscle necrosis is not seen in humans suffering from peripheral arterial disease and appears to strongly affect the molecular and cellular mechanisms examined in this study.
Blood flow recovery, unexpectedly, was less complete after gradual arterial occlusion than after acute arterial occlusion. This less complete recovery of blood flow may be due to the lack of upregulation of shear stress responsive and inflammatory genes in the region of collateral artery enlargement in the thigh after gradual occlusion (Figure 3). These important differences in blood flow recovery and muscle necrosis are related to the rate of reduction in blood flow. The rapid and extensive muscle necrosis that occurs in mouse models of acute arterial occlusion is not seen commonly in clinical cases of critical limb ischemia in humans who typically have foot pain at rest, foot ulcers, toe gangrene, and rarely have any muscle necrosis in the calf or thigh muscles. Therefore, studying a model of gradual arterial occlusion should be more relevant to understand the pathogenesis of human critical hindlimb ischemia.
The expression of the hypoxia related genes HIF-1α and VEGF increased in the ischemic calf after acute and gradual arterial occlusion, but not in the thigh (the region of collateral arteries). VEGF is potent inducer of angiogenesis during development and under pathological conditions (17). HIF-1α, VEGF-VEGFR2 pathway may be involved in angiogenesis (18). The higher level of HIF-1α expression after acute arterial occlusion was also consistent with the higher capillary-to-muscle fiber ratio seen in the calf gastrocnemius muscle after acute occlusion (Figure 4D and 4F).
Another hypoxia-related gene, NF-κB, an upstream mediator in the regulation of VEGF expression during hypoxia (19), as well as Egr-1 increased after acute arterial ligation. Although the signaling pathways and mechanisms involved in hypoxia-induced gene expression are complex, and incompletely characterized,Egr-1 knockout mice suffer severe limb necrosis after acute arterial ligation (20). In clinical situations of gradual arterial occlusion, such as patients with angina pectoris or atherosclerotic peripheral arterial occlusive disease, increased serum levels of ICAM and VCAM are considered markers of endothelial activation and dysfunction (21). During tissue ischemia, a crucial role is played by the release of these soluble factors and subsequent injuring and dismantling of the endothelial structure (22). Elevated levels of ICAM and VCAM indicate both leukocyte activation and endothelial injury during ischemia (23, 24). Sustained inflammatory gene expression of MCP-1, ICAM and VCAM without the increase of angiogenesis indicated the different mechanism in acute and chronic models. It may suggest that chronic inflammation occurs in the calf after induction of gradual femoral arterial occlusion. A potential application of this finding would be to determine if upregulation of inflammatory genes is a clinical marker for those patients who are most likely to progress to critical limb ischemia.
Although the specific molecular mechanisms regulating vascular remodeling in response to acute versus gradual arterial occlusion are unknown, increasing evidence suggests that shear stress and inflammatory genes play critical roles in collateral artery enlargement (25, 26, and 27). Fluid shear stress generated by blood flowing through collateral arteries can profoundly influence endothelial cells by modulating gene expression and post translational changes in proteins (28). After induction of acute occlusion in our study, the shear- stress inducible genes eNOS, PDGF, and transcription factor Egr-1 were significantly upregulated in the thigh muscles. This expression pattern of these shear-stress related genes in vivo after acute arterial occlusion are consistent with in vitro studies using cultured cells. Shear stress applied to cultured endothelial cells increased eNOS mRNA level and nitric oxide (NO) production (29, 30, 31, 32). NO regulates shear-stress mediated induction of PDGF-A, MCP-1 (2), ICAM (27), as well as Egr-1 gene expression in cultured endothelial cells (26). Induced MCP-1 and ICAM promote arteriogenesis by adherence of monocytes (33), which express growth factors and cytokines like fibroblast growth factor (34, 35). Increased expression of MCP-1 in vivo was detected in the adductor muscle after acute occlusion by gene array analysis (36).
Shear stress likely increased due to increased flow in collateral arteries after acute occlusion. Shear stress may activate inflammatory gene expression (Figure 3), which promotes arteriogenesis by increased macrophage infiltration (Figure 5), as well as by the activation and proliferation of endothelial and smooth muscle cells in small arterioles. The accelerated and greater blood flow recovery seen after acute occlusion may be due to the greater induction of shear stress (Figure 3A–3C), inflammatory genes (Figure 3D – 3E) and macrophage infiltration. In contrast, MCP-1 was only slightly increased, and ICAM, and VCAM were moderately increased in thigh muscle with gradual occlusion (Figure 3D–3F). Shear-stress related gene expression did not increase with gradual occlusion. Taken together, these results indicate that the gradual onset of ischemia in our new mouse model leads to a very different response than what has been previously reported in acute models of ischemia.
Hemangiocytes were first defined by Raffi’s group in a recent publication (13). They demonstrated that the magnitude of cytokine-mediated release of SDF-1 from platelets, and the recruitment of non-endothelial CXCR4+VEGFR+ hemangiopoietic progenitors (“hemangiocytes”), constitutes a major determinant of revascularization. Hemangiocytes also induce neovascularization by releasing angiogenic factors, as well as by physically supporting the assembly of endothelial cells (13, 37). Our study showed that more hemangiocytes were integrated into the endothelial layer, or localized in the wall of small vessels, after acute hindlimb ischemia (Figure 8). However, a similar pattern of hemangiocyte aggregation was notably reduced in our gradual occlusion model. This provides important evidence that hemangiocytes contribute to collateral artery remodeling (enlargement) and the higher levels observed after acute gradual occlusion suggest their recruitment may be proportional to the inflammatory stimulus.
The significant difference in hemangiocyte recruitment in gradual versus acute arterial occlusion may result from the differential expression of SDF-1α. The SDF-1α/CXCR4 axis plays a very important role in the recruitment of smooth muscle progenitor cells (38), normal stem cells, cancer stem cells (39) and the recruitment of hematopoietic cells into skeletal muscle (40). SDF-1α positive cells significantly increased after acute occlusion. In contrast, SDF-1α positive cells were less prevalent after gradual occlusion. CXCR4+/VEGFR1+ hemangiocytes are recruited to the area of ischemic injury by the SDF-1α/CXCR4 axis. These cells can differentiate into endothelial cells or smooth muscle cells essential for collateral arteriogenesis. In gradual occlusion, less hypoxia and minimal muscle necrosis generated lower expression of SDF-1α. This leads to diminished blood flow recovery. For these reasons, the mechanisms mediating blood flow recovery after acute versus gradual occlusion may be distinct.
Our findings have important clinical implications. They suggest that under conditions of gradual arterial occlusion, where pressure gradients across a collateral arterial bed are smaller, shear-stress induced genes like eNOS and egr-1 may not be sufficiently activated to induce collateral artery enlargement. Gradual arterial occlusion leads to a different pattern of blood flow recovery, gene expression, macrophage infiltration, as well as SDF-1α triggered hemangiocyte recruitment. Understanding the mechanisms that determine the extent of collateral artery enlargement after gradual arterial gradual occlusion model may open avenues for new molecular approaches for the enhancement of collateral artery enlargement in humans who suffer from PAD.
Supplementary Material
Table 1.
Primer sequences used in Q-RT-PCR assay
| Genes | Forward primer | Reverse primer |
|---|---|---|
| eNOS | ATCTTCGTTCAGCCATCACA | CCAGCCATGTTGGATACAGAG |
| VEGF | CACGACAGAAGGAGAGCAGA | ACAGGACGGCTTGAAGATG |
| MCP-1 | TTGGCTCAGCCAGATGCAGT | CCAGCCTACTCATTGGGATCAT |
| ICAM | TGTATTCGTTTCCGGAGAGTG | GTGATCTCCTTGGGGTCCTT |
| PDGFB | TTCCAGGAGTGATACCAGCTT | AGGGGGCGTGATGACTAGG |
| VCAM | CATGGAGCCTGTCAGTTTTG | TGGATCCTTGGGGAAAGAG |
| HIF-1 | ACAGAAATGGCCCAGTGAGA | AGTGAAGCACCTTCCACGTT |
| egr-1 | AGCGAACAACCCTATGAGCAC | TAGTTTGGCTGGGATAACTCG |
| NF-Kb | CCAACGCCCTTTTCGACTAC | GATCCCTCACGAGCTGAGC |
| 18s rRNA | CGGCTACCACATCCAAGGAA | GCTGGAATTACCGCGGCT |
Acknowledgments
We thank Robert Raffai, PhD. for critical review of the manuscript.
Grants
Supported by the National Institutes of Health Grant HL75353 (L.M.M.) and Pacific Vascular Research Institute.
Footnotes
Publisher's Disclaimer: This is a PDF file of an unedited manuscript that has been accepted for publication. As a service to our customers we are providing this early version of the manuscript. The manuscript will undergo copyediting, typesetting, and review of the resulting proof before it is published in its final citable form. Please note that during the production process errors may be discovered which could affect the content, and all legal disclaimers that apply to the journal pertain.
References
- 1.Schainfeld RM, Isner JM. Critical limb ischemia: nothing to give at the office? Ann Intern Med. 1999;130:442–444. doi: 10.7326/0003-4819-130-5-199903020-00017. [DOI] [PubMed] [Google Scholar]
- 2.Baffour R, Garb JL, Kaufman J, Berman J, Rhee SW, Norris MA, Friedmann P. Angiogenic therapy for the chronically ischemic lower limb in a rabbit model. J Surg Res. 2000;93:219–229. doi: 10.1006/jsre.2000.5980. [DOI] [PubMed] [Google Scholar]
- 3.Tang GL, Chang DS, Sarkar R, Wang R, Messina LM. The effect of gradual or acute arterial occlusion on skeletal muscle blood flow, arteriogenesis, and inflammation in rat hindlimb ischemia. J Vasc Surg. 2005;41:312–320. doi: 10.1016/j.jvs.2004.11.012. [DOI] [PubMed] [Google Scholar]
- 4.Helisch A, Schaper W. Arteriogenesis: the development and growth of collateral arteries. Microcirculation. 2003;10:83–97. doi: 10.1038/sj.mn.7800173. [DOI] [PubMed] [Google Scholar]
- 5.Schaper W, Scholz D. Factors regulating arteriogenesis. Arterioscler Thromb Vasc Biol. 2003;23:1143–1151. doi: 10.1161/01.ATV.0000069625.11230.96. [DOI] [PubMed] [Google Scholar]
- 6.Scholz D, Ziegelhoeffer T, Helisch A, Wagner S, Friedrich C, Podzuweit T, Schaper W. Contribution of arteriogenesis and angiogenesis to postocclusive hindlimb perfusion in mice. J Mol Cell Cardiol. 2002;34:775–787. doi: 10.1006/jmcc.2002.2013. [DOI] [PubMed] [Google Scholar]
- 7.Cooke JP. Flow, NO, and atherogenesis. Proc Natl Acad Sci U S A. 2003;100:768–770. doi: 10.1073/pnas.0430082100. [DOI] [PMC free article] [PubMed] [Google Scholar]
- 8.Pipp F, Boehm S, Cai WJ, Adili F, Ziegler B, Karanovic G, Ritter R, Balzer J, Scheler C, Schaper W, Schmitz-Rixen T. Elevated fluid shear stress enhances postocclusive collateral artery growth and gene expression in the pig hind limb. Arterioscler Thromb Vasc Biol. 2004;24:1664–1668. doi: 10.1161/01.ATV.0000138028.14390.e4. [DOI] [PubMed] [Google Scholar]
- 9.Topper JN, Gimbrone MA., Jr Blood flow and vascular gene expression: fluid shear stress as a modulator of endothelial phenotype. Mol Med Today. 1999;5:40–46. doi: 10.1016/s1357-4310(98)01372-0. [DOI] [PubMed] [Google Scholar]
- 10.van Royen N, Hoefer I, Buschmann I, Kostin S, Voskuil M, Bode C, Schaper W, Piek JJ. Effects of local MCP-1 protein therapy on the development of the collateral circulation and atherosclerosis in Watanabe hyperlipidemic rabbits. Cardiovasc Res. 2003;57:178–185. doi: 10.1016/s0008-6363(02)00615-6. [DOI] [PubMed] [Google Scholar]
- 11.Voskuil M, van Royen N, Hoefer IE, Seidler R, Guth BD, Bode C, Schaper W, Piek JJ, Buschmann IR. Modulation of collateral artery growth in a porcine hindlimb ligation model using MCP-1. Am J Physiol Heart Circ Physiol. 2003;284:H1422–1428. doi: 10.1152/ajpheart.00506.2002. [DOI] [PubMed] [Google Scholar]
- 12.Kinnaird T, Stabile E, Burnett MS, Lee CW, Barr S, Fuchs S, Epstein SE. Marrow-derived stromal cells express genes encoding a broad spectrum of arteriogenic cytokines and promote in vitro and in vivo arteriogenesis through paracrine mechanisms. Circ Res. 2004;94:678–685. doi: 10.1161/01.RES.0000118601.37875.AC. [DOI] [PubMed] [Google Scholar]
- 13.Jin DK, Shido K, Kopp HG, Petit I, Shmelkov SV, Young LM, Hooper AT, Amano H, Avecilla ST, Heissig B, Hattori K, Zhang F, Hicklin DJ, Wu Y, Zhu Z, Dunn A, Salari H, Werb Z, Hackett NR, Crystal RG, Lyden D, Rafii S. Cytokine-mediated deployment of SDF-1 induces revascularization through recruitment of CXCR4+ hemangiocytes. Nat Med. 2006;12:557–567. doi: 10.1038/nm1400. [DOI] [PMC free article] [PubMed] [Google Scholar]
- 14.Szmitko PE, Fedak PW, Weisel RD, Stewart DJ, Kutryk MJ, Verma S. Endothelial progenitor cells: new hope for a broken heart. Circulation. 2003;107:3093–3100. doi: 10.1161/01.CIR.0000074242.66719.4A. [DOI] [PubMed] [Google Scholar]
- 15.Brevetti LS, Paek R, Brady SE, Hoffman JI, Sarkar R, Messina LM. Exercise-induced hyperemia unmasks regional blood flow deficit in experimental hindlimb ischemia. J Surg Res. 2001;98:21–26. doi: 10.1006/jsre.2001.6161. [DOI] [PubMed] [Google Scholar]
- 16.Deindl E, Boengler K, van Royen N, Schaper W. Differential expression of GAPDH and beta3-actin in growing collateral arteries. Mol Cell Biochem. 2002;236:139–146. doi: 10.1023/a:1016166127465. [DOI] [PubMed] [Google Scholar]
- 17.Jacobi J, Tam BY, Wu G, Hoffman J, Cooke JP, Kuo CJ. Adenoviral gene transfer with soluble vascular endothelial growth factor receptors impairs angiogenesis and perfusion in a murine model of hindlimb ischemia. Circulation. 2004;110:2424–2429. doi: 10.1161/01.CIR.0000145142.85645.EA. [DOI] [PubMed] [Google Scholar]
- 18.Tuomisto TT, Rissanen TT, Vajanto I, Korkeela A, Rutanen J, Yla-Herttuala S. HIF-VEGF-VEGFR-2, TNF-alpha and IGF pathways are upregulated in critical human skeletal muscle ischemia as studied with DNA array. Atherosclerosis. 2004;174:111–120. doi: 10.1016/j.atherosclerosis.2004.01.015. [DOI] [PubMed] [Google Scholar]
- 19.Witt KA, Mark KS, Huber J, Davis TP. Hypoxia-inducible factor and nuclear factor kappa-B activation in blood-brain barrier endothelium under hypoxic/reoxygenation stress. J Neurochem. 2005;92:203–214. doi: 10.1111/j.1471-4159.2004.02871.x. [DOI] [PubMed] [Google Scholar]
- 20.Schalch P, Patejunas G, Retuerto M, Sarateanu S, Milbrandt J, Thakker G, Kim D, Carbray J, Crystal RG, Rosengart TK. Homozygous deletion of early growth response 1 gene and critical limb ischemia after vascular ligation in mice: evidence for a central role in vascular homeostasis. J Thorac Cardiovasc Surg. 2004;128:595–601. doi: 10.1016/j.jtcvs.2004.02.036. [DOI] [PubMed] [Google Scholar]
- 21.Tousoulis D, Davies GJ, Asimakopoulos G, Homaei H, Zouridakis E, Ahmed N, Kaski JC. Vascular cell adhesion molecule-1 and intercellular adhesion molecule-1 serum level in patients with chest pain and normal coronary arteries (syndrome X) Clin Cardiol. 2001;24:301–304. doi: 10.1002/clc.4960240409. [DOI] [PMC free article] [PubMed] [Google Scholar]
- 22.Signorelli SS, Malaponte G, Di Pino L, Digrandi D, Pennisi G, Mazzarino MC. Effects of ischaemic stress on leukocyte activation processes in patients with chronic peripheral occlusive arterial disease: role of L-propionyl carnitine administration. Pharmacol Res. 2001;44:305–309. doi: 10.1006/phrs.2001.0863. [DOI] [PubMed] [Google Scholar]
- 23.Ley K, Gaehtgens P, Fennie C, Singer MS, Lasky LA, Rosen SD. Lectin-like cell adhesion molecule 1 mediates leukocyte rolling in mesenteric venules in vivo. Blood. 1991;77:2553–2555. [PubMed] [Google Scholar]
- 24.Panettieri RA, Jr, Lazaar AL, Pure E, Albelda SM. Activation of cAMP-dependent pathways in human airway smooth muscle cells inhibits TNF-alpha-induced ICAM-1 and VCAM-1 expression and T lymphocyte adhesion. J Immunol. 1995;154:2358–2365. [PubMed] [Google Scholar]
- 25.Bao X, Lu C, Frangos JA. Temporal gradient in shear but not steady shear stress induces PDGF-A and MCP-1 expression in endothelial cells: role of NO, NF kappa B, and egr-1. Arterioscler Thromb Vasc Biol. 1999;19:996–1003. doi: 10.1161/01.atv.19.4.996. [DOI] [PubMed] [Google Scholar]
- 26.Chiu JJ, Wung BS, Hsieh HJ, Lo LW, Wang DL. Nitric oxide regulates shear stress-induced early growth response-1. Expression via the extracellular signal-regulated kinase pathway in endothelial cells. Circ Res. 1999;85:238–246. doi: 10.1161/01.res.85.3.238. [DOI] [PubMed] [Google Scholar]
- 27.Nagel T, Resnick N, Atkinson WJ, Dewey CF, Jr, Gimbrone MA., Jr Shear stress selectively upregulates intercellular adhesion molecule-1 expression in cultured human vascular endothelial cells. J Clin Invest. 1994;94:885–891. doi: 10.1172/JCI117410. [DOI] [PMC free article] [PubMed] [Google Scholar]
- 28.Garcia-Cardena G, Comander J, Anderson KR, Blackman BR, Gimbrone MA., Jr Biomechanical activation of vascular endothelium as a determinant of its functional phenotype. Proc Natl Acad Sci U S A. 2001;98:4478–4485. doi: 10.1073/pnas.071052598. [DOI] [PMC free article] [PubMed] [Google Scholar]
- 29.Kuchan MJ, Jo H, Frangos JA. Role of G proteins in shear stress-mediated nitric oxide production by endothelial cells. Am J Physiol. 1994;267:C753–758. doi: 10.1152/ajpcell.1994.267.3.C753. [DOI] [PubMed] [Google Scholar]
- 30.Tsao PS, Buitrago R, Chan JR, Cooke JP. Fluid flow inhibits endothelial adhesiveness. Nitric oxide and transcriptional regulation of VCAM-1. Circulation. 1996;94:1682–1689. doi: 10.1161/01.cir.94.7.1682. [DOI] [PubMed] [Google Scholar]
- 31.Tsao PS, Lewis NP, Alpert S, Cooke JP. Exposure to shear stress alters endothelial adhesiveness. Role of nitric oxide. Circulation. 1995;92:3513–3519. doi: 10.1161/01.cir.92.12.3513. [DOI] [PubMed] [Google Scholar]
- 32.Uematsu M, Ohara Y, Navas JP, Nishida K, Murphy TJ, Alexander RW, Nerem RM, Harrison DG. Regulation of endothelial cell nitric oxide synthase mRNA expression by shear stress. Am J Physiol. 1995;269:C1371–1378. doi: 10.1152/ajpcell.1995.269.6.C1371. [DOI] [PubMed] [Google Scholar]
- 33.Hoefer IE, van Royen N, Rectenwald JE, Deindl E, Hua J, Jost M, Grundmann S, Voskuil M, Ozaki CK, Piek JJ, Buschmann IR. Arteriogenesis proceeds via ICAM-1/Mac-1- mediated mechanisms. Circ Res. 2004;94:1179–1185. doi: 10.1161/01.RES.0000126922.18222.F0. [DOI] [PubMed] [Google Scholar]
- 34.Palmer-Kazen U, Wariaro D, Luo F, Wahlberg E. Vascular endothelial cell growth factor and fibroblast growth factor 2 expression in patients with critical limb ischemia. J Vasc Surg. 2004;39:621–628. doi: 10.1016/j.jvs.2003.07.006. [DOI] [PubMed] [Google Scholar]
- 35.Werner GS, Jandt E, Krack A, Schwarz G, Mutschke O, Kuethe F, Ferrari M, Figulla HR. Growth factors in the collateral circulation of chronic total coronary occlusions: relation to duration of occlusion and collateral function. Circulation. 2004;110:1940–1945. doi: 10.1161/01.CIR.0000143624.72027.11. [DOI] [PubMed] [Google Scholar]
- 36.Lee CWSE, Kinnaird T, Shou M, Devaney JM, Epstein SE, Burnett MS. Temporal patterns of gene expression after acute hindlimb ischemia in mice: insights into the genomic program for collateral vessel development. J Am Coll Cardiol. 2004;43(3):474–482. doi: 10.1016/j.jacc.2003.09.033. [DOI] [PubMed] [Google Scholar]
- 37.Rafii S, Lyden D. Therapeutic stem and progenitor cell transplantation for organ vascularization and regeneration. Nat Med. 2003;9:702–712. doi: 10.1038/nm0603-702. [DOI] [PubMed] [Google Scholar]
- 38.Zernecke A, Schober A, Bot I, von Hundelshausen P, Liehn EA, Mopps B, Mericskay M, Gierschik P, Biessen EA, Weber C. SDF-1alpha/CXCR4 axis is instrumental in neointimal hyperplasia and recruitment of smooth muscle progenitor cells. Circ Res. 2005;96:784–791. doi: 10.1161/01.RES.0000162100.52009.38. [DOI] [PubMed] [Google Scholar]
- 39.Ratajczak MZ, Zuba-Surma E, Kucia M, Reca R, Wojakowski W, Ratajczak J. The pleiotropic effects of the SDF-1-CXCR4 axis in organogenesis, regeneration and tumorigenesis. Leukemia. 2006;20:1915–1924. doi: 10.1038/sj.leu.2404357. [DOI] [PubMed] [Google Scholar]
- 40.Pituch-Noworolska A, Majka M, Janowska-Wieczorek A, Baj-Krzyworzeka M, Urbanowicz B, Malec E, Ratajczak MZ. Circulating CXCR4-positive stem/progenitor cells compete for SDF-1-positive niches in bone marrow, muscle and neural tissues: an alternative hypothesis to stem cell plasticity. Folia Histochem Cytobiol. 2003;41:13–21. [PubMed] [Google Scholar]
Associated Data
This section collects any data citations, data availability statements, or supplementary materials included in this article.