Abstract
Measuring free-living peoples’ food intake represents methodological and technical challenges. The Remote Food Photography Method (RFPM) involves participants capturing pictures of their food selection and plate waste and sending these pictures to the research center via a wireless network, where they are analyzed by Registered Dietitians to estimate food intake. Initial tests indicate that the RFPM is reliable and valid, though the efficiency of the method is limited due to the reliance on human raters to estimate food intake. Herein, we describe the development of a semiautomated computer imaging application to estimate food intake based on pictures captured by participants.
Index Terms: Food intake, Energy intake, Computer imaging, Digital photography, Remote Food Photography Method (RFPM)
I. Introduction
Obtaining real-time and accurate estimates of food intake while people reside in their natural environment is technically and methodologically challenging. Currently, doubly labeled water is the “gold standard” for measuring food intake in free-living conditions. Doubly labeled water provides a measure of total daily energy expenditure (TEE), and during energy balance (weight maintenance), energy expenditure equals energy (food) intake [1, 2]. If weight is not stable or energy balance is not present during the period of measurement, TEE data are adjusted for change in energy stores [3]. Nevertheless, it is difficult to obtain an accurate estimate of an individual’s food intake using doubly labeled water if the person experiences a large energy deficit during the period of measurement, even if change in energy stores is considered [3]. Consequently, doubly labeled water has limitations when people are dieting, or the times at which clinicians frequently require accurate estimates of food intake. Additional limitations of doubly labeled water include its cost, inability to provide data on the types of foods consumed, and the lack of real-time data.
Most alternative methods to measure food intake rely on participant self-report, including food records, 24-hour recall, and food frequency questionnaires. These methods rely on the participant to recall or record the foods that they eat and estimate or measure the amount (portion) of food eaten. Although these methods are frequently utilized to estimate food intake in research and clinical settings, they underestimate food intake by 37% or more [4–6]. In addition, people who are overweight or obese underreport food intake to a greater degree than lean people when using these methods [6]. The largest source of error in estimating food intake from self-report is attributable to participants’ poor estimation of portion size [7]. Hence, methods that do not rely on the participant to estimate portion size are needed.
The digital photography of foods method [8, 9] was developed to unobtrusively measure food intake in cafeteria settings and it does not rely on the participant to estimate portion size. The digital photography of foods method involves using a digital video camera to capture a photograph of a participant’s food selection before they eat, and plate waste after they finish eating. While in the cafeteria or dining location, photographs are also captured of carefully measured standard portions of the foods served on the day of data collection. At a later date in the laboratory, these photographs are analyzed by registered dietitians (RDs) who estimate the amount (portion) of food selection and plate waste by comparing these photographs to the standard portion photographs. These portion size estimates are entered into a custom built computer application that automatically calculates the grams, kilocalories (kcal), and macro- and micro-nutrients of food selection, plate waste, and food intake based on a United States Department of Agriculture (USDA) database [10]. The digital photography of foods method has been found to be highly reliable and accurate (valid) and overestimates food intake by less than 6 grams on average [9].
The digital photography of foods method represents a novel and valid method for quantifying food intake in cafeteria settings, but it is not appropriate for free-living conditions. The Remote Food Photography Method (RFPM) [11], however, was developed specifically to measure food intake in free-living conditions and it builds upon the digital photography methodology. When using the RFPM, participants are trained to use a camera-equipped cell phone with wireless data transfer capabilities to take pictures of their food selection and plate waste and to send these pictures to the researchers over the wireless network. To reduce the frequency of participants forgetting to take photographs of their foods, they receive and respond to automated prompts reminding them to take photographs and to send the photographs to the researchers. These prompts are consistent with ecological momentary assessment (EMA) [12] methods and consist of emails and text messages. The images are received by the researchers in near real-time and can be analyzed quickly to estimate food intake. When analyzing the images, the RDs rely on methods similar to the digital photography of foods method, but the participants are not required to take a photograph of a standard portion of every food that they eat, as this would be unfeasible. Alternatively, an Archive of over 2,100 standard portion photographs was created. This allows the RDs to match foods that participants eat to a standard portion photograph that already exists. Initial tests supported the reliability and validity of the RFPM [11]. The RFPM underestimated food intake by ~6% and, importantly, the error associated with the method was consistent over different levels of body weight and age.
The purpose of the research reported herein was to develop an automated food intake evaluation system (AFIES) to: 1) identify the foods in pictures of food selection and plate waste, and 2) automatically calculate the amount of food depicted in photographs of food selection and plate waste. Hence, the AFIES would replace the RDs who manually estimate the amount of food selection and plate waste, making the RFPM much more efficient and cost effective, and possibly more accurate.
II. Automated Evaluation of food intake
The automated food intake evaluation system consists of reference card detection, food region segmentation and classification, and food amount estimation modules.
A. Reference Card Detection
In order to estimate food portions accurately in free-living conditions, we need a reference in the pictures to account for the viewpoint and distance of the camera. For this purpose, the subjects are asked to place a reference card next to their food before taking a picture. The reference card is a standard 85.60×53.98mm [ISO/IEC 7813] ID card with a specific pattern printed on top. The pattern consists of two concentric rectangle (bull’s-eye) patterns and a surrounding rectangle, as seen in Fig. 1 and Fig. 2. The bull’s-eye patterns are used to locate the reference card within the picture; and the surrounding rectangle is utilized for determining the four corners of the card.
Fig. 1.
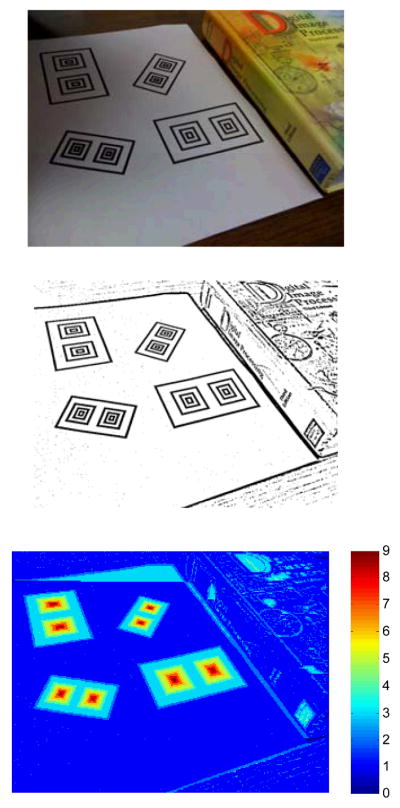
Reference card detection. Top: Input image; Middle: Result of adaptive thresholding; Bottom: Response of the pattern detector.
Fig. 2.
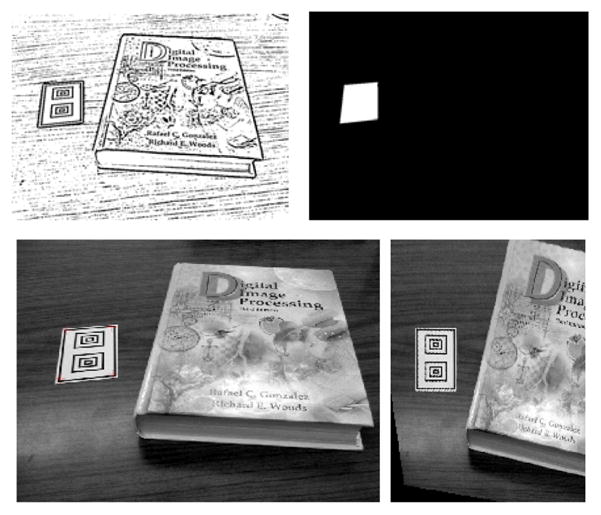
Corner detection and perspective correction. In raster scan order: Binary image after adaptive thresholding; Detected reference card; Corners of the card are marked on the image; Perspective correction of the card.
The first step in reference card detection is to binarize the input image. Since global thresholding is likely to fail in capturing the local structures (therefore, the bull’s-eye pattern), we employ an adaptive thresholding method [13]. We take the difference between the luminance channel of an image and its filtered version (which is obtained using an 11×11 averaging filter), and threshold the difference image to obtain the binary image. The pattern detector starts with the first row of the binary image, runs along the rows, first from left to right and then from right to left, and returns a high value at center locations of alternating color patterns with mirror symmetry. Such bull’s-eye detection is also used in localization of 2D barcodes, such as the MaxiCode [14]. Fig. 1 illustrates that the adaptive thresholding method successfully extracts the local texture even if there is nonuniform illumination, and the reference card detector works well regardless of the orientation or the perspective of the card.
Once the patterns are located, we do a morphological region fill operation on the binary image to determine the exact location of the entire reference card. The seed points of the region fill operation are chosen as the points along the line that connects the centroids of the two peak regions (bull’s eye centers) inside the card; this guarantees filling of the entire card region. This is followed by the Harris corner detector [15] to locate the four corners of the card, which can later be used for perspective correction of the food area estimates. An example is shown in Fig. 2.
B. Food Region Segmentation and Classification
The next step is the segmentation and classification of the food in the picture. This requires extraction of the features for each food type in a training process. During training, a user manually selects the food region for each food type; the features associated with that food type are extracted and saved. (Fig. 3 shows a screenshot of the manual region selection process.) The user is also asked to enter the gram amount (or volume) of the food type; this information is used to establish the association between the food region area and the gram amount for each food type. After completing the process for all food types, a classifier is trained given the features. In our prototype system, we use the color RGB data (red, green, and blue values) as the feature vector for the classifier. In future versions, we will expand the feature space with additional features, such as the Gabor texture features [16], and apply a dimensionality reduction technique, e.g. the Principal Component Analysis (PCA), to obtain the principal components. The distribution of the RGB data in a selected food region is modeled as a Gaussian distribution; the parameters of the Gaussian model, namely, mean and covariance matrix are then computed for that particular food type. (We should also note here that the white regions of the reference card are used to do white balancing, which improves the performance.) During the testing stage, the distance between each pixel to a food class is calculated using the Mahalanobis distance [17], which accounts for the distribution of the feature values. A typical distance image is shown in Fig. 4. The distance calculation process is repeated for all food classes. Pixels that are close to a class (i.e., pixels with Mahalanobis distance less than a pre-determined threshold) are assigned to that class. After repeating for all classes, we have the food regions for each class. In our current system, we restrict one food type per image; therefore, we pick the food class with the largest area. We then do a refinement step, where region growing and morphological denoising (opening and closing) operations are performed to obtain the final food region. Fig. 4 shows a successful segmentation/classification result. For the future versions of our system, we will investigate the use of different classification techniques. Support Vector Machines [18], multilayer neural networks [19], and classifier fusion are among the techniques we are considering. These techniques can be incorporated into the classification module of our system without any special treatment.
Fig. 3.
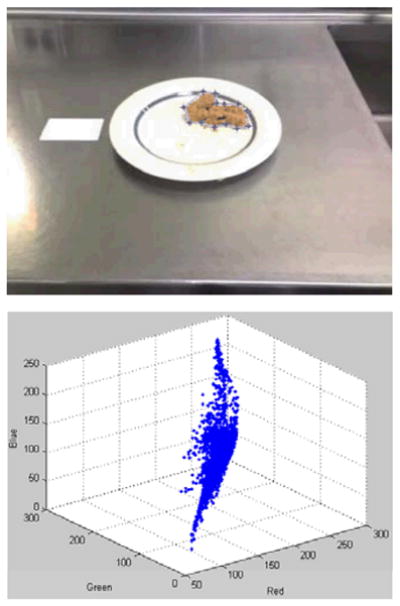
Manual selection of the food region during the training stage. Top: The region of interest is outlined by the blue points that are clicked by the user. Bottom: Distribution of the color samples in RGB space.
Fig. 4.
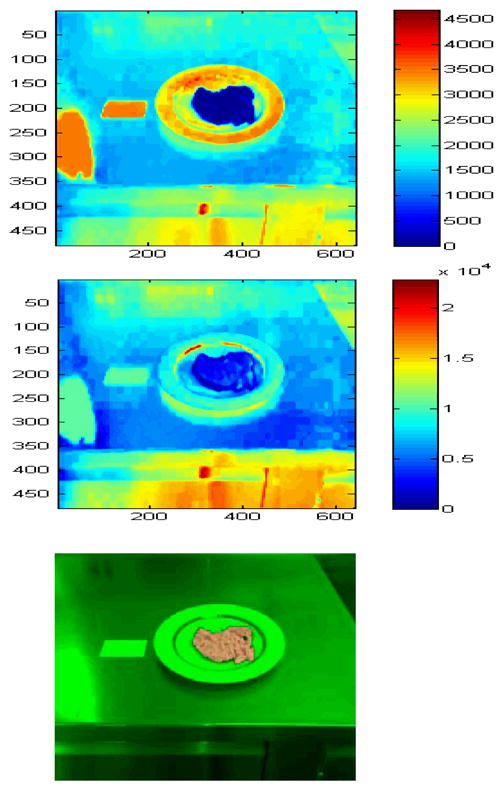
Automatic region segmentation and classification. Top: Mahalanobis distance of pixels to the food class shown in Fig. 3. Middle: Mahalanobis distance of the pixels to another food class. Bottom: Final segmented and classified region.
C. Food Amount Estimation
As described earlier, the real area of the food region is determined using the reference card. Based on the association between the food region area and gram amount (equivalently, volume), the amount of food in the picture is estimated. The formula between the area and the volume depends on the food type and shape of the plate used. For some food, the volume is roughly proportional to the area. On the other hand, for some other foods, such as soup, the shape of the bowl needs to be known to establish the formula between the area and the volume. (See Fig. 5 for an illustration.) In our current system, we assume linear proportionality between the food area and the volume. As a result, we estimate the area (therefore, the volume and gram amount) of the food in before and after pictures, and estimate the amount of food intake. We will add a feature to our system to associate the area-volume formula with the food type so that the volumes are estimated more accurately for food that is put in bowls; the system will assume a standard bowl shape to establish the area-volume formula.
Fig. 5.
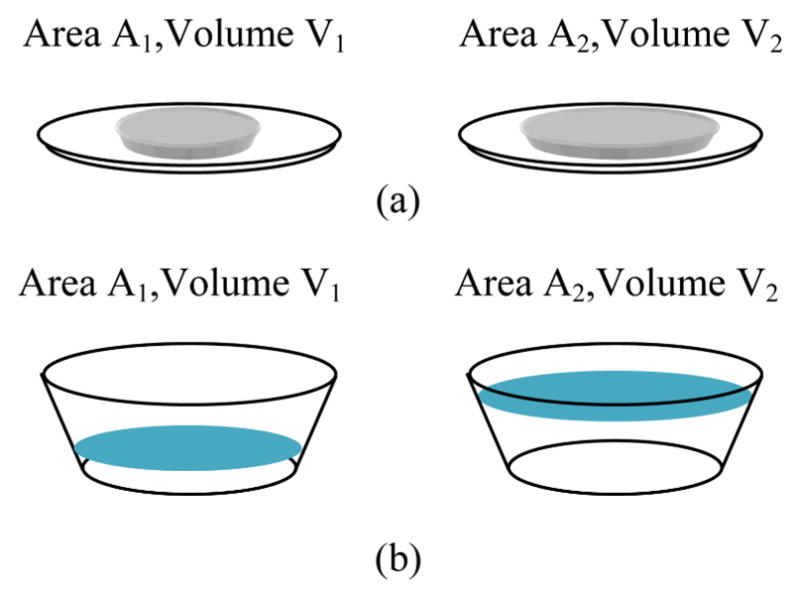
Area-Volume relation. (a) Volume is linearly proportional to the area; that is, V2= A2 (V1/A1). (b) The volume depends on the shape (namely, top and bottom areas and the height) of the bowl, which is modeled as a cut cone.
D. Manual Review
The automated system estimates the food type and gram amount in each image and saves the information. This long process is performed offline. A dietitian then reviews the results and if necessary changes estimated gram amounts manually. This control mechanism guarantees the accuracy of the data to be used in food intake analysis.
III. Conclusions and Future Work
This paper presents a framework to automatically estimate the food intake in free living conditions. We use a reference card system to estimate the true area of the food portions. The system relies on accurate detection of the corners of the reference. In the event of low-resolution images, the corners may not be estimated accurately; in such a case, we may do a template matching to the reference card or fit lines to the edges of rectangles in the card using Hough transform to eventually have a more accurate estimate of the position of the card. Currently, we are using color features in our system; this is obviously not sufficient as different foods may have similar color features. We will add texture features to improve the performance of our system. Another addition to our system will be an advanced classifier instead of the Mahalanobis distance classifier, which is currently employed. We are also planning to include image enhancement modules, such image denoising, compression artifact reduction, and contrast enhancement subsystems, to handle low-quality images. Another future work is to investigate the use of multiple images to construct 3D structures, and to have more accurate estimate of the gram amounts.
Acknowledgments
This work was partially supported by the National Institutes of Health and the National Science Foundation (National Institute of Diabetes and Digestive and Kidney Diseases grant K23 DK068052; National Heart Lung and Blood Institute, National Institute on Aging, and National Science Foundation grant R21 AG032231), and a CNRU Center Grant, 1P30 DK072476, entitled “Nutritional Programming: Environmental and Molecular Interactions” sponsored by the NIDDK. The content is solely the responsibility of the authors and does not necessarily represent the official view of the National Institutes of Health.
Contributor Information
Corby K. Martin, Email: martinck@pbrc.edu, Pennington Biomedical Research Center, Louisiana State University-System, Baton Rouge, LA 70808 USA (phone: 225-763-2585; fax: 225-763-3045;)
Sertan Kaya, Email: skaya1@lsu.edu, Dept. of Electrical and Computer Engineering, Louisiana State University, Baton Rouge, LA 70803 USA (phone: 225-578-5241; fax: 225-578-5200;).
Bahadir K. Gunturk, Email: bahadir@lsu.edu, Dept. of Electrical and Computer Engineering, Louisiana State University, Baton Rouge, LA 70803 USA (phone: 225-578-5241; fax: 225-578-5200;)
References
- 1.Livingstone MB, Black AE. Markers of the validity of reported energy intake. J Nutr. 2003 Mar;133(Suppl 3):895S–920S. doi: 10.1093/jn/133.3.895S. [DOI] [PubMed] [Google Scholar]
- 2.Schoeller DA. How accurate is self-reported dietary energy intake? Nutr Rev. 1990 Oct;48:373–9. doi: 10.1111/j.1753-4887.1990.tb02882.x. [DOI] [PubMed] [Google Scholar]
- 3.de Jonge L, DeLany JP, Nguyen T, Howard J, Hadley EC, Redman LM, Ravussin E. Validation study of energy expenditure and intake during calorie restriction using doubly labeled water and changes in body composition. Am J Clin Nutr. 2007 Jan;85:73–9. doi: 10.1093/ajcn/85.1.73. [DOI] [PMC free article] [PubMed] [Google Scholar]
- 4.Goris AH, Westerterp-Plantenga MS, Westerterp KR. Undereating and underrecording of habitual food intake in obese men: selective underreporting of fat intake. Am J Clin Nutr. 2000 Jan;71:130–4. doi: 10.1093/ajcn/71.1.130. [DOI] [PubMed] [Google Scholar]
- 5.Bandini LG, Schoeller DA, Cyr HN, Dietz WH. Validity of reported energy intake in obese and nonobese adolescents. Am J Clin Nutr. 1990 Sep;52:421–5. doi: 10.1093/ajcn/52.3.421. [DOI] [PubMed] [Google Scholar]
- 6.Schoeller DA, Bandini LG, Dietz WH. Inaccuracies in self-reported intake identified by comparison with the doubly labelled water method. Can J Physiol Pharmacol. 1990 Jul;68:941–9. doi: 10.1139/y90-143. [DOI] [PubMed] [Google Scholar]
- 7.Beasley J, Riley WT, Jean-Mary J. Accuracy of a PDA-based dietary assessment program. Nutrition. 2005 Jun;21:672–7. doi: 10.1016/j.nut.2004.11.006. [DOI] [PubMed] [Google Scholar]
- 8.Williamson DA, Allen HR, Martin PD, Alfonso A, Gerald B, Hunt A. Digital photography: a new method for estimating food intake in cafeteria settings. Eat Weight Disord. 2004 Mar;9:24–8. doi: 10.1007/BF03325041. [DOI] [PubMed] [Google Scholar]
- 9.Williamson DA, Allen HR, Martin PD, Alfonso AJ, Gerald B, Hunt A. Comparison of digital photography to weighed and visual estimation of portion sizes. J Am Diet Assoc. 2003 Sep;103:1139–45. doi: 10.1016/s0002-8223(03)00974-x. [DOI] [PubMed] [Google Scholar]
- 10.USDA. United States Department of Agriculture, Agricultural Research Service, Continuing Survey of Food Intakes by Individuals, 1994–1996, 1998. 2000 [Google Scholar]
- 11.Martin CK, Han H, Coulon SM, Allen HR, Champagne CM, Anton SD. A novel method to remotely measure food intake of free-living people in real-time: The Remote Food Photography Method (RFPM) Br J Nutr. 2009;101:446–456. doi: 10.1017/S0007114508027438. [DOI] [PMC free article] [PubMed] [Google Scholar]
- 12.Stone AA, Shiffman S. Ecological Momentary Assessment (EMA) in behavioral medicine. Ann Behav Med. 1994;16 [Google Scholar]
- 13.Gonzalez RC, Woods RE. Digital Image Processing. Prentice-Hall; 2008. [Google Scholar]
- 14.Chandler DG, Batterman EP, Shah G. Hexagonal, Information Encoding Article, Process and System. 4874936 US Patent No.
- 15.Harris C, Stephens M. A Combined Corner and Edge Detector. Proc. of the 4th Alvey Vision Conf; 1988. pp. 147–151. [Google Scholar]
- 16.Manjunath BS, Ma WY. Texture Features for Browsing and Retrieval of Image Data. IEEE Trans Pattern Analysis and Machine Intelligence. 1996;18:837–842. [Google Scholar]
- 17.Mahalanobis PC. On the Generalised Distance in Statistics. Proc of the National Institute of Sciences of India. 1936;2:49–55. [Google Scholar]
- 18.Scholkopf B, Burges CJC, Smola AJ. Advances in Kernel Methods: Support Vector Learning. Cambridge, MA: MIT Press; 1999. [Google Scholar]
- 19.Bishop CM. Pattern Recognition and Machine Learning. New York: Springer; 2006. [Google Scholar]


