

Abstract
AIMS
Efavirenz exhibits pharmacokinetic variability causing varied clinical response. The aim was to develop an integrated population pharmacokinetic/pharmacogenetic model and investigate the impact of genetic variations, sex, demographic and biochemical variables on single-dose efavirenz pharmacokinetics among Ugandan subjects, using nonmem.
METHODS
Efavirenz plasma concentrations (n= 402) from 121 healthy subjects were quantified by high-performance liquid chromatography. Subjects were genotyped for 30 single nucleotide polymorphisms (SNPs), of which six were novel SNPs in CYP2B6, CYP3A5 and ABCB1. The efavirenz pharmacokinetics was described by a two-compartment model with zero- followed by first-order absorption.
RESULTS
Apparent oral clearance (95% confidence interval) was 4 l h l−1 (3.5, 4.5) in extensive metabolizers. In the final model, incorporating multiple covariates, statistical significance was found only for CYP2B6*6 and CYP2B6*11 on apparent oral clearance as well as ABCB1 (rs3842) on the relative bioavailability. Subjects homozygous for CYP2B6*6 (G516T, A785G) and *11 displayed 21 and 20% lower apparent oral clearance, respectively. Efavirenz relative bioavailability was 26% higher in subjects homozygous for ABCB1 (rs3842). The apparent peripheral volume of distribution was twofold higher in women compared with men.
CONCLUSIONS
The model identified the four factors CYP2B6*6, CYP2B6*11, a novel variant allele in ABCB1 (rs3842) and sex as major predictors of efavirenz plasma exposure in a healthy Ugandan population after single-dose administration. Use of mixed-effects modelling allowed the analysis and integration of multiple pharmacogenetic and demographic covariates in a pharmacokinetic population model.
Keywords: ABCB1, CYP2B6, CYP3A5, efavirenz, population pharmacokinetics, Ugandans
WHAT IS ALREADY KNOWN ABOUT THIS SUBJECT
Efavirenz is metabolized by highly polymorphic enzymes, CYP2B6 and CYP3A. The effect of the different variant alleles on efavirenz population pharmacokinetics has not yet been fully explored.
CYP2B6*6 influences efavirenz steady-state pharmacokinetics. Together with sex it explains 11% of the between-subject variability in apparent oral clearance, but predictions could potentially be improved if additional alleles causing reduced drug metabolism were identified.
ABCB1 (3435C→T) may have effect on efavirenz single-dose and steady-state pharmacokinetics.
WHAT THIS STUDY ADDS
A new polymorphism in ABCB1 gene (rs3842) and CYP2B6*11 in addition to sex and CYP2B6*6 genotype predict efavirenz single-dose pharmacokinetics.
A combined population pharmacogenetic/pharmacokinetic modelling approach allows determination and simulation of determinant factors for efavirenz single-dose pharmacokinetics based on data on gender, biochemical variables and genetic factors in relevant genes (a total of 30 SNPs in CYP2B6, ABCB1 and CYP3A4 genes) in Ugandan population.
Introduction
Efavirenz, a potent antiretroviral agent, is the cornerstone of highly active antiretroviral therapy (HAART), particularly in human immunodeficiency virus (HIV) and tuberculosis co-infected patients being co-treated with rifampicin. Its essential role as an affordable HAART treatment in resource-poor countries is due to its relatively low cost, manageable pill burden and solid efficacy as well as safety documentation [1, 2].
Efavirenz is primarily metabolized by the polymorphic enzyme CYP2B6 with minor involvement of CYP3A4/3A5 [3]. Efavirenz displays substantial interindividual and ethnic variations in its metabolism, mainly due to genetic polymorphisms in CYP2B6 and CYP3A4 enzymes and autoinduction [4]. Sex and ethnicity have been reported as major factors for between-subject variability of efavirenz pharmacokinetics [5, 6], even though the effect of sex is divergent between studies [7, 8]. All these factors cause variable treatment responses between subjects [9–11]. Many studies have reported higher plasma exposure and early side-effects with the homozygous variant of the hepatic CYP2B6*6[7, 12, 13], but no effect of CYP2B6*6 polymorphism on clinical treatment outcomes has been demonstrated [13, 14]. However, the effect of low plasma concentrations of efavirenz on emergence of drug resistance has not been reported. Some studies have highlighted the possible association between low efavirenz plasma exposure and the increased risk of poor virological response [9, 11, 15], and high exposure with toxicity, mostly affecting the central nervous system [15, 16]. A plasma therapeutic range of 1.0–4.0 mg l−1 has been recommended [10, 15, 16].
Both CYP3A4 and CYP3A5 share substrates and their individual role in efavirenz metabolism is not clearly defined. Although there is no genetic variation in CYP3A4 that unequivocally explains variation in enzyme activity, CYP3A5 may contribute to efavirenz pharmacokinetic variability. CYP3A5 is mainly expressed in Africans with several known defective variant alleles [17].
There are conflicting suggestions on whether efavirenz is a substrate for P-glycoprotein that is coded by ABCB1 [6, 18, 19]. The role of ABCB1 genetic variation in efavirenz plasma exposure and treatment outcomes is not defined [6, 13, 20–22]. Favourable virological response with ABCB13435 C→T has been reported [13] but no systematic study has monitored the role of other single nucleotide polymorphisms (SNPs) in the ABCB1 gene for treatment outcome.
The population approach is the method of choice to estimate typical pharmacokinetic parameter values (fixed effects) in a given population, and the associated variability (random effects) [23]. Recently a significant effect of CYP2B6*6 on efavirenz population pharmacokinetics [12] was reported, but 76% of the between-subject variability remained unexplained. Several previous studies have investigated effects of one or a few SNPs in single gene on plasma efavirenz levels in individual subjects. CYP2B6, CYP3A5 and ABCB1 are highly polymorphic in Black populations. The effect of several of the variant alleles on efavirenz pharmacokinetics remains to be investigated. It is our understanding that the combined effects of multiple pharmacogenetic and biological factors in predicting efavirenz population pharmacokinetics are yet to be explored. Population-based predictions could be more applicable if such studies allow inclusion of multiple additional null alleles in relevant genes.
Efavirenz will continue to be a key drug to treat HIV/AIDS in Sub-Saharan Africa and needs to be studied defining predictors for plasma drug exposure, toxicity and treatment outcome based on complete monitoring of a multitude of variant alleles/SNPs of the polymorphic enzymes CYP2B6, CYP3A5 and ABCB1. Therefore we studied the impact of genetic variations for a total of 30 alleles in CYP2B6, CYP3A5 and ABCB1, of which six were novel SNPs, as well as sex, demographic and biochemical variables on a single-dose efavirenz with an integrated population pharmacokinetic/pharmacogenetic modelling and simulation approach.
Materials and methods
Study subjects
Adult healthy volunteers (n= 121) were recruited. Clinical examination combined with HIV and hepatitis B serology, liver and renal function tests were performed to establish that the participants were healthy. Participants were advised to abstain from medications including herbal preparations a week before and throughout the study period. The study was performed according to the Helsinki Declaration of 2000. All participants gave written informed consent. Ethical approval was obtained from the Uganda National Council of Science and Technology.
Efavirenz treatment and sampling
The participants received a single oral dose of 600 mg efavirenz (Stocrin; Merck, Sharpe & Dohme, Whitehouse Station, NJ, USA) after collection of a blood sample for genotyping. From 32 of the participants, blood samples (8 ml) were intensively collected at 0, 1, 2, 4, 8, 24, 48 and 72 h after a single dose intake. In an additional 89 participants, samples were collected at 4 and 24 h.
High-performance liquid chromatography analysis
Plasma was prepared from blood samples by centrifugation at 3000 g for 10 min and stored at −70°C until high-performance liquid chromatography (HPLC) analysis was performed at the Department of Laboratory Medicine, Karolinska University Hospital at Huddinge (Karolinska Institutet, Stockholm, Sweden).
Plasma efavirenz was determined by reverse-phase HPLC with ultraviolet (UV) detection. The HPLC machine, Agilent series 1100, consisting of column compartment G1316A, Degasser G132A, Quat pump G1311A, and an auto-sampler ALS, G1329A, and G1315B diode array detector was used. The column used was Ace3C18, 3 µm 50 × 30 mm (Advanced Chromatography Technologies, Aberdeen, UK). The mobile phase consisted of 30% acetonitrile, 30% methanol, 4 mmol l−1 potassium hydroxide and 10 mmol l−1 acetic acid (pH 4.3).
Plasma proteins were precipitated with acetonitrile before centrifuging. Supernatant (6 µl) was injected and eluted at 0.80 ml min−1 for 3.5 min. The retention time for efavirenz was 2.42 min as detected at UV-VIS 1, 210 nm, UV-VIS 2, 220 nm. This method was linear, with a within-day coefficient of variation of 3.2, 3.3 and 5.1% at concentrations of 2.0 µM (n= 17), 8.0 µM (n= 17), and 20 µM (n= 16), respectively, and a between-day coefficient of variation of 4.1% (n= 50). The limit of quantification for the method was set at 0.35 µM.
Genotyping by minisequencing using microarrays
Genomic DNA was isolated using QIAgen kit. Genotyping for SNPs, other than for C3435T, C1236T and G(A)2677T, was performed by minisequencing using micro-tag arrays method [24].
Cyclic minisequencing reactions with fluorescently labelled dideoxynucleotides were performed using multiplex polymerase chain reaction (PCR) product as template and detection primers, designed to anneal immediately adjacent to and upstream of the SNP site. Primer sequences are available upon request. The microarrays were prepared using detection primers carrying unique 5′ tag sequences and oligonucleotides complementary to the tag sequence of the minisequencing primers, immobilized on a microarray. Hybridization was performed as described previously [24, 25]. The QuantArray file was exported and analysed using the SNPSnapper analysis software, version 4.0 beta.
PCR-restriction fragment length polymorphism method
Genotyping for C3435T, C1236T and G(A)2677T in ABCB1 was performed by PCR-restriction fragment length polymorphism (RFLP) method as described previously [26, 27]. PCRs were performed in a reaction mixture (25 µl) containing buffer ×10, 0.125 µl Smart Taq hot DNA polymerase, 1.6–2.0 µl MgCl2 (25 mM l−1), 6.25 mM dNTPs, and primers. Endonucleases Bsp1431, Eco01091 (Drall) and BshNi(HgiCl) were used to digest PCR products for C3435T, C1236T and G(A)2677T, respectively, followed by gel electrophoresis.
Population pharmacokinetic data processing
Data were analysed using the first-order conditional estimation method in nonmem VI [28]. Resulting models and model output were managed using the Census software [29]. S-plus v. 7.0 (Insightful, Seattle, WA, USA) and Xpose (v. 3.1 and 4.0) [30] were used for exploratory data analysis and generation of diagnostic plots. Several structural pharmacokinetic models including one- or two-compartment models, with or without absorption lag time, were tested during model development. First- or zero-order absorption and mixed first- and zero-order absorption models were investigated to account for the atypical efavirenz absorption profile. The structural model was parameterized in terms of apparent oral clearance (CL/F), apparent central and peripheral oral volumes of distribution (Vc/F and Vp/F), apparent intercompartmental clearance (Q/F), first-order absorption rate constant (ka), duration of zero-order input (D) and lag times for first- and zero-order absorption (ALAG). Efavirenz plasma concentration was not normally distributed as tested by Kolmogorov–Smirnov test (K-S; d= 0.12047, P < 0.10) and Shapiro-Wilk test (W= 0.96027, P= 0.0028). Between-subject variability was introduced by exponential models, assuming log-normal distribution, for all pharmacokinetic parameters. An intercept-slope residual error model was used to account for within-subject variability, experimental errors and model misspecification.
Covariate model
Covariate relationships were assessed graphically by plotting the unexplained between-subject parameter variability vs. the covariates. In extension, automatic covariate screening was conducted using generalized additive modelling (GAM) and the bootstrap of the GAM option as implemented in Xpose. Potentially important covariates were selected for manual testing in nonmem.
First the pharmacokinetic covariate model was developed with demographic variables (sex, age, body weight) and biochemical variables [albumin, alanine aminotransferase (ALT), urea and serum creatinine]. Finally, covariates expressing genetic polymorphisms were added to the pharmacokinetic/pharmacogenetic model one by one. In this exploratory analysis, to be included in the model a covariate had to produce a drop in the objective function value (OFV) at the P < 0.05 level corresponding to 3.84 units (for one degree of freedom). In the following step, each selected covariate was entered in a full model. All retained covariates were eventually removed from the full model by stepwise backward elimination, using a more stringent criterion of P < 0.01 (corresponding to a drop of 6.63 in the OFV) in order to correct for multiple testing. Furthermore, to be selected as clinically relevant, a change in the typical pharmacokinetic parameter estimate of ≥20% was required upon covariate inclusion in combination with a reduction of the unexplained between-subject variability. The 95% confidence interval (CI) of the covariate effect was required to exclude zero.
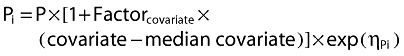
Categorical covariates (sex, genotype groups) were handled by indicator variables. The effects of the female sex and genetic polymorphisms were described by factors expressing the fractional difference from the typical wild-type genotype (Factorgenotype) or male subject (Factorsex), respectively:
 |
(1) |
Where Pi is the individual estimate of the parameter, P is the parameter estimate for a typical wild-type metabolizing male, and the randomly distributed unexplained between-subject variability is denoted by ηPi (mean zero, variance ω2).
Continuous covariates (age, body weight, albumin, ALT, urea and serum creatinine) were centred at the median covariate value:
 |
(2) |
For pharmacogenetic covariates with few homozygous or heterozygous mutant subjects, carriers of the least frequent genotype were pooled together with subjects in one of the adjacent genotype categories. Missing covariate values were replaced by the median or by the value of the most prevalent genotype. In the absence of intravenously administered drug the absolute bioavailability could not be determined. However, the relative efavirenz bioavailability (Frel) was estimated for mutant subjects, while Frel was set to one for wild-type genotypes. Genetic polymorphisms were assumed to affect either CL/F and/or Frel.
Model evaluation
Model discrimination was achieved by assessing the models for goodness of fit, parameter precision and through the use of the log-likelihood ratio test. Furthermore, the final model was evaluated by a predictive check. The model was used for simulating 100 new virtual replicates of the actual clinical study. The median simulated plasma concentration and the 95% prediction interval were plotted and compared with the observed data.
Results
The final dataset comprised 402 concentration observations from 121 participants, 57% of whom were female. Mean age and body weight were 26.5 years (SD 8.2) and 57.5 kg (±5.9), respectively. Participants' mean blood albumin, ALT, urea and creatinine levels were 41.0 g l−1 (SD 8.9), 10.8 U l−1 (SD 9.7), 4.14 mmol l−1 (SD 9.0) and 108.4 µmol (SD 37.4), respectively.
CYP2B6, CYP3A5 and ABCB1 genotype
To choose relevant SNPs for CYP2B6, CYP3A5 and ABCB1 genotyping, we considered more than 50 SNPs from public databases (CYP alleles: http://www.cypalleles.ki.se; dbSNP: http://www.ncbi.nlm.nih.gov/SNP/). Finally, 30 SNPs were selected based on previous identified or presumed reports on functionality. Six previously uncharacterized new SNPs with potential functionality as predicated by bioinformatics tools were also selected (Table 1). Mini-sequencing on tag-microarray method was designed for simultaneous genotyping of several SNPs using gene-specific primers. All subjects were genotyped for 10 SNPs in CYP2B6, seven SNPs in CYP3A5 and 13 SNPs in ABCB1. Observed SNP frequency is indicated in Table 1. There was no significant difference between the observed and expected genotype frequency according to Hardy–Weinberg law.
Table 1.
A total of 30 single nucleotide polymorphisms (SNPs) from CYP2B6, CYP3A5 and ABCB1 genes investigated in 121 healthy Ugandans; their respective rs number, position in cDNA or genomic DNA, reported or predicted functional consequences and the respective observed SNP frequencies are reported
| Gene | Position* | rs number | Allele | Protein | Relevance | Observed SNP frequency (%) |
|---|---|---|---|---|---|---|
| CYP2B6 | ||||||
| c. 785 A→G | rs2279343 | CYP2B6*4, *6, *7, *13, *16 *19, *20 | K262R | Reduced expression and activity | 36.4 | |
| c.516 G→T | rs3745274 | CYP2B6*6, *7, *9, *13, *19, *20 | Q172H | Reduced expression and activity | 35.6 | |
| c.136A→G | rs35303484 | CYP2B6*11 | M46V | Phenotypic null allele | 13.6 | |
| c.983 T→C | rs28399499 | CYP2B6*16, *18 | I328T | Phenotypic null allele | 10.4 | |
| c.64 C→T | rs8192709 | CYP2B6*2 | R22C | Phenotypic null allele | 8.0 | |
| c.1282 C→T | rs35010098 | CYP2B6*21 | P428T | Phenotypic null allele | 1.1 | |
| exon 8/−6 C→T | rs35449271 | New SNP | Undetermined | 32.0 | ||
| 296 G→A | rs36060847 | CYP2B6*12 | G99E | Reduced expression | 3.6 | |
| 1375 A→G | rs3211369 | CYP2B6*23 | M459V | Unknown | 24.0 | |
| c.1172 T→A | rs35979566 | CYP2B6*15 | I391N | Reduced expression | 7.7 | |
| CYP3A5 | ||||||
| g.27289C→A | rs28365083 | CYP3A5*2 | T398N | Unknown | 0 | |
| g.6986A→G | rs776746 | CYP3A5*3 | Splicing defect | Phenotypic null allele | 18.2 | |
| g.14665A→G | CYP3A5*4 | Q200R | Unknown | 8.6 | ||
| g.14690G→A | CYP3A5*6 | Splicing defect | Phenotypic null allele | 17.2 | ||
| g.27131-27132insT | rs241303343 | CYP3A5*7 | 346 frame shift | Phenotypic null allele | 18.4 | |
| g.3699C→T | rs28371764 | CYP3A5*8 | R28C | Phenotypic null allele | 0 | |
| g.19386G→A | rs28383479 | CYP3A5*9 | A337T | Decreased activity | 11.4 | |
| ABCB1 | ||||||
| c.1236 C→T | rs1128503 | Gly412Gly | Phenotypic null allele | 11.9 | ||
| c.2677 G/A→T | rs2032582 | Ala/Thr893 Ser | Phenotypic null allele | 3.7 | ||
| c.3435 T/C | rs1045642 | Ile1145Ile | Phenotypic null allele | 4.8 | ||
| c.4036 A/G | rs3842 | New SNP | 3′ UTR | Undetermined | 16.8 | |
| c.1659 G→C | rs2235012 | Leu554Leu | 1.1 | |||
| exon 6/+139 C→T | rs1202168 | New SNP | – | Undetermined | 18.6 | |
| exon 19/−88 T→C | rs4728699 | New SNP | – | Undetermined | 7.7 | |
| c.781A→G | rs36008564 | Ile261Val | 6.9 | |||
| c.239C→A | rs9282565 | Ala80Glu | 2.8 | |||
| exon 12/+44 C→T | rs20328588 | New SNP | Intron 13 | Undetermined | 5.1 | |
| c.1199G→A | rs2229109 | Ser400Asn | 2.6 | |||
| c.1795C→T | rs2235036 | Ala599Thr | 7.0 | |||
| exon 20/+24 G→A | rs2235040 | New SNP | – | Undetermined | 4.6 | |
Position based on cDNA numbering (c.), genomic DNA (g.), or by exon with the translation site corresponding to A of ATG (CYP allele nomenclature website at http://www.imm.ki.se/cypalleles). Source for ABCB1 cDNA numbering: ABCB1-001 (Vega transcript); OTTHUMG00000023393.
Haplotype analysis using Arlequin population genetics software version 3.1 indicated no significant linkage disequilibrium between the 13 SNPs in the ABCB1 gene and among the seven SNPs in the CYP3A5 gene. In the CYP2B6 gene, the 785 A→G and 516 G→T SNPs were in complete linkage disequilibrium comprising the CYP2B6*6 haplotype. Therefore, in the pharmacokinetic/pharmacogenetic modelling, all individual SNPs in the ABCB1, CYP3A5 and CYP2B6 including the CYP2B6*6 haplotypes were included.
Pharmacokinetic modelling
A two-compartment pharmacokinetic model with zero-order input to the dose compartment followed by sequential first-order absorption to the central compartment was selected as an appropriate pharmacokinetic structural model. A greater apparent peripheral volume of distribution in women than in men was the only convincing explanatory covariate relationship suggested by both the GAM and plots of unexplained between-subject variability in parameter estimates vs. the covariates.
The effects and statistical importance of covariates expressing pharmacogenetic polymorphism identified in the Ugandan population on pharmacokinetic parameter estimates are depicted in Table 2. Upon stepwise univariate inclusion of pharmacogenetic covariates in the model, several SNPs were found to have statistically significant effects on CL/F and Frel. However, after the backward elimination step, the final pharmacokinetic/pharmacogenetic model included polymorphic effects of CYP2B6 (*6 and *11) on CL/F and of ABCB1 (rs 3842) on Frel. Further elimination of these covariates gave an increase in the OFV, approximately equal to −2 × log likelihood of the data, by 6.7, 7.3 and 20.4 units, respectively. Omitting the covariate effects of sex on Vp/F gave an increase in the OFV of approximately 62 units.
Table 2.
Univariate stepwise inclusion of pharmacogenetic covariates on efavirenz CL/F or Frel in the pharmacokinetic model
| Variable | OFV (CL/F) | P-value | OFV (Frel) | P-value |
|---|---|---|---|---|
| Pharmacokinetic model | 471.5 | – | 471.5 | – |
| CYP3A5*3 | 469.4 | NS | 462.1 | <0.01 |
| CYP3A5*4 | 469.2 | NS | 467.0 | <0.05 |
| CYP3A5*6 | 469.4 | NS | 469.0 | NS |
| CYP3A5*7 | 470.3 | NS | 467.0 | <0.05 |
| CYP3A5*9 | 469.4 | NS | 463.1 | <0.01 |
| CYP2B6*2 | 470.0 | NS | 460.8 | NS |
| CYP2B6*11 | 467.0 | <0.05 | 471.4 | NS |
| CYP2B6*21 | 470.0 | NS | 468.6 | NS |
| CYP2B6*15 | 471.2 | NS | 470.0 | NS |
| CYP2B6*18 | 471.4 | NS | 468.9 | NS |
| CYP2B6(516G→T) | 466.3 | <0.05 | 459.7 | <0.01 |
| CYP2B6(785A→G) | 466.5 | <0.05 | 458.1 | <0.01 |
| ABCB1 (rs1202168) | 470.5 | NS | 468.8 | NS |
| ABCB1 (rs478699) | 469.6 | NS | 464.4 | <0.05 |
| ABCB1(rs36008564) | 471.5 | NS | 467.3 | <0.05 |
| ABCB1(rs92822565) | 471.3 | NS | 470.1 | NS |
| ABCB1(rs2035282) | 463 | <0.05 | 469.9 | NS |
| ABCB1(rs3842) | 469.2 | NS | 463.3 | <0.01 |
| ABCB1(rs20328588) | 469.36 | NS | 458.0 | <0.01 |
| ABCB1(rs2235036) | 468.9 | NS | 459.2 | <0.01 |
| ABCB1(3435 C→T) | 466.5 | <0.05 | 469.3 | NS |
| ABCB1(1236 C→T) | 471.3 | NS | 469.7 | NS |
OFV, objective function value. P-value obtained through the use of the log-likelihood test ratio where a difference of 3.84 corresponds to a P-value of 0.05.
Homozygous CYP2B*6 (G516T, A785G) and CYP2B6*11 poor metabolizers were observed to have 21 and 20% lower mean apparent clearance than extensive efavirenz metabolizers, respectively. Efavirenz relative bioavailability was on average estimated to be 26% higher in mutant homozygous and heterozygous for ABCB1 (rs3842) polymorphism compared with the wild-type genotype, affecting the extent but not the rate or duration of absorption (Table 3). Inclusion of sex as a covariate reduced unexplained between-subject variability from 44.7 to 27.9% in the apparent peripheral volume of distribution, which was twofold higher in women compared with men. The between-subject variability in CL/F was reduced from 20.7 to 14.0%, while the variability in Frel was reduced from 20.1 to 18.8 after inclusion of the pharmacogenetic model components. In the final model the additive part of the combined residual error model was insignificantly small. Parameter estimates for the final pharmacokinetic/pharmacogenetic model are listed in Table 3. A predictive check and basic goodness of fit for the final model are seen in Figures 1 and 2, respectively.
Table 3.
Final parameter estimates for the final pharmacokinetic/pharmacogenetic efavirenz model based on data from 121 healthy Ugandan volunteers
| Parameter | Mean (95% CI) |
|---|---|
| CL/F (l h−1) | 4.00 (3.47, 4.53) |
| Effect of CYP2B6*6 | −0.209 (−0.386, −0.032) |
| Effect of CYP2B6*11 | −0.199 (−0.329, −0.0691) |
| Vc/F (l) | 19.1 (7.46, 30.7) |
| Vp/F (l) | 155 (131, 179) |
| Effect of sex | 2.08 (1.64, 2.52) |
| Q/F (l h−1) | 13.7 (6.1, 21.3) |
| ka (h−1) | 0.146 (0.0558, 0.236) |
| D (h) | 1.07 (0.758, 1.38) |
| Frel | 1 FIX |
| Effect of ABCB1 (rs 3842) | 0.257 (0.0873, 0.427) |
| σprop (CV%) | 13.9 (9.62, 17.1) |
| ωCL (CV%) | 14.0 (2.8, 25.2) |
| ωVc (CV%) | 99.5 (49.4, 132) |
| ωVp (CV%) | 27.9 (14.8, 36.7) |
| ωQ (CV%) | 32.1 (20.5, 40.5) |
| ωka (CV%) | 19.7 (8.6, 30.8) |
| ωD1 (CV%) | 69.7 (15.3, 97.4) |
| ωFrel (CV%) | 18.8 (11.9, 23.9) |
CL/F, apparent oral clearance in extensive metabolizers; Vc/F, apparent volume of distribution of the central compartment; Vp/F, apparent volume of distribution of the peripheral compartment; Effect of CYP2B6*6 and *11, fractional decrease in CL/F for poor metabolizers; Effectsex, fraction expressing peripheral volume of distribution in women relative to peripheral volume in men; Effect of ABCB1, fractional increase in Frel for mutant subjects; ka, absorption rate constant; Q/F, intercompartmental clearance; Frel, relative oral bioavailability; D, duration of zero-order absorption; ω, between-subject variability; σprop, random residual error; CI, confidence interval; CV%, coefficient of variation.
Figure 1.
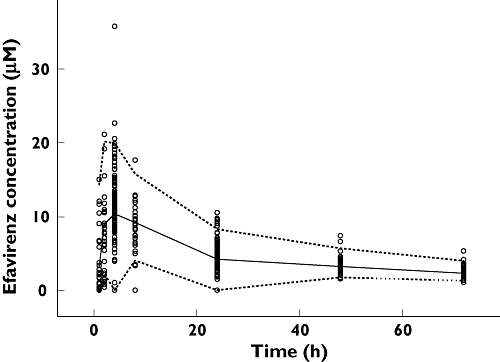
Predictive check of the final efavirenz pharmacokinetic/pharmacogenetic model based on data from 121 healthy Ugandans. The circles are the observed plasma concentrations. The dashed lines constitute a 95% prediction interval and the solid line is the median predicted efavirenz concentrations
Figure 2.
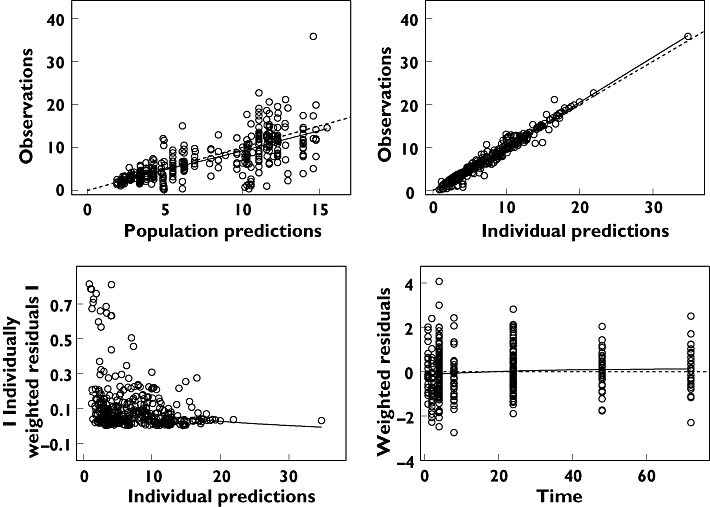
Basic goodness of fit of the final efavirenz model after a single dose in 121 healthy Ugandans. The predictions should match the observations. Residuals should be distributed evenly around the reference line over time and should not give a pronounced slope over the predicted time range. Upper left panel: the observations are plotted vs. the population predictions. Upper right panel: the observations are plotted against the individual predictions. Lower left panel: the absolute values of the individually weighted residuals are seen vs. the individual predictions. Lower right panel: the individually weighted residuals are plotted vs. time after dose. The dashed lines are the lines of identity or the zero reference lines, respectively. The solid line is a smooth nonparametric regression line
Simulated concentration–time courses after a single dose of efavirenz administered to typical male and female homozygous mutant CYP2B6*6, CYP2B6*11 and ABCB1 subjects and to typical subjects with wild-type genotypes are depicted in Figure 3. As indicated, the predicted terminal half-life was 1.5-fold higher in homozygous mutant compared with wild-type subjects in both men and women separately. Combining the effect of sex and genotype, the predicted terminal half-life in typical female homozygous mutants (108.9 h) was threefold higher than for the typical wild-type men (37.3 h) and twofold higher than for the typical homozygous mutant man (54.7 h).The simulations using a single 600-mg efavirenz dose in Figure 3 show that typical female and male homozygous mutant individuals had an AUC equivalent to 943 µM h−1, whereas typical female and male homozygous wild-type individuals had a surprisingly low AUC of 475 µM h−1, independently of sex.
Figure 3.
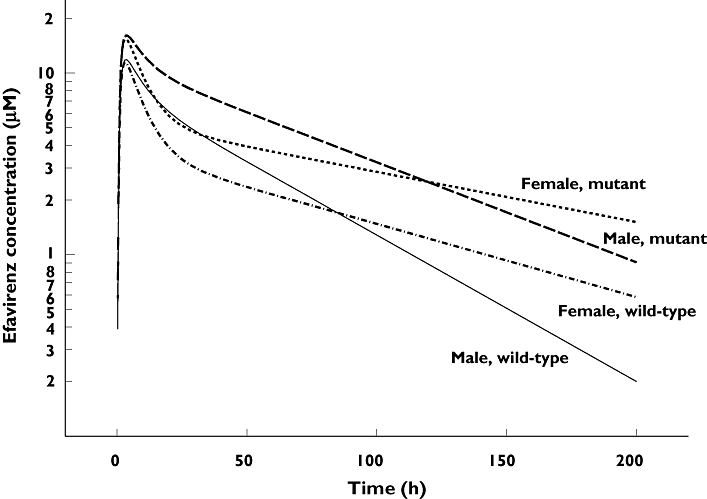
The simulated concentrations time-course after a single dose of 600 mg efavirenz in four typical subjects, based on the final efavirenz pharmacogenetic/pharmacokinetic model. Wild-type: CYP2B6516G/G, CYP2B6*11G/G and ABCB1 rs3842A/A (19.0%). Homozygous mutant: CYP2B6516T/T, CYP2B6*11T/T and ABCB1 rs3842 G/G (2.7%)
Discussion
The present study investigated the comprehensive effects of genetic variations in efavirenz-metabolizing enzymes and transporters, sex, demographic and biochemical variables on the efavirenz population pharmacokinetics. To our knowledge this is the first study to examine extensively the combined effects of several previously identified functional SNPs and new variant alleles in CYP2B6, CYP3A5 and ABCB1 genes (in total, 30) on efavirenz plasma exposure using population pharmacokinetic/pharmacogenetic modelling and simulation. The model identified the four factors CYP2B6*6, CYP2B6*11, a novel variant allele in ABCB1 and sex as major predictors of efavirenz plasma exposure in the Ugandan population.
Efavirenz was found to have an atypical absorption profile, modelled as a mixture of zero- and first-order sequential absorption, which possibly can be interpreted as a result of dissolution rate limited absorption [31]. The pharmacokinetic/pharmacogenetic model predicted combined effects of sex and genetic variations on efavirenz pharmacokinetic parameters. Compared with men, female subjects displayed a twofold larger apparent peripheral volume of distribution. This could be due to higher body fat content in women, where efavirenz, being a low water-soluble drug, is distributed in larger volume, or due to gender differences in plasma protein binding [32]. However, albumin was not identified to be an important covariate in the present analysis.
During stepwise univariate inclusion of pharmacogenetic covariates to the model, several SNPs were found to have statistically significant effects on CL/F and Frel. However, in the final model, incorporating multiple covariates, statistical significance and clinical relevance were found only for CYP2B6*6 and CYP2B6*11 on apparent oral clearance as well as ABCB1 (rs3842) on the relative bioavailability. These covariates in combination not only reduced the OFV in nonmem, but also reduced some of the unexplained between-subject variability, and the 95% CIs of covariate effects did not include zero. Possibly, as indicated by Table 2, other or additional polymorphisms can be of equal importance, but this could not be demonstrated based on the data at hand. In order to determine the role of a specific polymorphism on the pharmacokinetics of a drug one has to know that it affects drug metabolic capacity but also that it is studied with power to detect an influence if the frequency of the specific polymorphism is low. It is also important to account for interaction between pharmacogenetic covariates, but the identification of true covariate combinations may fail during the analysis. In order to allow for such combinations we used an approach where the impact of specific genetic polymorphisms initially was investigated one by one, followed by the incorporation of all potentially interesting covariates in a full model.
The apparent oral single dose clearance of efavirenz in carriers of the wild-type genotypes was in agreement with that observed in a meta-analysis from 16 Phase I studies [33]. Nonetheless, the mean terminal half-life (t1/2z) of efavirenz varied substantially between certain subpopulations. The results indicate, apart from pharmacogenetic covariates, that sex differences have a profound effect on population efavirenz plasma disposition. Nevertheless, drug concentrations at steady-state are rather governed by clearance than by the volume of distribution, probably rendering the impact of sex difference nonsignificant clinically.
Multiple population pharmacokinetic/pharmacogenetic models were tested during the development of a final model describing the clinical observations and predicting covariate effects on typical parameter estimates. Rather than using noncompartmental pharmacokinetic methods we evaluated the data using mixed-effects models. This approach facilitated the simultaneous quantification of multiple pharmacogenetic and demographic covariate effects and can ultimately also be used to forecast the covariate impact on dosing strategies, by simulation. So far, most efavirenz pharmacogenetic studies have focused on a few variant alleles, in particular CYP2B6*6 and ABCB1 (C3435T), to investigate the potential effect of genetic variation in predicting efavirenz plasma exposure and treatment response. In addition to the previously investigated SNPs, depending on the ethnic origin of the population studied, we selected new regulatory and coding SNPs that have not been characterized before but with possible functional effect as predicted by bioinformatics tools.
Both CYP2B6 G516T and A785G were in complete linkage disequilibrium, making the variant allele CYP2B6*6, and existed at a higher frequency in Ugandans, with >55% of subjects being carriers of at least one CYP2B6*6 allele. Compared with the wild-type subjects, the apparent oral clearance after a single dose was 21% lower in homozygous CYP2B6*6 subjects, regardless of sex differences. This is in agreement with other studies that have previously reported poor efavirenz clearance among carriers of CYP2B6*6[10, 12, 13]. We also found that CYP2B6*11 polymorphism resulted in a 20% lower efavirenz clearance following single-dose administration. Although CYP2B6*11 mutation seems to affect efavirenz clearance significantly, its clinical role and implications need to be further investigated during multiple-dose administration. Considering both CYP2B6*6 and *11 genotypes, homozygous carriers of both alleles were identified to have their apparent oral clearance reduced by 40% compared with wild-type metabolizers.
Although univariate stepwise inclusion of CYP3A5*3, *4, *7 and *9 in the model indicated statically significant influence, multivariate analysis did not identify these variant alleles as predictors of efavirenz plasma exposure. Therefore, despite the high frequency of the CYP3A5 polymorphism in Blacks and reported significant effects of defective alleles on enzyme activity [17], we found no significant effect of CYP3A5 variant alleles on efavirenz population pharmacokinetics. This could be due to the reported minor role of CYP3A in efavirenz metabolism [3]. However, during HIV and tuberculosis co-infection, efavirenz is used together with rifampicin, a potent CYP3A inducer, and therefore the observed minor effect of CYP3A5 variant alleles after a single dose might be altered during enzyme induction.
Few studies have investigated the influence of ABCB1 polymorphism, particularly 3435C→T, on efavirenz plasma levels and treatment response, and the results have been conflicting. One study [20] reported high plasma exposure and better immunological outcomes of efavirenz associated with ABCB1 (3435TT), but several studies have reported contrasting results [13, 21, 22], rendering its role unclear. Similarly, we found no significant effect of C3435T on efavirenz pharmacokinetics. Interestingly, among the investigated 13 SNPs in ABCB1, the model picked up a previously uncharacterized polymorphism in ABCB1 (rs3842:A4036G), located in the 3′-untranslated region as a predictor of efavirenz relative bioavailability. Mutant homozygote and heterozygote individuals for ABCB1rs3842 exhibited 26% greater efavirenz bioavailability than wild-type carriers. Similar to CYP2B6*6, ABCB1 rs3842 is frequent in Ugandans with allele frequency of 17%. According to dbSNP, ABCB1 rs3842 also occur with >20% SNP frequency in Asians, Europeans and Sub-Saharan African populations. The mechanism by which rs3842 regulates ABCB1 expression and the resulting effect on treatment response in different population warrant further investigation.
This study, being a single-dose population pharmacokinetic study, did not take into consideration the effect of efavirenz autoinduction on the reported results and hence has limited clinical implications. Therefore there is a need to investigate the effect of CYP2B6*6, CYP2B6*11, ABCB1 (rs3842) polymorphism and sex on efavirenz pharmacokinetics at steady-state, and preferably in a patient population, to assess the clinical relevance on efficacy, toxicity and evaluate the need for individualized dosing strategies. The presented model provides additional information regarding which pharmacogenetic polymorphisms to consider for further clinical relevance evaluation during chronic administration.
Antiretroviral drugs are metabolized by enzymes that display high genetic variations in Black populations and are increasingly used in Sub-Saharan-Africa. In summary, the use of mixed effects modelling allowed the analysis and integration of multiple pharmacogenetic and demographic covariates in a pharmacokinetic/pharmacogenetic population model. Among the several SNPs and other covariates investigated, CYP2B6 (*6 and *11), ABCB1 (rs3842) and sex were identified as the most important predictors of efavirenz apparent clearance and relative bioavailability, thereby influencing between-subject variability in efavirenz plasma exposure after single-dose administration. Although the effect of CYP2B6*6 on efavirenz pharmacokinetics has been described in detail before, our pharmacogenetic and population pharmacokinetic study in healthy Ugandan subjects further suggested the role of CYP2B6*11 and ABCB1 (rs3842) polymorphism on efavirenz pharmacokinetics, thus providing new prospects for predicting the efficacy of treatment and potential adverse effects of antiretroviral regimens in patients of African origin.
Competing interests
None to declare.
This study was funded by SIDA/SAREC, Grant No. SWE 2004-098, HIV-2006-031, SWE 2007-270 Makerere University-Karolinska Institutet research collaboration, EDCTP grant No. CT.2005.32030.001.
REFERENCES
- 1.Molina JM. Efficacy and safety of once-daily regimens in the treatment of HIV infection. Drugs. 2008;68:567–78. doi: 10.2165/00003495-200868050-00001. [DOI] [PubMed] [Google Scholar]
- 2.Scherpbier HJ, Bekker V, Pajkrt D, Jurriaans S, Lange JM, Kuijpers TW. Once-daily highly active antiretroviral therapy for HIV-infected children: safety and efficacy of an efavirenz-containing regimen. Pediatrics. 2007;119:e705–15. doi: 10.1542/peds.2006-1367. [DOI] [PubMed] [Google Scholar]
- 3.Ward BA, Gorski JC, Jones DR, Hall SD, Flockhart DA, Desta Z. The cytochrome P450 2B6 (CYP2B6) is the main catalyst of efavirenz primary and secondary metabolism: implication for HIV/AIDS therapy and utility of efavirenz as a substrate marker of CYP2B6 catalytic activity. J Pharmacol Exp Ther. 2003;306:287–300. doi: 10.1124/jpet.103.049601. [DOI] [PubMed] [Google Scholar]
- 4.Zhu M, Kaul S, Nandy P, Grasela DM, Pfister M. A model-based approach to characterize efavirenz autoinduction and concurrent enzyme induction with carbamazepine. Antimicrob Agents Chemother. 2009;53:2346–53. doi: 10.1128/AAC.01120-08. [DOI] [PMC free article] [PubMed] [Google Scholar]
- 5.Burger D, van der Heiden I, la Porte C, van der Ende M, Groeneveld P, Richter C, Koopmans P, Kroon F, Sprenger H, Lindemans J, Schenk P, van Schaik R. Interpatient variability in the pharmacokinetics of the HIV non-nucleoside reverse transcriptase inhibitor efavirenz: the effect of gender, race, and CYP2B6 polymorphism. Br J Clin Pharmacol. 2006;61:148–54. doi: 10.1111/j.1365-2125.2005.02536.x. [DOI] [PMC free article] [PubMed] [Google Scholar]
- 6.Haas DW, Ribaudo HJ, Kim RB, Tierney C, Wilkinson GR, Gulick RM, Clifford DB, Hulgan T, Marzolini C, Acosta EP. Pharmacogenetics of efavirenz and central nervous system side effects: an Adult AIDS Clinical Trials Group study. Aids. 2004;18:2391–400. [PubMed] [Google Scholar]
- 7.Desta Z, Saussele T, Ward B, Blievernicht J, Li L, Klein K, Flockhart DA, Zanger UM. Impact of CYP2B6 polymorphism on hepatic efavirenz metabolism in vitro. Pharmacogenomics. 2007;8:547–58. doi: 10.2217/14622416.8.6.547. [DOI] [PubMed] [Google Scholar]
- 8.Ofotokun I, Chuck SK, Hitti JE. Antiretroviral pharmacokinetic profile: a review of sex differences. Gend Med. 2007;4:106–19. doi: 10.1016/s1550-8579(07)80025-8. [DOI] [PubMed] [Google Scholar]
- 9.Brundage RC, Yong FH, Fenton T, Spector SA, Starr SE, Fletcher CV. Intrapatient variability of efavirenz concentrations as a predictor of virologic response to antiretroviral therapy. Antimicrob Agents Chemother. 2004;48:979–84. doi: 10.1128/AAC.48.3.979-984.2004. [DOI] [PMC free article] [PubMed] [Google Scholar]
- 10.Csajka C, Marzolini C, Fattinger K, Decosterd LA, Fellay J, Telenti A, Biollaz J, Buclin T. Population pharmacokinetics and effects of efavirenz in patients with human immunodeficiency virus infection. Clin Pharmacol Ther. 2003;73:20–30. doi: 10.1067/mcp.2003.22. [DOI] [PubMed] [Google Scholar]
- 11.Pfister M, Labbe L, Hammer SM, Mellors J, Bennett KK, Rosenkranz S, Sheiner LB. Population pharmacokinetics and pharmacodynamics of efavirenz, nelfinavir, and indinavir: adult AIDS Clinical Trial Group Study 398. Antimicrob Agents Chemother. 2003;47:130–7. doi: 10.1128/AAC.47.1.130-137.2003. [DOI] [PMC free article] [PubMed] [Google Scholar]
- 12.Nyakutira C, Roshammar D, Chigutsa E, Chonzi P, Ashton M, Nhachi C, Masimirembwa C. High prevalence of the CYP2B6 516G→T(*6) variant and effect on the population pharmacokinetics of efavirenz in HIV/AIDS outpatients in Zimbabwe. Eur J Clin Pharmacol. 2008;64:357–65. doi: 10.1007/s00228-007-0412-3. [DOI] [PubMed] [Google Scholar]
- 13.Haas DW, Smeaton LM, Shafer RW, Robbins GK, Morse GD, Labbe L, Wilkinson GR, Clifford DB, D'Aquila RT, De Gruttola V, Pollard RB, Merigan TC, Hirsch MS, George AL, Jr, Donahue JP, Kim RB. Pharmacogenetics of long-term responses to antiretroviral regimens containing Efavirenz and/or Nelfinavir: an Adult Aids Clinical Trials Group Study. J Infect Dis. 2005;192:1931–42. doi: 10.1086/497610. [DOI] [PubMed] [Google Scholar]
- 14.Saitoh A, Singh KK, Powell CA, Fenton T, Fletcher CV, Brundage R, Starr S, Spector SA. An MDR1-3435 variant is associated with higher plasma nelfinavir levels and more rapid virologic response in HIV-1 infected children. Aids. 2005;19:371–80. doi: 10.1097/01.aids.0000161766.13782.2f. [DOI] [PubMed] [Google Scholar]
- 15.Marzolini C, Telenti A, Decosterd LA, Greub G, Biollaz J, Buclin T. Efavirenz plasma levels can predict treatment failure and central nervous system side effects in HIV-1-infected patients. Aids. 2001;15:71–5. doi: 10.1097/00002030-200101050-00011. [DOI] [PubMed] [Google Scholar]
- 16.Nunez M, Gonzalez de Requena D, Gallego L, Jimenez-Nacher I, Gonzalez-Lahoz J, Soriano V. Higher efavirenz plasma levels correlate with development of insomnia. J Acquir Immune Defic Syndr. 2001;28:399–400. doi: 10.1097/00126334-200112010-00015. [DOI] [PubMed] [Google Scholar]
- 17.Mirghani RA, Sayi J, Aklillu E, Allqvist A, Jande M, Wennerholm A, Eriksen J, Herben VM, Jones BC, Gustafsson LL, Bertilsson L. CYP3A5 genotype has significant effect on quinine 3-hydroxylation in Tanzanians, who have lower total CYP3A activity than a Swedish population. Pharmacogenet Genomics. 2006;16:637–45. doi: 10.1097/01.fpc.0000230411.89973.1b. [DOI] [PubMed] [Google Scholar]
- 18.Kim RB, Fromm MF, Wandel C, Leake B, Wood AJ, Roden DM, Wilkinson GR. The drug transporter P-glycoprotein limits oral absorption and brain entry of HIV-1 protease inhibitors. J Clin Invest. 1998;101:289–94. doi: 10.1172/JCI1269. [DOI] [PMC free article] [PubMed] [Google Scholar]
- 19.Stormer E, von Moltke LL, Perloff MD, Greenblatt DJ. Differential modulation of P-glycoprotein expression and activity by non-nucleoside HIV-1 reverse transcriptase inhibitors in cell culture. Pharm Res. 2002;19:1038–45. doi: 10.1023/a:1016430825740. [DOI] [PubMed] [Google Scholar]
- 20.Fellay J, Marzolini C, Meaden ER, Back DJ, Buclin T, Chave JP, Decosterd LA, Furrer H, Opravil M, Pantaleo G, Retelska D, Ruiz L, Schinkel AH, Vernazza P, Eap CB, Telenti A. Response to antiretroviral treatment in HIV-1-infected individuals with allelic variants of the multidrug resistance transporter 1: a pharmacogenetics study. Lancet. 2002;359:30–6. doi: 10.1016/S0140-6736(02)07276-8. [DOI] [PubMed] [Google Scholar]
- 21.Nasi M, Borghi V, Pinti M, Bellodi C, Lugli E, Maffei S, Troiano L, Richeldi L, Mussini C, Esposito R, Cossarizza A. MDR1 C3435T genetic polymorphism does not influence the response to antiretroviral therapy in drug-naive HIV-positive patients. Aids. 2003;17:1696–8. doi: 10.1097/00002030-200307250-00016. [DOI] [PubMed] [Google Scholar]
- 22.Winzer R, Langmann P, Zilly M, Tollmann F, Schubert J, Klinker H, Weissbrich B. No influence of the P-glycoprotein genotype (MDR1 C3435T) on plasma levels of lopinavir and efavirenz during antiretroviral treatment. Eur J Med Res. 2003;8:531–4. [PubMed] [Google Scholar]
- 23.Sheiner LB, Beal SL. Evaluation of methods for estimating population pharmacokinetics parameters. I. Michaelis-Menten model: routine clinical pharmacokinetic data. J Pharmacokinet Biopharm. 1980;8:553–71. doi: 10.1007/BF01060053. [DOI] [PubMed] [Google Scholar]
- 24.Lindroos K, Liljedahl U, Syvanen AC. Genotyping SNPs by minisequencing primer extension using oligonucleotide microarrays. Methods Mol Biol. 2003;212:149–65. doi: 10.1385/1-59259-327-5:149. [DOI] [PubMed] [Google Scholar]
- 25.Lovmar L, Syvanen AC. Genotyping single-nucleotide polymorphisms by minisequencing using tag arrays. Methods Mol Med. 2005;114:79–92. doi: 10.1385/1-59259-923-0:79. [DOI] [PubMed] [Google Scholar]
- 26.Tang K, Ngoi SM, Gwee PC, Chua JM, Lee EJ, Chong SS, Lee CG. Distinct haplotype profiles and strong linkage disequilibrium at the MDR1 multidrug transporter gene locus in three ethnic Asian populations. Pharmacogenetics. 2002;12:437–50. doi: 10.1097/00008571-200208000-00004. [DOI] [PubMed] [Google Scholar]
- 27.Cascorbi I, Gerloff T, Johne A, Meisel C, Hoffmeyer S, Schwab M, Schaeffeler E, Eichelbaum M, Brinkmann U, Roots I. Frequency of single nucleotide polymorphisms in the P-glycoprotein drug transporter MDR1 gene in white subjects. Clin Pharmacol Ther. 2001;69:169–74. doi: 10.1067/mcp.2001.114164. [DOI] [PubMed] [Google Scholar]
- 28.Beal SL, Sheiner LB, Boeckmann AJ. NONMEM Users Guides. Ellicot City, MD: Icon Development Solutions; 1986. –2006. [Google Scholar]
- 29.Wilkins JJ. NONMEMory: a run management tool for NONMEM. Comput Methods Programs Biomed. 2005;78:259–67. doi: 10.1016/j.cmpb.2005.02.003. [DOI] [PubMed] [Google Scholar]
- 30.Jonsson EN, Karlsson MO. Xpose – an S-PLUS based population pharmacokinetic/pharmacodynamic model building aid for NONMEM. Comput Methods Programs Biomed. 1999;58:51–64. doi: 10.1016/s0169-2607(98)00067-4. [DOI] [PubMed] [Google Scholar]
- 31.Takano R, Sugano K, Higashida A, Hayashi Y, Machida M, Aso Y, Yamashita S. Oral absorption of poorly water-soluble drugs: computer simulation of fraction absorbed in humans from a miniscale dissolution test. Pharm Res. 2006;23:1144–56. doi: 10.1007/s11095-006-0162-4. [DOI] [PubMed] [Google Scholar]
- 32.Fayet A, Beguin A, de Tejada BM, Colombo S, Cavassini M, Gerber S, Eap CB, Telenti A, Buclin T, Biollaz J, Decosterd LA. Determination of unbound antiretroviral drug concentrations by a modified ultrafiltration method reveals high variability in the free fraction. Ther Drug Monit. 2008;30:511–22. doi: 10.1097/FTD.0b013e3181817318. [DOI] [PubMed] [Google Scholar]
- 33.Barrett JS, Joshi AS, Chai M, Ludden TM, Fiske WD, Pieniaszek HJ., Jr. Population pharmacokinetic meta-analysis with efavirenz. Int J Clin Pharmacol Ther. 2002;40:507–19. doi: 10.5414/cpp40507. [DOI] [PubMed] [Google Scholar]