

Abstract
Members of the IclR family of transcription regulators modulate signal-dependent expression of genes involved in carbon metabolism in bacteria and archaea. The Thermotoga maritima TM0065 gene codes for a protein (TM-IclR) that is homologous to the IclR family. We have determined the crystal structure of TM-IclR at 2.2 Å resolution using MAD phasing and synchrotron radiation. The protein is composed of two domains: the N-terminal DNA-binding domain contains the winged helix-turn-helix motif, and the C-terminal presumed regulatory domain is involved in binding signal molecule. In a proposed signal-binding site, a bound Zn2+ ion was found. In the crystal, TM-IclR forms a dimer through interactions between DNA-binding domains. In the dimer, the DNA-binding domains are 2-fold related, but the dimer is asymmetric with respect to the orientation of signal-binding domains. Crystal packing analysis showed that TM-IclR dimers form a tetramer through interactions exclusively by signal-binding domains. A model is proposed for binding of IclR-like factors to DNA, and it suggests that signal-dependent transcription regulation is accomplished by affecting an oligomerization state of IclR and therefore its affinity for DNA target.
The IclR (isocitrate lyase regulator) family of prokaryotic transcription regulators mediates the signal-dependent expression of operons related to carbon metabolism in eubacteria and archaea (1). There are over 100 known members of the IclR family found in 44 species of bacteria and 2 archaea, with 9 IclR homologues in Escherichia coli alone (www.ncbi.nlm.nih.gov:80/cgi-bin/Entrez/blink?pid=7442884). The most well-characterized members of the IclR family include the E. coli IclR glyoxylate shunt repressor that regulates acetate utilization encoded by aceBAK operon (2, 3), the Erwinia chrysanthemi pectin degradation pathway repressor KdgR (4), and the glycerol catabolism pathway repressor GylR of Streptomyces coelicolor (5). In each instance, the role of the IclR family member is to repress transcription of specific catabolic genes in the absence of specific substrates and then mediate de-repression in response to an excess of a signaling molecule. Several IclR-like proteins have been shown to regulate aromatic acid metabolism (6), and they also have been implicated in control of expression of sporulation and virulence genes (7, 8). However, a specific regulatory function has not been defined for many IclR sequence homologues.
The mechanism of signal-dependent transcriptional repression and de-repression can be deduced from the gene and operon structure and from genetic and mutagenesis studies. It has been proposed that IclR family members comprise two domains. The N-terminal domain, which has been designated PF01614 in the Pfam catalogue of motifs (9), contains a helix-turn-helix (HTH)1 DNA-binding motif, which is responsible for binding to the palindromic operator sequence (10, 11). The regulatory C-terminal domain most likely binds the signal molecule (small ligand). Mutations in the C-terminal region of the PobR repressor, a member of IclR family, alter the signal specificity without altering transcription activation or DNA binding functions (6). The mechanism of signal binding is unknown; however, the current model assumes that binding of the signal molecule to the C-terminal domain de-represses transcription by modulating either DNA binding, receptor multimerization, or the interaction of the repressor with the transcriptional machinery (6, 11).
The IclR-like protein of Thermotoga maritima (TM0065) was targeted as part of an ongoing structural genomics and proteomics initiative (www.mcsg.anl.gov) because it shows strong sequence similarity to other members of the IclR family (Fig. 1), and there was no structural information available about this class of transcription regulators. Although the specific biochemical function of this protein is unknown, a role in sugar metabolism is predicted. The TM0065 gene is located within a cluster of genes that is implicated in xylulose metabolism, and in E. coli, the catabolism of endogenously formed xylulose is mediated by the T. maritime IclR homologue YiaJ (12). In this report, we present the first crystal structure of an IclR-like transcriptional regulator at 2.2 Å resolution. TM-IclR is a dimer; each monomer consists of an N-terminal DNA-binding domain with a HTH motif and a C-terminal α/β domain. The C-terminal domain has features that are consistent with binding of a small signal molecule that may inhibit repression by TM-IclR. The model for TM-IclR mediated regulation is proposed.
Fig. 1. Protein sequence comparison.

14 members of the IclR family are compared, with completely conserved residues shown in red, and highly conserved residues shown in blue.
EXPERIMENTAL PROCEDURES
Protein Cloning Expression and Purification
The open reading frame of TM-IclR was amplified and cloned, and protein was purified and concentrated following procedures described previously (13). The open reading frame of iclR was amplified by PCR from T. maritima genomic DNA (American Type Culture Collection). The gene was cloned into the NdeI and BamHI sites of a modified pET15b cloning vector (Novagen) in which the TEV protease cleavage site replaced the thrombin cleavage site, and a double stop codon was introduced downstream from the Bam HI site. This construct provides for an N-terminal His6 tag separated from the gene by a TEV protease recognition site (ENLYFQ ↓ G). The fusion protein was overexpressed in E. coli BL21-Gold (DE3) (Stratagene) harboring an extra plasmid encoding three rare tRNAs (AGG and AGA for Arg, and ATA for Ile).
Large-scale expression of the recombinant proteins was performed by subculturing a 25-ml culture grown in a 250-ml flask, inoculated from fresh transformants, into 2 liters of LB with appropriate antibiotics in either a 6-liter flask or a custom-baffled 4-liter flask. The sample was induced at an A600 of 0.6 – 0.8 with 0.4 mM isopropyl-1-thio-β-D-galactopyranoside after growth at 37 °C, 220 rpm and grown overnight at 15 °C, 220 rpm. The cells were harvested by centrifugation (10 min at 8000 rpm; Beckman Coulter Avanti J-20 centrifuge). The cell pellet was resuspended to 40 ml with binding buffer, supplemented with 1 mM each of the protease inhibitors phenylmethylsulfonyl fluoride and benzamidine, flash-frozen in liquid nitrogen, and stored at −70 °C. The purification procedure used buffers containing 50 mM HEPES pH 7.5, 500 mM NaCl, 5% glycerol, and 5, 30, and 250 mM imidazole for the binding, wash, and elution buffers, respectively. The harvested cells were lysed by adding 0.5% Nonidet P-40 to the thawed sample before sonication (5 × 30 s; duty cycle, 50%; operation load, 6). Fresh protease inhibitors were added before the sample was clarified by centrifugation (30 min at 17000 rpm; Beckman Coulter Avanti J-25 centrifuge). The clarified lysate was passed by gravity through a DE52 column in series with a Ni2+ column. Contaminating proteins were removed by washing the Ni2+ column with 50 column volumes of wash buffer. The bound protein was removed with elution buffer as qualitatively determined by the Bradford assay. The sample was then brought to a final concentration of 0.5 mM EDTA, followed by the addition of a final concentration of 0.5 mM dithiothreitol. The His tag was removed by cleavage with recombinant His-tagged TEV protease (60 μg TEV/mg recombinant protein). The cleavage step was done concurrently with dialysis in binding buffer without imidazole at 4 °C overnight. The cut His tag and His-tagged TEV protease were removed from the purified recombinant protein by passage through a second Ni2+ column. The sample was prepared for crystallization screening by a second dialysis in 10 mM HEPES, pH 7.5, 500 mM NaCl, followed by concentration to 10 mg/ml using a BioMax concentrator (Millipore). Finally, any particulate matter was removed from the sample by passage through a 0.2 μm Ultra-free-MC centrifugal filtration device (Millipore).
Protein Crystallization
The protein was crystallized by vapor diffusion in hanging drops by mixing 2 μl of the protein solution (9 mg/ml) with 2 μl of 0.1 M HEPES pH 7, 5% PEG 8000, and 5% glycerol and equilibrated at 20 °C over 100 μl of this solution. Crystals, which appeared after 3 days, were flash-frozen in liquid nitrogen with crystallization buffer plus 20% glycerol as cryoprotectant prior to data collection.
Determination of TM-IclR Oligomeric State Using Size Exclusion Chromatography
High pressure liquid chromatography size exclusion chromatography was performed on a Superose-12 HR column (10 × 300 mm; Amersham Biosciences) pre-equilibrated with 10 mM HEPES pH 7.5, 0.5 M NaCl, using the System Gold (Beckman). The column was calibrated with cytochrome c (12.4 kDa), carbonic anhydrase (29 kDa), bovine serum albumin (66 kDa), alcohol dehydrogenase (150 kDa), β-amylase (200 kDa), and blue dextran (2000 kDa). A 25-μl TM-IclR protein sample at a 2 mg/ml concentration or premixed with standard proteins was centrifuged at 14,000 rpm for 10 min before being injected into the column through a 20-μl injection loop. Chromatography was carried out at 20 °C at a flow rate of 1 ml/min. The eluted proteins were detected by measuring the absorbance at 280 nm.
Data Collection
Diffraction data were collected at 100 K at the 19ID beamline of the Structural Biology Center at the Advanced Photon Source, Argonne National Laboratory. The three-wavelength inverse-beam MAD data up to 2.5 Å (peak, 12.6603 keV (0.9794 Å); inflection point, 12.6620 keV (0.9793 Å); high energy remote, 13.0000 keV (0.95385 Å)) were collected from a Se-Met-labeled protein crystal. One crystal (0.2 × 0.2 × 0.2 mm) was used to collect at 100 K all data MAD sets to 2.5 Å with 6 s exposure/1°/frame using a 200 mm crystal-to-detector distance. The total oscillation range was 160°, as predicted using strategy module within HKL2000 suite (14). The space group was C2 with a cell dimension of a = 115.23 Å, b = 61.08 Å, c = 95.91 Å, and β = 110.51°. All data were processed and scaled with HKL2000 (Table I) to an R-merge of 6.6%, 7.0%, and 8.0% for inflection point, peak, and remote, respectively. The native data were collected at 1.0332 Å wavelength to 2.2 Å (R-merge, 6.0%) from a single crystal at the SBC 19ID beamline and were used for phase extension and model refinement.
Table I.
Summary of crystal and MAD data
| Unit cell | a = 115.23 Å, b = 61.08 Å, c = 95.91 Å, β = 110.51° |
| Space group | C2 |
| Mass Da (246 residues) | 28,118 |
| Mol (AU) | 2 |
| SeMet (AU) | 14 |
| MAD data collection |
||||
|---|---|---|---|---|
| Edge | Peak | Remote | High resolution | |
| Wavelength (Å) | 0.9794 | 0.9793 | 0.9538 | 1.0332 |
| Resolution range (Å) | 2.5 | 2.5 | 2.5 | 30–2.2 (2.28–2.2) |
| No. of unique reflections | 22,291 | 21,602 | 21,094 | 27,598 |
| Completeness (%) | 97.8 | 96.9 | 94.6 | 85.9 (59.6) |
| R merge (%) | 6.5 | 7.0 | 8.0 | 6.0 (29.9) |
Structure Determination and Refinement
The structure was determined by MAD phasing using CNS (15) and initially refined to 2.7 Å using CNS against the averaged peak data. The initial model was built manually using O (16), and manual adjustment was completed using QUANTA (17). The model was further refined against native data to 2.2 Å. The final R was 0.237, and the free R was 0.300 with 2 σ data (Table II). Electron density calculated at 1.2 σ is well connected for most of the main chain, except for a few areas on the surface of the molecules (Fig. 1). Molecule A is better ordered than molecule B. The stereochemistry of the structure was checked with PROCHECK (18) and the Ramachandran plot. The main chain torsion angles for all residues except two residues are in allowed regions, and the two residues are in additional allowed regions.
Table II.
Crystallographic statistics
| Phasing |
|||||||
|---|---|---|---|---|---|---|---|
| Resolution range (Å) | Centric |
Acentric |
All |
||||
| FOM | Phasing power | FOM | Phasing power | No. | FOM | Phasing power | |
| 50.0–2.5 | 0.646 | 2.21 | 0.48 | 1.61 | 32,995 | 0.49 | 1.63 |
| Density modification | 0.83 | ||||||
| Refinement | |||||||
| Resolution range (Å) | 30–2.2 | ||||||
| No. of reflections | 22290 | ||||||
| σ cutoff | 2.0 | ||||||
| R-value (%) | 23.2 | ||||||
| Free R-value (%) | 30.0 (2225) | ||||||
| Rms deviations from ideal geometry | |||||||
| Bond length (1–2) (Å) | 0.007 | ||||||
| Angle (°) | 1.23 | ||||||
| Dihedral (°) | 21.8 | ||||||
| Improper (°) | 0.83 | ||||||
| No. of atoms | |||||||
| Protein | 3968 | ||||||
| CO2 | 3 | ||||||
| Water | 111 | ||||||
| Mean B-factor (Å2) | |||||||
| All atoms | 62.9 | ||||||
| Protein atoms | |||||||
| Protein main chain | 62.1 | ||||||
| Protein side chain | 63.3 | ||||||
| 59.6 | |||||||
| Water | 60.0 | ||||||
| Ramachandran plot statistics (%) | |||||||
| Residues in most favored regions | 99.6 | ||||||
| Residues in additional allowed regions | 0.4 | ||||||
| Residues in disallowed region | 0.0 | ||||||
DNA Binding Modeling and Structural Comparisons
DNA docking was done on SGI work station with program O (16) and using regular B-DNA model. Calculation of binding cavities were done with SURFNET (18) and VOIDOO (19).
RESULTS AND DISCUSSION
Structure of TM-IclR
The structure of the full-length (246 residues) TM-IclR was determined and refined to a resolution of 2.2 Å. The final R-factor is 0.237 with a free R of 0.300 and preserving proper stereochemistry (Table I). The PROCHECK analysis showed that all but two residues, Asn31 and Lys56 in subunit A, had backbone conformations (φ, ψ) in the most favorable region. These two residues ((φ, ψ) are in the additionally allowed region. The electron density for the main chain is continuous except for some regions on the surface of the molecules, and the electron density for most of the side chains is excellent (Fig. 2).
Fig. 2. Electron density representation of the dimer interface of the DNA-binding domain.
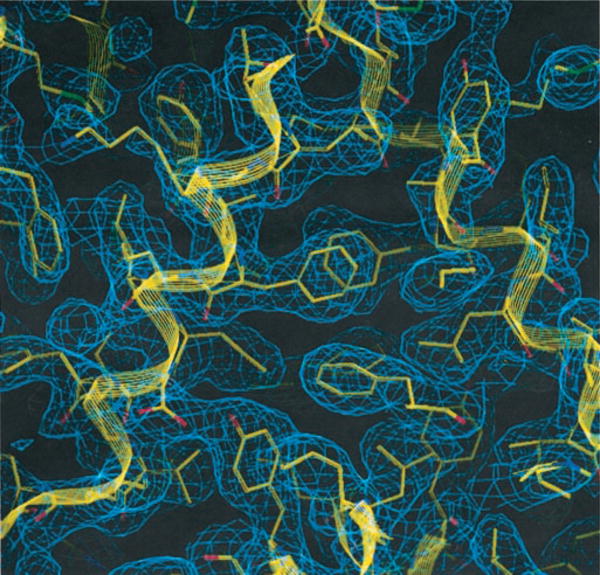
The 2Fo-Fc electron density contoured at 1.2 σ represents a part of the dimer interface between the two DNA-binding domains (DBDs) from each monomer. Several hydrophobic residues including 4 phenylalanine amino acids in H1s are well defined at 2.2 Å resolution.
The protein consists of two α/β domains, a small N-terminal DNA-binding domain and a larger C-terminal putative signal-binding (repression inhibition) domain (Fig. 3). These domains are linked by an α-helix and a short loop, which we term the “linking region.” The protein crystallized as a dimer; the dimerization interface is formed entirely by the DNA-binding domain (Fig. 3B).
Fig. 3. IclR topology and its dimer and tetramer arrangement.

A, IclR topology. The DNA-binding domain consists of three α-helices (H1–H3) and a β-hairpin forming a wing. The signal-binding domain forms a half TIM barrel with three small α-helices in the concave side and two longer α-helices in the convex side of the barrel. The two domains are linked by an α-helix (H4). B, the asymmetric dimer. The dimer interface is formed exclusively between the two HTH DNA-binding domains. Each monomer is color-coded red and green. C, the tetramer viewed from the top (DBD) is composed of two asymmetric dimers represented as four different colors, red and green for one asymmetric unit and yellow and magenta for the other. The tetramer interface is formed exclusively between signal-binding domains, which also include a metal ion in a putative ligand-binding pocket in each domain. D, IclR tetramer represented as a charge potential surface drawing in top and side views.
The HTH DNA-binding motif of the N-terminal domain is composed of two small, consecutive α-helices (H2 and H3 and the 4-residue turn connecting them). This motif is found in many other transcriptional regulators (20). The HTH motif is followed by a short α-helix and a β-hairpin, which connects to the linking region. The architecture of the DNA-binding domain closely resembles that of the winged HTH, a relatively recently recognized but well-established major groove DNA-binding domain (21). The distance between HTH motifs in the dimer is relatively short (33.46 Å between Cα of Val34 in HTH), suggesting that IclR spans a narrow minor groove and recognizes a rather short (12–14-bp) palindromic DNA sequence, consistent with the proposed AT-rich 14-bp binding site for the E. coli IclR protein (10, 11). It is also quite clear that in order for the HTH motifs to interact with the major groove, the N termini must be inserted into the minor groove of the DNA.
The dimerization interface comprises the α-helices H1 and H4. The hydrophobic interface formed by the two H1 α-helices from the N-terminal domains includes four aromatic side chains, two from each monomer. A number of additional hydrophobic interactions (such as Ala7-Leu4) and H-bonds (such as Asp12-Tyr67) are also found at the dimer interface.
The C-terminal putative regulatory and signal-binding domain is composed of a six-stranded anti-parallel β-sheet, five α-helices, and one short 310 helix (Fig. 3). The strongly curved β-sheet forms a half barrel and divides the five α-helices into two subgroups; two relatively longer α-helices (H4 and H5) lie on the outside of the curved sheet with the remaining three (H6, H7, and H8) on the inside, forming an α/β/α structure. The H6 α-helix is inserted into the half barrel and is parallel to the sheet surface. The α-helices H7 and H8 close one end of the half barrel. There is an additional short β-strand (S5′) within the long loop (L3) at the edge of the β-sheet (Fig. 3). In the dimer, the C-terminal domains do not contact each other.
The crystal structure also revealed a divalent metal ion in each of the C-terminal domains (modeled as Zn2+ ion) bound to Cys196 (Zn-S distance is 2.70 Å) and located near the N terminus of α-helix H6 (Fig. 4). In addition, the metal-binding site (443 Å3), as obtained from SURFNET (18), contains three water molecules and is the best candidate region for a signal-binding pocket. Moreover, an unassigned electron density was found also at the subunit interface formed by α-helices H4 in the “linking region.” A molecule of formate ( ) was modeled into this density, although formate was not present under the purification or crystallization conditions. The putative formate molecule, which refined well, is sandwiched by pairs of 2-fold related Ser69, Gly68, and Ile65. It is not clear what role formate could play, if any, in TM-IclR function. The formate binding site could also accommodate acetate. Acetate is utilized as a sole source of carbon by enzymes encoded in the IclR-controlled aceBAK operon in E. coli, and, therefore its binding might be functionally relevant.
Fig. 4. Putative signal-binding pocket.

The putative signal-binding pockets formed between the two signal-binding domains from either molecules A and B′ (A) or molecules B and A′ (B). A′ and B′ were generated by 2-fold (crystallographic) symmetry operation of A and B, respectively. Due to the two different orientations of these domains, the two pockets are slightly different in size, shape, and location relative to the DBDs. The volume (calculated with VOIDOO (19)) of the pocket between molecule A and B′ is bigger (10 Å3) than that between molecules B and A′ (2.3 Å3). The former is opened toward the DBD, and the latter is opened to the opposite side of DBD. The small size of these pockets suggests that only a portion of the signal molecule would fit into the void.
TM-IclR Dimer Is Asymmetric
The crystal asymmetric unit contains a dimer that is predicted to be a minimal DNA binding unit because the majority of proteins with domains containing HTH function as dimers and bind 2-fold symmetric DNA targets. In promoters known to be regulated by IclR family members, many palindromes (or pseudopalindromes) have been identified (10, 11). The 2-fold character of the operators for the IclR family is therefore consistent with the 2-fold symmetry of the DNA-binding domains in the crystal structure.
The C-terminal ligand-binding domains, which are not directly involved in dimer formation, are not related by 2-fold symmetry, thus making the dimer asymmetric. The linking regions (residues 62–79) in the two monomers in the asymmetric unit adopt two different conformations, which results in two different orientations of the ligand-binding domains with respect to the HTH dimer (Fig. 3B). The difference in the orientation of the two ligand-binding domains is clearly explained by the differences in the main chain torsion angles (φ,ψ) for the residues Phe75 (−66.9°, 135.9° versus −97.7°, 93.1°) and Asn76 (−113.5°, 94.4° versus −47.7°, −40.0°) in the linking regions in the two monomers. Therefore, it is clear that Phe75 and Asn76 can assume two distinct conformations. This asymmetry may have functional implications (see below).
Analysis of crystal packing revealed that TM-IclR dimers may form tetramers. Although the ligand-binding domains do not participate in formation of the asymmetric dimer, they interact directly with the corresponding domains from neighboring asymmetric units. These interactions result in the formation of a tetramer, a dimer of identical asymmetric dimers (Fig. 3C). The tetramerization interface is substantial (5366.3 Å2) and is composed exclusively of the ligand-binding domains, suggesting that the tetramer may be of biological relevance. This contention is supported by recent mass spectroscopy experiments on the DNA-bound form of the IclR protein from E. coli (22). These experiments also suggested that both dimeric and tetrameric species existed in solution for IclR and GclR repressors of E. coli. Size exclusion chromatography showed that the TM-IclR is a dimer in solution (data not shown). Taken together, the structural information and the oligomerization experiments are consistent with the hypothesis that TM-IclR is a dimer in the absence of signal and DNA but adopts a tetrameric structure when bound to DNA in the absence of signal molecule.
DNA-binding Domain
In the dimer, the HTH reading heads are positioned to interact with a palindromic 12–14-base pair operator, with specific contacts predominantly in the major groove of the DNA. The H2 α-helix is aligned ~90° to the predicted recognition α-helix (H3). The α-helix H3 is partially disordered in molecule B, perhaps because the DNA is absent from the structure. The two helices are connected by a short loop. The 3 residues that connect the H2 and H3 α-helices (Asn31, Met32, and Ser33) are in left-handed helix, α-helix, and α-helix conformations, respectively. These residues constitute a typical turn in a HTH motif. In TM-IclR, the surface encompassing the HTH is positively charged (Figs. 3D and 5), providing additional verification for DNA binding. The amino acid sequences of H2 and H3 α-helices are not conserved among members of IclR family, except for two hydrophobic resides (Met41 and Leu44) as well as Glu25 and Ser35 (Fig. 1), which suggests that these α-helices mediate DNA sequence specificity among IclR family members that recognize different DNA targets.
Fig. 5. DNA binding model.

A, B-DNA is modeled to bind a IclR tetramer as shown in the space-filling model on top of the IclR tetramer represented in the charge potential surface drawing. The known IclR DNA target and the consensus sequences are included. B, proposed DNA binding model A: a tetramer IclR binds to two consecutive palindromic DNA targets. C, proposed DNA binding model B: a tetrameric IclR binds to two palindromic DNA targets that are far apart (>100 bp), looped, and come back and lined either in parallel (left) or in anti-parallel (right).
The N-terminal end of the H1 α-helix that precedes the HTH appears to be in a position to contact the minor groove of the DNA (the N terminus, Asn2, Thr3, Lys5, and Lys6 are good candidates to make contacts with DNA), therefore suggesting that nucleotides near the 2-fold dyad may affect IclR specificity. These interactions would be enhanced by partial positive charge of the N terminus of α-helix. The sequence of the H1 α-helix is not conserved, except for Leu4 and Ile10 (Fig. 1). In addition, the region consisting of the β-hairpin (the wing) and the loop connecting H1 and H2 α-helices in the N-terminal DNA-binding domain may serve as a flexible hinge (Gly19 and conserved Gly48 and Gly61) to accommodate DNA targets with different half-site spacing. Therefore, the wing portion of the winged HTH in TM-IclR may be functionally/structurally different from that of other winged domains such as hRFX1 (23). However, the flexibility of this moiety and its contribution to DNA binding need to be thoroughly examined by biochemical/physical analyses including high-resolution x-ray crystallography using a number of different DNA targets with different half-site spacings, although the TM-IclR DNA target has yet to be identified. In any case, the β-hairpin in TM-IclR is much smaller than that of hRFX1 and may not interact with DNA directly as seen in the hRFX1 structure.
The HTH domain of TM-IclR was compared with other HTH motifs in the structural data base. When the spatial arrangement of the α-helices H1, H2, and H3 was compared, the HTH domain of TM-IclR was most similar to those of three HTH protein groups: toxin repressor (24), CAP (25), and HNF-3/fork head (26). The wing portion of TM-IclR was also compared with other proteins and was found to be quite different from other domains with respect to the size of the loop. The histone H5 and HNF-3 winged domains have longer loops compared with TM-IclR (27); the toxin repressor family has shorter loops (24). However, the SmtB HTH, Synechococcus PCC7942 trans-acting dimeric repressor, is structurally almost identical to the HTH of TM-IclR (27).
DNA Binding Model
Our data indicate that TM-IclR is a dimer in solution in the absence of the signal molecule and the DNA target. We modeled TM-IclR dimer on a linear 20-base pair fragment of B-DNA by examining other prokaryotic DNA-binding HTH domain-DNA complexes (Fig. 5). Two consecutive major grooves of the DNA are contacted by the two HTH reading heads, which consist of the two consecutive α-helices (H2–H3) connected by the sharp turn. The α-helix H1 is modeled to be in close contact with the minor groove between the two major grooves. Although the DNA-binding domain of TM-IclR has a winged HTH motif, the wing is too far from DNA and may not interact directly with DNA. Rather, it may provide flexibility to the reading head if the protein binds DNA targets with different half-site spacing.
Interestingly, the dimer in the crystal structure appears to form a tetramer with the asymmetric unit dimer that is related by the crystallographic 2-fold symmetry. The tetramer is created by interaction between the signal domains of two asymmetric dimers. This observation is consistent with recent mass spectroscopy experiments suggesting that it is a tetramer that binds the DNA targets (22).
To gain insight as to the possible relevance of the tetramerization observed by mass spectroscopy and observed in the crystal structure, we modeled the TM-IclR tetramer on a fragment of duplex DNA (Fig. 5). In the tetrameric assembly found in the crystal structure, the two dimeric DNA-binding domains are aligned parallel and approximately linearly. There are two possible ways that this tetramer can bind the DNA target: (i) model A, two operator sites might be aligned sequentially with a specific spacing (6 –8 bp) between the two sites; or (ii) model B, the two operator sites might be aligned side by side (from two different duplexes or a looped duplex) (Fig. 5). In model A, the tetramer binds a DNA target composed of two 2-fold symmetry-related binding sites; each binding site would contain two 2-fold symmetry-related half-sites. This interaction would be predicted to increase the specificity for an operator consisting of two 14-bp half-sites with the proper half-site spacing. In model B, the two DNA sites would be located in two different duplexes or on the same duplex with a separation of >100 bp. In this model, either the DNA loops back, forming an anti-parallel arrangement, or the DNA loops around, forming a parallel arrangement reminiscent of the tetrameric lac repressor-operator interaction (28). Analysis of the acetate operon (10, 11, 22, 29), whose expression is under the transcriptional control of the iclR gene in E. coli, indicated that the E. coli IclR repressor recognizes a 35-bp palindromic sequence. This observation is consistent with the binding of two IclR dimers to two 14-bp binding sites separated by 7 bp (model A).
The Signal-binding Domain
The C-terminal domain comprises a six strand anti-parallel β-sheet, which separates five α-helices. The fold most closely resembles the structure of profilin, an actin-binding protein, although there is little sequence identity (6%). Both structures contain a pocket within the β-sheet. In TM-IclR, the pocket is formed by the inner surface of concave β-sheet, the loop (L3), and a small α-helix (H6). The pocket contains the residues in PobR that mediate inducer (6) and are reasonably conserved among IclR family members (Fig. 1).
In the TM-IclR structure, the pocket is occupied by water molecules and a divalent metal ion (assigned as Zn2+) bound to Cys196. This region is formed by parts of TM-IclR that mediate tetramer formation, residues 214 –220 and 114 –118. The proximity of the presumed ligand-binding region to the region involved in tetramerization suggests that ligand binding and tetramerization may be linked. Because tetramerization and DNA binding are also connected, the proximity of the signal-binding and tetramerization domains revealed in the crystal structure may provide the link between signal binding and DNA binding.
Based on the structural data, we can propose the following mechanism for TM-IclR-mediated gene regulation. We suggest that TM-IclR binds weakly to DNA as a dimer in the absence of signal molecule. In the presence of two adjacent binding sites, IclR cooperatively forms a high-affinity, stable tetrameric complex that represses transcription. In the presence of the signal molecule, whose identity at present remains unknown, binding to the specific site leads to a disruption of the tetramer, decreased affinity for DNA, and increased transcription. This hypothesis is consistent with published data, in which it has been shown that the binding of ligands to IclR inhibits DNA binding. For example, the formation of the IclR-DNA complex is inhibited by the binding of phosphoenol pyruvate, one of the metabolites involved in glyoxylate bypass (29). Glyoxylate bypass occurs when acetate becomes the sole source of carbon. The enzymes in the glyoxylate pathway are encoded by the aceBAK operon, which is also under IclR control. There is also some evidence that IclR-mediated gene regulation can be further modulated by the level of IclR expression (30), which could affect equilibrium between dimers and tetramers.
Acknowledgments
We thank all members of the Structural Biology Center at Argonne National Laboratory for their help in conducting experiments.
Footnotes
The abbreviations used are: HTH, helix-turn-helix; DBD, DNA-binding domain; MAD, multiple wavelength anomalous dispersion.
The atomic coordinates and structure factors (code 1JMR and RCSB013946) have been deposited in the Protein Data Bank, Research Collaboratory for Structural Bioinformatics, Rutgers University, New Brunswick, NJ (http://www.rcsb.org/).
This work was supported by National Institutes of Health Grant GM62414, the Ontario Research and Development Challenge Fund, and by the United States Department of Energy Office of Biological and Environmental Research under contract W-31-109-Eng-38. The submitted manuscript has been created by the University of Chicago as Operator of Argonne National Laboratory (“Argonne”) under Contract No. W-31-109-ENG-38 with the United States Department of Energy.
References
- 1.Nasser W, Reverchon S, Condemine G, Robert-Baudouy J. J Mol Biol. 1994;236:427–440. doi: 10.1006/jmbi.1994.1155. [DOI] [PubMed] [Google Scholar]
- 2.Maloy SR, Nunn WD. J Bacteriol. 1982;149:173–180. doi: 10.1128/jb.149.1.173-180.1982. [DOI] [PMC free article] [PubMed] [Google Scholar]
- 3.Sunnarborg A, Klumpp D, Chung T, LaPorte DC. J Bacteriol. 1990;172:2642–2649. doi: 10.1128/jb.172.5.2642-2649.1990. [DOI] [PMC free article] [PubMed] [Google Scholar]
- 4.Nasser W, Reverchon S, Robert-Baudouy J. Mol Microbiol. 1992;6:257–265. doi: 10.1111/j.1365-2958.1992.tb02007.x. [DOI] [PubMed] [Google Scholar]
- 5.Hindle Z, Smith CP. Mol Microbiol. 1994;12:737–745. doi: 10.1111/j.1365-2958.1994.tb01061.x. [DOI] [PubMed] [Google Scholar]
- 6.Kok RG, D’Argenio DA, Ornston LN. J Bacteriol. 1998;180:5058–5069. doi: 10.1128/jb.180.19.5058-5069.1998. [DOI] [PMC free article] [PubMed] [Google Scholar]
- 7.van Wezel GP, van der Meulen J, Kawamoto S, Luiten RG, Koerten HK, Kraal B. J Bacteriol. 2000;182:5653–5662. doi: 10.1128/jb.182.20.5653-5662.2000. [DOI] [PMC free article] [PubMed] [Google Scholar]
- 8.Nomura K, Nasser W, Kawagishi H, Tsuyumu S. Proc Natl Acad Sci U S A. 1998;95:14034–14039. doi: 10.1073/pnas.95.24.14034. [DOI] [PMC free article] [PubMed] [Google Scholar]
- 9.Bateman A, Birney E, Durbin R, Eddy SR, Howe KL, Sonnhammer EL. Nucleic Acids Res. 2000;28:263–266. doi: 10.1093/nar/28.1.263. [DOI] [PMC free article] [PubMed] [Google Scholar]
- 10.Pan B, Unnikrishnan I, LaPorte DC. J Bacteriol. 1996;178:3982–3984. doi: 10.1128/jb.178.13.3982-3984.1996. [DOI] [PMC free article] [PubMed] [Google Scholar]
- 11.Donald LJ, Chernushevich IV, Zhou J, Verentchikov A, Poppe- Schriemer N, Hosfield DJ, Westmore JB, Ens W, Duckworth HW, Standing KG. Protein Sci. 1996;5:1613–1624. doi: 10.1002/pro.5560050815. [DOI] [PMC free article] [PubMed] [Google Scholar]
- 12.Ibanez E, Campos E, Baldoma L, Aguilar J, Badia J. J Bacteriol. 2000;182:4617–4624. doi: 10.1128/jb.182.16.4617-4624.2000. [DOI] [PMC free article] [PubMed] [Google Scholar]
- 13.Korolev S, Ikeguchi Y, Skarina T, Beasley S, Edwards A, Joachimiak A, Pegg AE, Savchenko A. Nat Struct Biol. 2001;9:27–31. doi: 10.1038/nsb737. [DOI] [PMC free article] [PubMed] [Google Scholar]
- 14.Otwinowski Z, Minor W. Methods Enzymol. 1997;276:307–326. doi: 10.1016/S0076-6879(97)76066-X. [DOI] [PubMed] [Google Scholar]
- 15.Brunger AT, Adams PD, Clore GM, DeLano WL, Gros P, Grosse-Kunstleve RW, Jiang JS, Kuszewski J, Nilges M, Pannu NS, Read RJ, Rice LM, Simonson T, Warren GL. Acta Crystallogr Sect D Biol Crystallogr. 1998;54:905–921. doi: 10.1107/s0907444998003254. [DOI] [PubMed] [Google Scholar]
- 16.Jones TA, Zou JY, Cowan SW, Kjeldgaard M. Acta Crystallogr. 1991;A47:110–119. doi: 10.1107/s0108767390010224. [DOI] [PubMed] [Google Scholar]
- 17.Molecular Simulations Inc. QUANTA. San Diego, CA: 2000. [Google Scholar]
- 18.Laskowski RA. J Mol Graph. 1995;13:323–330. doi: 10.1016/0263-7855(95)00073-9. [DOI] [PubMed] [Google Scholar]
- 19.Kleywegt GJ, Jones TA. Acta Crystallogr. 1994;D50:178–185. doi: 10.1107/S0907444993011333. [DOI] [PubMed] [Google Scholar]
- 20.Wintjens R, Rooman M. J Mol Biol. 1996;262:294–313. doi: 10.1006/jmbi.1996.0514. [DOI] [PubMed] [Google Scholar]
- 21.Clubb RT, Omichinski JG, Savilahti H, Mizuuchi K, Gronenborn AM, Clore GM. Structure. 1994;2:1041–1048. doi: 10.1016/s0969-2126(94)00107-3. [DOI] [PubMed] [Google Scholar]
- 22.Donald LJ, Hosfield DJ, Cuvelier SL, Ens W, Standing KG, Duckworth HW. Protein Sci. 2001;10:1370–1380. doi: 10.1110/ps.780101. [DOI] [PMC free article] [PubMed] [Google Scholar]
- 23.Gajiwala KS, Chen H, Cornille F, Roques BP, Reith W, Mach B, Burley SK. Nature. 2000;403:916–921. doi: 10.1038/35002634. [DOI] [PubMed] [Google Scholar]
- 24.Pohl E, Holmes RK, Hol WG. J Mol Biol. 1999;292:653–667. doi: 10.1006/jmbi.1999.3073. [DOI] [PubMed] [Google Scholar]
- 25.Passner JM, Steitz TA. Proc Natl Acad Sci U S A. 1997;94:2843–2847. doi: 10.1073/pnas.94.7.2843. [DOI] [PMC free article] [PubMed] [Google Scholar]
- 26.Clark KL, Halay ED, Lai E, Burley SK. Nature. 1993;364:412–420. doi: 10.1038/364412a0. [DOI] [PubMed] [Google Scholar]
- 27.Cook WJ, Kar SR, Taylor KB, Hall LM. J Mol Biol. 1998;275:337–346. doi: 10.1006/jmbi.1997.1443. [DOI] [PubMed] [Google Scholar]
- 28.Friedman AM, Fischmann TO, Steitz TA. Science. 1995;268:1721–1727. doi: 10.1126/science.7792597. [DOI] [PubMed] [Google Scholar]
- 29.Cortay JC, Negre D, Galinier A, Duclos B, Perriere G, Cozzone AJ. EMBO J. 1991;10:675–679. doi: 10.1002/j.1460-2075.1991.tb07996.x. [DOI] [PMC free article] [PubMed] [Google Scholar]
- 30.Gui L, Sunnarborg A, LaPorte DC. J Bacteriol. 1996;178:4704–4709. doi: 10.1128/jb.178.15.4704-4709.1996. [DOI] [PMC free article] [PubMed] [Google Scholar]