

Introduction
Drug-resistant microorganisms are an important health issue, as many human pathogens have gained resistance to a wide range of commercially available pharmaceuticals. A number of targets from pathogenic organisms have been selected for structural studies at the Midwest Structural Biology Center with the objective to broaden our knowledge about these organisms, acquire information on the mechanisms that trigger their resistances to known antibiotics, and potentially provide a foundation for drug discovery. Pseudomonas aeruginosa is an opportunistic human pathogen that has a natural resistance to many antibiotics and disinfectants.1 It causes infections throughout the body, including the urinary tract, respiratory system, the skin, soft tissue, bones, and joints.
Herein, we report the crystal structure of PA2721, a 17.6 kDa uncharacterized protein from P. aeruginosa PAO1. The structure of PA2721 has been determined and refined to 1.60 Å by the single wavelength anomalous dispersion (SAD) method using a selenomethionine (SeMet) derivative of PA2721. Data collection, refinement, and model validation statistics are summarized in Table I. The final model includes four protein molecules in the asymmetric unit that are organized into two pairs of homodimers [Fig. 1(a)]. The dimension of the dimer is approximately 71 ×43 ×30 Å. Each monomer is composed of eight β-strands (arranged in two β-sheets β1–β4 and β5–β8) and five α-helices, and is organized into two domains. The N-terminal domain is made up of a β1 ↑ α1 ↓ β2 ↑ β3 ↓ β4 ↑ motif, whereas the C-terminal domain has a β5 ↓ α2 ↑ β6 ↓ β7 ↑ β8 ↓ motif plus an extra three α-helices at the C-terminus (α3–α5) [Fig. 1(b)]. The repeat of the βαβββ motif within the monomer could indicate the possibility that this structure evolved by gene duplication and fusion events, as it was suggested by Bergdoll et al.2 for enzymes containing a similar fold.
TABLE I.
Summary of Crystal Parameters, Data Collection, and Refinement Statistics
| Space group | P1 |
| Unit cell parameters | a = 44.55 Å, b = 55.02 Å, c = 67.07 Å α = 70.71°, β = 89.89°, γ = 85.61° |
| Wavelength (Å) | 0.9794 |
| Resolution range (Å) | 33.80–1.60 |
| No. of unique reflections | 65,177 |
| Completeness (%) | 86.8 |
| Average I/σa | 26.68 (3.32)a |
| Redundancy | 1.9 |
| Rsym (%)b | 3.68 (21.12)a |
| Rcryst (%)b | 17.2 |
| Rfree (%)b | 19.3 |
| RMSD from ideality | |
| Bond lengths (Å) | 0.009 |
| Bond angles (deg) | 1.168 |
| Average B-value | 15.01 |
| Protein residues/atoms | 599/4,670 |
| Solvent molecules | 544 |
Numbers in parentheses indicate values for the highest resolution shell.
I/σ is the mean reflection intensity divided by the average estimated error.
Rsym = (Σ|Ihkl – 〈I〉|)/ΣIhkl, where the average intensity 〈I〉 is taken over all symmetry equivalent measurements and Ihkl is the measured intensity for any given reflection.
Rcryst = ||Fo| – |Fc||/|Fo|, where Fo and Fc are the observed and calculated structure factor amplitudes, respectively. Rfree is equivalent to Rcryst but is calculated for 5.1% of the reflections chosen at random and omitted from the refinement process.
Fig. 1.
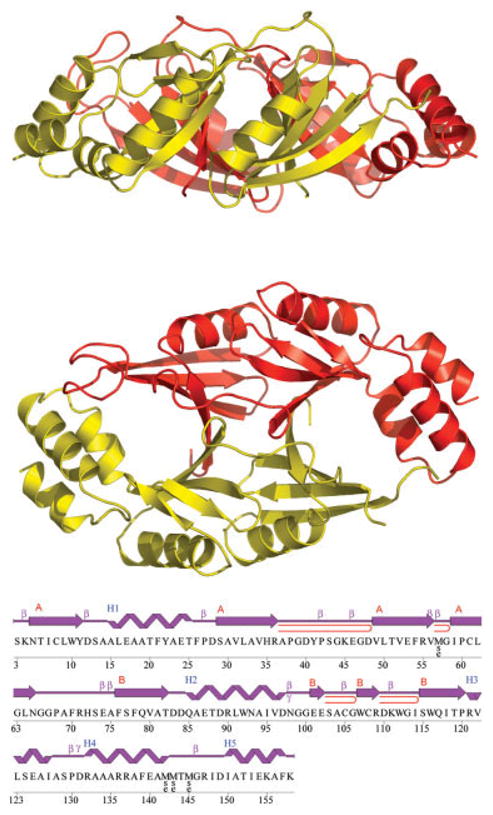
A: Ribbon diagrams of the dimer of PA2721viewed in a side orientation (top) and viewed down the noncrystallographic twofold relating the subunits (bottom). B: Diagram showing the secondary structure elements and primary sequence of PA2721. The strands that belong to each β-sheet are labeled A,B; β-hairpins are indicated as red loops, β-bulges are marked by β, γ-turns are marked by γ.20
Although there is no significant sequence similarity between the domains, 42 Cα pairs superimposed with a root-mean-square deviation (RMSD) of 1.67 Å. Crystallographic packing analysis, as well as the solvent accessible surface area calculation using AreaIMol from the CCP4 program suite, showed extensive interaction between tightly associated monomers with ~1,900 Å2 of buried surface of the monomer.3 Therefore, it is likely that the homodimer is the biologically relevant oligomeric form. The dimer interface consists of an antiparallel interaction between the β4-strand of the N-terminal domain from one subunit and the β5-strand of the C-terminal domain of the opposite subunit, which leads to the formation of two curved 8-stranded β-sheets [Fig. 1(a)]. The fold recognition programs 3DHit and DALI server revealed that PA2721 bore significant similarity to members of the βαβββ superfamily such as the fosfomycin resistance proteins FosA and FosX and the metalloenzyme glyoxalase I.4,5 The closest matches are the structures of fosfomycin resistance protein [Protein Data Bank (PDB) code: 1LQP; Z-score 5.6, sequence identity 20.6%, RMSD 2.35 Å], and Ni(II)-bound glyoxalase I (PDB code: 1F9Z; Z-score 5.3, sequence identity 18%, RMSD 2.28 Å).6 Structural analysis of the members of the βαβββ superfamily indicates that substrate binding sites of these enzymes are located at the subunit–subunit interface, within the inside cleft formed by the curved 8-stranded β-sheets.2 Despite the low sequence similarity among members of the family and the high diversity of reactions they catalyze, there is good conservation of the active center residues and their location within the enzymes. This conservation is particularly strong among members that require metal ions for catalytic activity. For example, the residues involved in Fe+2 coordination in extradiol dioxygenase (E.C.1.13.11.39) (H146, H210, and E260) superimposed within 0.7–1.4 Å (Cα atoms) of the Zn+2 coordinating residues in glyoxalase I (Q33, E99, H126, E172) (E.C.4.4.1.5).2,7 However, PA2721 is unlikely to bind metal ions because superimposition of PA2721 with these enzymes using the SSM server showed that residues H35, G146, F76, E117 occupy equivalent positions.8 These residues are unlikely to provide a good environment for metal ion coordination.
To determine possible functionally significant motifs/active centers in PA2721, we applied a nest analysis as implemented in Profunc and active center pattern recognition searches using the program pvSoar. Profunc identified two functionally significant structural motifs formed by the following residues: S13, A14, A15, and W112, G113, I114.9,10 The comparison of active center pockets, surface patterns, and conservation of structurally important residues between PA2721 and structures in PDB database with pvSoar revealed a pocket on the PA2721 surface that is similar to the active center pocket of phosphatidylinositol-specific phospholipase C from Bacillus cereus (PDB code: 5PTD).11 The PA2721 pocket is positioned at the domain–domain interface, within the monomer and is lined by Y11, P68, R71, H72 in addition to the residues identified by Profunc. The active center pocket of the phospholipase C is positioned at the C-terminal end of the β-barrel with residues H32, R69, H82, K115, R163, W178, Y200 involved in interaction with the inhibitor inositol.12 Calculation of solvent-accessible areas for the active center revealed that in PA2721 the pocket has a solvent accessible area 204.6 A2 and an accessible volume 178.1 A3 in comparison to a solvent accessible area 197.721 A2 and an accessible volume 111.070 A3 for the active site pocket of phosphatidylinositol-specific phospholipase C. Therefore, both ProFunc and pvSoar detected similar regions in the protein as functionally important; however, the chemical nature of the potential ligand as well as the specific biochemical function of PA2721 is not clear.
In summary, the PA2721 protein has been identified as a new member of βαβββ family with structural similarity to fosfomycin resistance protein and glyoxalase I, and has a potential active site similar to phosphatidylinositol-specific phospholipase C, suggesting that it binds a phosphatidylinositol-like compound. Further biochemical and biophysical studies are needed to gain detailed understanding of this protein’s function.
Protein Cloning Expression and Purification
The ORF of PA2721 was amplified by polymerase chain reaction from Escherichia coli genomic DNA (ATCC). The gene was cloned into the NdeI and BamHI sites of a modified pET15b cloning vector (Novagen) in which the TEV protease cleavage site replaced the thrombin cleavage site and a double stop codon was introduced downstream from the BamHI site. This construct provides an N-terminal His6-tag separated from the gene by a TEV protease recognition site (ENLYFQ↓G). The fusion protein was overexpressed in E. coli BL21-Gold [DE3 (Stratagene)] harboring an extra plasmid encoding three rare tRNAs (AGG and AGA for Arg, ATA for Ile). The cells were grown in LB at 37°C to an OD600 of ~0.6 and protein expression induced with 0.4 mM isopropyl-β-D-thiogalactopyranosid. After induction, the cells were incubated with shaking overnight at 15°C. The harvested cells were resuspended in binding buffer (500 mM NaCl, 5% glycerol, 50 mM HEPES pH 7.5, 5 mM imidazole), flash-frozen in liquid N2, and stored at −70°C. The thawed cells were lysed by sonication after the addition of 0.5% NP-40 and 1 mM each of PMSF and benzamidine. The lysate was clarified by centrifugation (30 min at 27,000g) and passed through a DE52 column preequilibrated in binding buffer. The flow-through fraction was then applied to a metal chelate affinity-column charged with Ni2+. The His6-tagged protein was eluted from the column in elution buffer (500 mM NaCl, 5% glycerol, 50 mM HEPES pH 7.5, 500 mM imidazole) and the tag then cleaved from the protein by treatment with recombinant His-tagged TEV protease. The cleaved protein was then resolved from the cleaved His6-tag and the His6-tagged protease by flowing the mixture through a second Ni2+-column.
The PA2721 protein was dialyzed in 10 mM HEPES pH 7.5, 500 mM NaCl, and concentrated using a BioMax concentrator (Millipore). Before crystallization, any particulate matter was removed from the sample by passing through a 0.2-μm Ultrafree-MC centrifugal filter (Millipore). For the preparation of SeMet labeled protein, PA2721 was expressed in the methionine auxotroph strain B834(DE3) of E. coli (Novagen) and purified under the same conditions as the native protein in supplemented M9 media. The reducing reagent β-mercaptoethanol (5 mM) was added to all purification buffers.
Protein Crystallization
The protein was crystallized by the vapor diffusion method in hanging drops by mixing 2 μL of the protein solution with 2 μL of 0.2 M di-ammonium hydrogen citrate and 20% polyethylene glycol 3350, and equilibrated at 20°C over 500 μL of this solution. PA2721 crystallizes in the triclinic space group P1 with a cell dimension a = 44.55 Å, b = 55.02 Å, c = 67.07 Å, α = 70.71°, β = 89.89°, γ = 85.61°. Before data collection, crystals were soaked for ~20 s in a cryoprotectant consisting of a 25% ethylene glycol in the crystal mother liquor, and then flash-frozen in liquid nitrogen.
Data Collection
Diffraction data were collected at 100 K at the 19ID beamline of the Structural Biology Center at the Advanced Photon Source, Argonne National Laboratory.
SAD data to 1.6 Å [12.6603 keV (0.9794 Å)] were collected from a SeMet-substituted protein crystal as described earlier by Walsh et al.13 One crystal was used for data collection at 100 K and a total oscillation range of 360° was obtained using inverse beam geometry. Data were integrated, reduced, and scaled with the HKL2000 suite.14 Data statistics are summarized in Table I.
Structure Determination and Refinement
The structure was determined by SAD phasing using autoSHARP and refined against the peak data with REFMAC5.2,15 The initial model was autotraced with 1.6 Å data using the program ARP/wARP.16 The partial model obtained from ARP/wARP was subsequently manually extended, and rebuilt with O and COOT.17,18 The electron density map contoured at 1.0 σ is well connected for most of the main chain, except for the surface-exposed residues 38 – 48 of molecules C and D, which have been omitted from the model. The stereochemistry of the structure was checked with PROCHECK.19 Final refinement statistics are presented in Table I.
Accession Number
Atomic coordinates have been deposited into the PDB as 1U69.
Fig. 2.
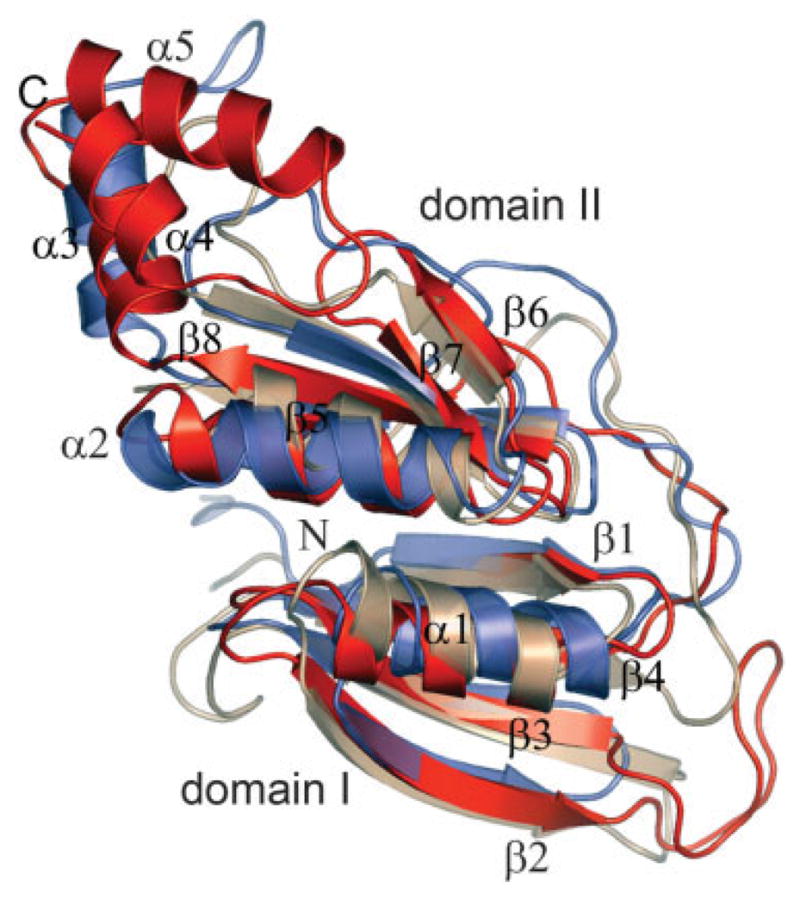
Ribbon diagram of a superposition of a monomer of PA2721 (red) with a monomer of the fosfomycin resistance protein (FosA) (PDB code: 1lqk) (blue) and glyoxylase I (PDB code: 1f9z) which have been identified as the closest matching folds. The images were generated with the program PyMol.21
Acknowledgments
National Institutes of Health; Grant number: GM62414; Grant sponsor: United States Department of Energy, Office of Biological and Environmental Research; Grant number: W-31-109-Eng-38.
The authors thank Andrew Binkowski for the use of pvSoar server and all members of the Structural Biology Center at Argonne National Laboratory for their help in conducting experiments and Lindy Keller for help in preparation of the manuscript.
Footnotes
This article is a US government work and, as such, is in the public domain in the United States of America.
This article was created by the University of Chicago as Operator of Argonne National Laboratory (“Argonne”) under Contract No. W-31-109-ENG-38 with the U.S. Department of Energy. The U.S. Government retains for itself, and others acting on its behalf, a paid-up, nonexclusive, irrevocable worldwide license in said article to reproduce, prepare derivative works, distribute copies to the public, and perform publicly and display publicly, by or on behalf of the Government.
References
- 1.Stover CK, Pham XQ, Erwin AL, et al. Complete genome sequence of Pseudomonas aeruginosa PA01, an opportunistic pathogen. Nature. 2000;406:959–964. doi: 10.1038/35023079. [DOI] [PubMed] [Google Scholar]
- 2.Bergdoll M, Eltis LD, Cameron AD, Dumas P, Bolin JT. All in the family: structural and evolutionary relationships among three modular proteins with diverse functions and variable assembly. Protein Sci. 1998;7:1661–1670. doi: 10.1002/pro.5560070801. [DOI] [PMC free article] [PubMed] [Google Scholar]
- 3.Collaborative Computational Project, N. The CCP4 suite: programs for protein crystallography. Acta Crystallogr D Biol Crystallogr. 1994;50:760–763. doi: 10.1107/S0907444994003112. [DOI] [PubMed] [Google Scholar]
- 4.Plewczynski D, Pas J, von Grotthuss M, Rychlewski L. 3D-Hit: fast structural comparison of proteins. Appl Bioinformatics. 2002;1:223–225. [PubMed] [Google Scholar]
- 5.Holm L, Sander C. Dali/FSSP classification of three-dimensional protein folds. Nucleic Acids Res. 1997;25:231–234. doi: 10.1093/nar/25.1.231. [DOI] [PMC free article] [PubMed] [Google Scholar]
- 6.Golovin A, Oldfield TJ, Tate JG, et al. E-MSD: an integrated data resource for bioinformatics. Nucleic Acids Res. 2004;32:D211–216. doi: 10.1093/nar/gkh078. [DOI] [PMC free article] [PubMed] [Google Scholar]
- 7.Cameron AD, Olin B, Ridderstrom M, Mannervik B, Jones TA. Crystal structure of human glyoxalase I: evidence for gene duplication and 3D domain swapping. EMBO J. 1997;12:3386–3395. doi: 10.1093/emboj/16.12.3386. [DOI] [PMC free article] [PubMed] [Google Scholar]
- 8.Krissinel E, Henrick K. Secondary-structure matching (SSM), a new tool for fast protein structure alignment in three dimensions. Acta Crystallogr D Biol Crystallogr. 2004;60:2256–2268. doi: 10.1107/S0907444904026460. [DOI] [PubMed] [Google Scholar]
- 9.Laskowski RA, Watson JD, Thornton JM. From protein structure to biochemical function? J Struct Funct Genomics. 2003;4:167–177. doi: 10.1023/a:1026127927612. [DOI] [PubMed] [Google Scholar]
- 10.Watson JD, Milner-White EJ. A novel main-chain anion-binding site in proteins: the nest. A particular combination of phi,psi values in successive residues gives rise to anion-binding sites that occur commonly and are found often at functionally important regions. J Mol Biol. 2002;315:171–182. doi: 10.1006/jmbi.2001.5227. [DOI] [PubMed] [Google Scholar]
- 11.Binkowski TA, Adamian L, Liang J. Inferring functional relationships of proteins from local sequence and spatial surface patterns. J Mol Biol. 2003;332:505–526. doi: 10.1016/s0022-2836(03)00882-9. [DOI] [PubMed] [Google Scholar]
- 12.Gassler CS, Ryan M, Liu T, Griffith OH, Heinz DW. Probing the roles of active site residues in phosphatidylinositol-specific phospholipase C from Bacillus cereus by site-directed mutagenesis. Biochemistry. 1997;36:12802–12813. doi: 10.1021/bi971102d. [DOI] [PubMed] [Google Scholar]
- 13.Walsh MA, Dementieva I, Evans G, Sanishvili R, Joachimiak A. Taking MAD to the extreme: ultrafast protein structure determination. Acta Crystallogr D Biol Crystallogr. 1999;55:1168–1173. doi: 10.1107/s0907444999003698. [DOI] [PubMed] [Google Scholar]
- 14.Otwinowski Z, Minor W. Processing of X-ray diffraction data collected in oscillation mode. Macromol Crystallogr A. 1997;276:307–326. doi: 10.1016/S0076-6879(97)76066-X. [DOI] [PubMed] [Google Scholar]
- 15.delaFortelle E, Bricogne G. Maximum-likelihood heavy-atom parameter refinement for multiple isomorphous replacement and multiwavelength anomalous diffraction methods. Method Enzymol. 1997;276:472–494. doi: 10.1016/S0076-6879(97)76073-7. [DOI] [PubMed] [Google Scholar]
- 16.Perrakis A, Morris R, Lamzin VS. Automated protein model building combined with iterative structure refinement. Nat Struct Biol. 1999;6:458–463. doi: 10.1038/8263. [DOI] [PubMed] [Google Scholar]
- 17.Jones TA, Zou JY, Cowan SW, Kjeldgaard M. Improved methods for building protein models in electron-density maps and the location of errors in these models. Acta Crystallogr A. 1991;47:110–119. doi: 10.1107/s0108767390010224. [DOI] [PubMed] [Google Scholar]
- 18.Emsley P, Cowtan K. Coot: model-building tools for molecular graphics. Acta Crystallogr D Biol Crystallogr. 2004;60:2126–2132. doi: 10.1107/S0907444904019158. [DOI] [PubMed] [Google Scholar]
- 19.Laskowski RA, Macarthur MW, Moss DS, Thornton JM. Procheck: a program to check the stereochemical quality of protein structures. J Appl Crystallogr. 1993;26:283–291. [Google Scholar]
- 20.Laskowski RA, Hutchinson EG, Michie AD, Wallace AC, Jones ML, Thornton JM. PDBsum: a Web-based database of summaries and analyses of all PDB structures. Trends Biochem Sci. 1997;22:488–490. doi: 10.1016/s0968-0004(97)01140-7. [DOI] [PubMed] [Google Scholar]
- 21.DeLano WL. The PyMOL molecular graphics system. 2002 Available at: http://www.pymol.org.